Generate clear test reports
Introduction
This article will be useful for specialists not only in testing, but also from other areas.
I think everyone understands that reporting is often the part that is required on a project, but it is always problematic to compile it. Everyone, sooner or later, is faced with the problem of “how to describe it?”, “What to write?” And the main thing “why and who will read it?”.
In fact, a report is an important and concise form of information transfer from the contractor to the customer. This is a response to its technical requirements and at the same time information on the work done.
Today we will talk about testing reports. In the article you will find emphasis on important points when creating reports.
Clear Testing Report
Creating a clear test report (test-report) in practice.
First, let's recall the definition:
A report is a document containing information about the actions performed, the results of the work performed. Usually it includes tables, graphs, lists, simply describing the information in the form of text. Their proportion and content determine the usefulness and clarity of the report.
It is important for us to understand for whom, for what and under what conditions we do it and how much it will improve the perception of the information we present. We must remember that each action has a specific goal. In the case of a report, it is important for us to understand for whom, for what, and under what conditions we do it.
Let's look at the scheme:
')
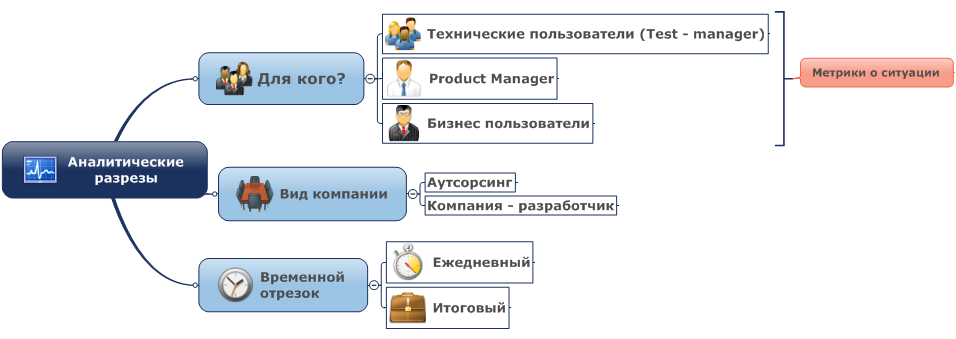
Analytical profiles - this is our report. In it, we give an analysis of our work and an assessment of the product being tested.
The type of company, in an ideal situation, should not affect the quality and semantic capacity of reporting. In the real world, unfortunately, the reporting of outsourcing companies is, as a rule, better and more capacious than the reporting of staff testing departments (there are also pleasant exceptions).
We, like any other outsourcing company, are forced to pay great attention to the quality and transparency of reporting, because it is the key customer metric for evaluating our work.
Reporting itself can be divided into final and regular - daily, weekly, monthly, versioned (for each version of the product), etc. The differences lie in the depth of the time sample.
So, before writing a report, we first need to decide for whom we are writing it.
For whom we make a report?
When creating a report, it is important to understand for whom it is created, and who will read it.
Based on the priorities of the target audience, we must determine what information should contain the report. Accordingly, during the project, information should be consolidated in the direction that needs to be reflected.
We can distinguish three groups of target audiences:
1. Technical users - Test-manager. For them, priority is given to understanding the course of testing, what problems arise, how they are solved, building the process itself, testing, describing the methods and technologies used.
2. Product Manager , they are Product Managers. Their focus is focused on the timing of implementation, extracts from the test results without unnecessary technical details and on general statistics (digital and comparative metrics).
3. Business users . Usually these are the people who make decisions to complete testing. They also determine the quality of the work done. For them, first of all, the final result is important in the most concise and clear format (yes / no), visual presentation of information (graphs, charts), expert opinion on the possibility of releasing the product into the industrial environment, etc., without going into details .
Conclusion: To write a report that will suit all groups is almost impossible. Before you write a report, be sure to determine the target audience. Depending on it, the content will be very different in its structure and contain different details needed by a particular group.
What is the depth of time sampling?
Reports can be divided into two types with respect to time:
1. (Weekly, daily, monthly) / intermediate.
In general, this is practically the same final report, but with changed focus priorities and a reduced depth of the time sample. It must contain two main metrics:
- Evaluation of the readiness of the product.
- Evaluation of the work performed on testing for the time between reporting (progress).
This report should show the dynamics of your work.
It is important to remember that progress is not a constant, but a dynamic value, it is determined by comparing the state of the project last week and the present. Accordingly, progress - this set of metrics, allowing to understand the state of the project.
They are created for each project individually, based on the goals that are set for successful testing. Metrics are set when creating TC (test cases), passing TC (failed \ passed), detecting defects (critical). They allow accessible and quickly enough to make an overall comparative picture of the project. If you, for example, use TestLink, then you understand that metrics allow you to make a quick sample of problems, compile statistics of failed TCs, etc.
This information is useful and necessary for the Product Manager , it is composed and controlled by the Test-manager, as well as by QE and SQE.
There is one more important and frequently used type of temporary report - versional (iteration report).
It is similar to the final. It describes the tasks that were performed by the testing team for a specific version of the product.
2. Final / final.
In the final report, it is important to show a general view of the work done (in the context of the established metrics) and the evolution of the product.
Also, it is necessary to give exhaustive information about the status of the product at the moment (the number of uncorrected errors remaining, whether the product has been fully tested or requires an additional testing cycle, an assessment of the possibility of product release into the "outside world", etc.).
Conclusion: Keep statistics using metrics throughout the entire project. It will help you at the right time to provide any information to the customer and will relieve you of the fear of the questions “What exactly did you do on the fourth week?” And “What do we have with the deadlines?”.
What methods of presenting information and data to use in the report?
When a technical specialist writes for another technical specialist, the question of applying certain methods of reflecting information rarely arises. Terms, formulas, professional slang is familiar and understandable. It is much more difficult to write reports for people who are relatively far from the specifics of testing.
For Business Users , they often use the presentation of information in the form of graphs. They clearly show how much the product is ready for release into the industrial environment, how many percent the project is completed.
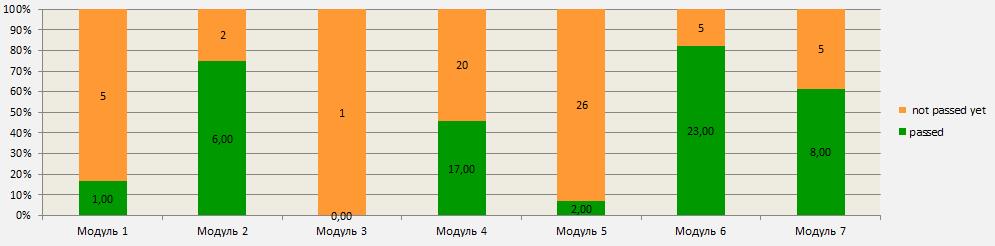
This may be, for example, the schedule of the passed TC of modules. It will clearly show how much work has already been done in each module and will help isolate problems.
Also, a graph of the relationship between the created tickets (detected bugs) and closed (fixed bugs) can be very useful. Not for nothing, it is the main in many task trackers.
In the case of productive work of programmers on correcting defects and writing quality code, the critical error curve with the release of a new release tends to the bottom, while the priority and importance of errors also decreases.
But, if developers or testers pay little attention to existing defects, the curve of closed bugs grows more slowly than non-closed bugs.
In the ideal case, the curve of unclosed bugs (found but not corrected) should converge with the corrected curve. In other words, for the final release it is necessary that all defects be eliminated. If this is not the case, then management may decide to extend the development and testing in order to eliminate all defects or to release the product in “prod”, taking the possible risks.
In addition to the schedule, it is necessary to draw up a pivot table. The graph is based on this data.
Here is an example of the table on the basis of which the graph of the passed TCs by modules was built:

Conclusion: The schedule for business users is an obligatory part of reporting. It is informative, accessible and understandable to the end user, demonstrates the dynamics of activity on the project or, in the worst case, stagnation.
Also, the use of graphs in reports for any users and technical specialists is advisable when you need to quickly and clearly compare the numbers and show the dynamics.
WHAT DO I NEED TO STATE IN THE REPORT ALWAYS?
It may seem that different types of reports are very different.
However, they have similarities and data that should always be indicated.
Here they are:
1. Team members;
2. Deadlines for which the report is compiled;
3. Description of testing processes;
4. Changes in the test model, the addition of TC;
5. The percentage of passed TC;
6. Critical and blocking problems and measures taken to eliminate them;
7. The results of the regression (plus an emphasis on the remaining problems);
8. Plan for the next iteration \ week \ month;
Items 3, 4, 6 and 8 should be written with an eye on the target audience of the report.
The seventh point should be indicated when the “regression testing” was conducted. Usually this item appears in the "versioned" reports.
Paragraph 8 of the final report is excluded.
Conclusion
So, we understood our target audience, marked the period for which we would write the report, determined the content and blocks. In fact, this is practically all that is needed to form a clear document that will surely find a response in the heads of those to whom it is addressed.
Write your reports in detail, competently and with pleasure, because a good report is at least one third of the work and the only part that is visible to someone other than testers and programmers.
The author: Efremova Daria
Source: https://habr.com/ru/post/207512/
All Articles