Graphing tools for .NET. Part 2
In the first part of the article there was a review of free graphing solutions for the .NET Framework. But after the comments listed a number of options that are not in the article, it was decided to put them in a separate publication. This section presents only commercial solutions.
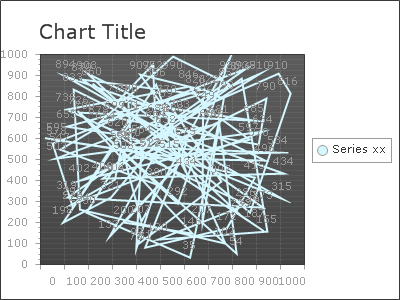
At first it is worth making a small digression about how all this is implemented. Since I did not have the right to upload commercial binaries to the public access (in most cases I used the evaluation license), then, of course, just downloading the source code from the repository , you cannot immediately see how the paid solutions work. Instead of the expected graphics, you will see this picture:

To make your chosen graphics work, just follow the link and download the appropriate distributor.
This review adds 6 commercial solutions:
- Chart Fx . Paid solution for building all kinds of graphs. According to the documentation, it supports .NET, java, HTML5, COM, WPF, Silverligth, Sql Reporting Services. Convenient to develop, confident middling speed. Separately, I can note the adequate and friendly support service - I had the pleasure to talk with them. In my opinion, the prices are slightly too high, since the package of components is significantly inferior to the same telerik and devexpress.
- DevExpress . An extremely popular package of UI controls, which covers a much wider range of components, and not just graphical data visualization. Anticipating the question, I will say that I used not the latest version of DevExpress (13.2), but the previous one (13.1), since I downloaded it literally a couple of days before the release. Among the graphing tools, the component was used for WinForms, since I could not force the web control to render the drawing, although I spent a lot of time. Maybe not enough perseverance, maybe he really can not do this on the server side. The performance results are below average by rating.
- Telerik . Another huge package of components that is not inferior in size to DevExpress. Like all serious decisions, it has a great potential to customize the appearance, but it works for an unreasonably long time on the default settings. I did not try to reset all those buns that the developers hung on it by default, otherwise it would be unfair. In justification to such giants as DevExpress and Telerik, one can only say that data visualization is not the only task that their component package solves, therefore the demand from them is small. If you are a happy license holder for their component packages, then you can use graphs without complicating your life.
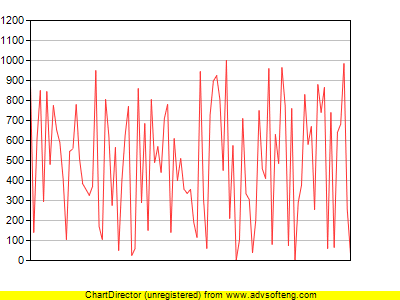
- Chart director . A decent cross-platform (.NET, java, ASP, COM, VB, PHP, Perl, Python, Ruby, ColdFusion, C ++) package, sharpened for data visualization. Otherwise, I did not see any significant advantages over other commercial solutions, except for speed (the smartest of paid solutions).
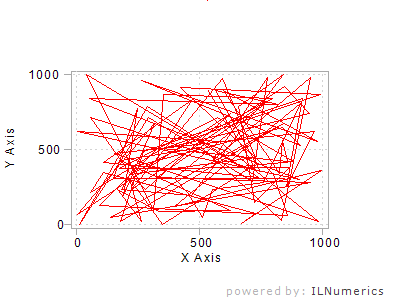
- ILNumerics . Chic math library written exclusively for .NET. It was possible to get acquainted only with the part that relates to data visualization, but even that was enough to understand how it is voluminous. Because of this, it has a rather high entry threshold and not the most intuitive architecture, so I would not recommend using it if you don’t want to spend hours on a simple line chart. For serious math problems that also require data visualization, I have not seen anything better for .NET.
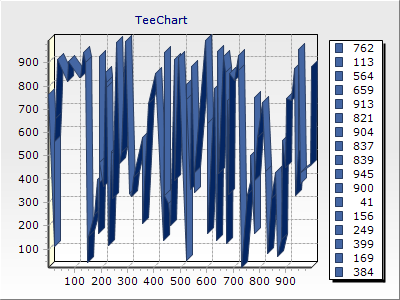
- Tee chart . Provides components for plotting under .NET, Java, ActiveX / COM, PHP, Delphi VCL / FireMonkey. Good performance, convenient architecture. The result is very good, although it does not stand out in front of competitors.
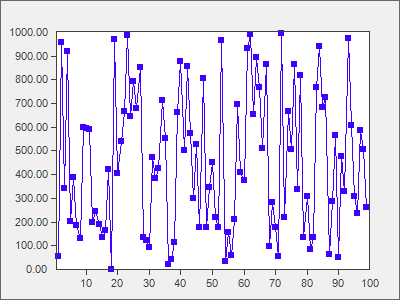
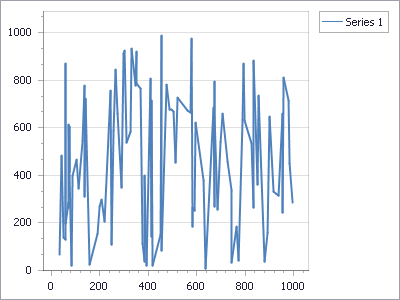
To understand what is being tested here and why, I recommend that you first read the first part of the article. The data for drawing plots is an array of 2 * n pseudo-random numbers in the specified range. Testing was conducted with the following set of input data: the number of iterations for each solution (10), the number of graphs per iteration (10), the resolution of the output image (400 * 300 px), the number of points on one graph (100), the maximum allowable value in set (1000). PC parameters on which the tests were run - (Intel Core I5 3.10 GHz, 8gb RAM, Windows 7 x64)
By the way, what was not pleasant in some solutions is that sometimes developers automatically sort the array of input data in ascending order, therefore on some graphs the broken line strictly increases along the x-axis. Not sure whether this is good or bad, but IMHO is an unnecessary and unnecessary restriction that is imposed on the developer.
For completeness, I decided to add free solutions from the previous article to the table of results, their description is available there.
| No | Decision | License | Number of iterations | Total time (sec) | Average iteration time (sec) |
| one | Zed graph | Free | ten | 2.281 | 0.2281 |
| 2 | Dislin charts | Free | ten | 2.591 | 0.2591 |
| 3 | ChartDirector | Commercial | ten | 3.604 | 0.3604 |
| four | NPlot | Free | ten | 3.846 | 0.3846 |
| five | Oxy plot | Free | ten | 4.091 | 0.4091 |
| 6 | Web chart control | Free | ten | 4.305 | 0.4305 |
| 7 | Microsoft Chart Controls | Free | ten | 4.353 | 0.4353 |
| eight | Chart FX | Commercial | ten | 5.3 | 0.53 |
| 9 | ILNumerics | Commercial | ten | 6.079 | 0.6079 |
| ten | DevExpress | Commercial | ten | 7.614 | 0.7614 |
| eleven | Tee charts | Commercial | ten | 10.004 | 1.0004 |
| 12 | Telerik charts | Commercial | ten | 11.496 | 1.1496 |
| 13 | Open minded plot | Free | ten | 13.034 | 1.3034 |
| 14 | Google Sharp charting | Free | ten | 14.12 | 1.412 |
Let me remind you that the author's opinion may differ from your views, so it will be cool if you leave your feedback on the experience of using graphing tools for .NET. Also, if you know any other solutions that are not included in the review - write, and I will try to add them.
The DynamicDataDisplay mentioned by the NeoNN user in the previous part is not included because I could not get him to render the graph into a drawing.
')
Source: https://habr.com/ru/post/206918/
All Articles