Introduction to parallel computing in R
 This article is devoted to the language of R. It is not as widespread on the ex-USSR territory as Matlab and especially Python, but it certainly deserves attention. It should be noted that R is actually a standard for Data Science (although it is well written here that data scientists do not live by a single R). The rich syntax, compatibility with legacy code (which is very important in scientific applications), the convenient RStudio development environment and the presence of a huge number of libraries in CRAN make R such.
But, as always, the flip side of the coin (or rather, the interpreter R) is the speed of calculations . R supports vectorized calculations — the apply family of functions allows you to avoid using loops. But this is, in general, syntactic sugar, and often the effect of "acceleration" from using * apply is still negative. Against this background, a completely logical step (if we do not consider the transition to lower level languages) looks like parallelization of calculations. It is no secret that the code is difficult to follow this procedure.
Further work will require two packages - “foreach” (allows the use of the foreach construct) and “doSNOW” (provides support for parallel computing). From CRAN you can install them like this:
install.packages(c("foreach","doSNOW")) The following commands - preparation of the "cluster" of the three processor cores to work:
library(foreach) library(doSNOW) cluster <- makeCluster(3, type = "SOCK", outfile="") registerDoSNOW(cluster) ')
Consider an example where the sum of squares of numbers from 1 to 10,000 is calculated:
system.time ({ sum.par <- foreach(i=1:10000, .combine='+') %dopar% { i^2 }}) In principle, everything is very similar to a normal cycle, except that you need to specify how to group the results — in this case, the addition operation (and often these are the functions c, rbind, cbind — or a handwritten function). If it does not matter in which order to group, then using the argument .inorder = F allows to speed up the calculations somewhat. If the% do% directive is used instead of% dopar%, then the calculations will be performed sequentially (that is, as in a normal loop). By the way, for such a simple task the execution time in the sequential version will be noticeably less, since invoices for data manipulation in a parallel version are far from the last place in the balance sheet.
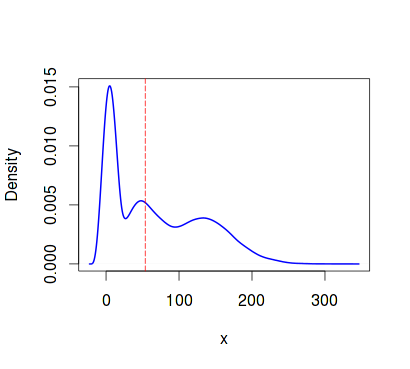
Let's move on to a more difficult task. Suppose we have a vector of random variables x .
Hidden text
trials <- 10000 n <- 24000 alfa <- 1.6 beta <- 3 set.seed(1) x <- c(rgamma(n/3, shape=alfa, scale=beta), rgamma(n/3, shape=3*alfa, scale=4*beta), rgamma(n/3, shape=10*alfa, scale=3*beta)) plot(density(x, kernel="cosine"),lwd=2, col="blue", xlab="x",ylab="Density", main="Density plot") abline(v = median(x), col = "red", lty=5) Estimate the median - indicating the confidence intervals. For this, we apply bootstrap and measure the execution time for serial and parallel code, respectively:
set.seed(1) seq.time <- system.time({ seq.medians <- foreach(icount(trials), .combine=cbind) %do% { median(sample(x, replace = T)) } }) > quantile(seq.medians, c(.025, .975)) 2.5% 97.5% 52.56311 54.99636 > seq.time user system elapsed 19.884 0.252 20.138 set.seed(1) par.time <- system.time({ par.medians <- foreach(icount(trials), .combine=cbind) %dopar% { median(sample(x, replace = T)) } }) > quantile(par.medians, c(.025, .975)) 2.5% 97.5% 52.56257 54.94890 > par.time user system elapsed 4.252 0.420 10.893 The difference is quite palpable. Let us estimate the run time of the sequential “vectorized” version for the same task (using the apply function):
set.seed(1) seq.time.ap <- system.time({ seq.medians.ap <- apply(matrix(sample(x, trials*n, replace = T), trials, n), 1, median) }) > quantile(seq.medians.ap, c(.025, .975)) 2.5% 97.5% 52.56284 54.98266 > seq.time.ap user system elapsed 23.732 1.728 25.472 A similar approach can be used to determine the parameters of machine learning algorithms. For example, in the “RSNNS” package there are functions for training the Elman network (as far as I know, in R, in general, there are no other packages for working with recurrent networks). The choice of the number of neurons and the speed of learning is quite a resource-intensive task, therefore there is a sense in parallelization.
Let's move from spherical examples to a more pressing problem. To do this, install two packages:
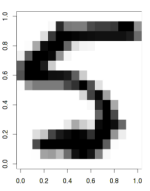
install.packages(c("ElemStatLearn","RSNNS")) From the ElemStatLearn package, we need two data sets, zip.train and zip.test, which contain compressed (gzipped) images of handwritten numbers. The datasets are quite voluminous, so we take only a part of them: respectively, for network training, validation and testing.
Hidden text
library("ElemStatLearn") library(RSNNS) data(zip.train) data(zip.test) image(zip2image(zip.train, 1000), col=gray(255:0/255)) train <- zip.train[1:1000,-1] trainC <- decodeClassLabels(zip.train[1:1000,1]) valid <- zip.train[1001:1200,-1] validC <- zip.train[1001:1200,1] test <- zip.test[1:1000,-1] testC <- zip.test[1:1000,1] Before teaching several networks in parallel, we need to consider what we want to receive. Suppose we are interested in two parameters of the neural network - the number of neurons in the hidden layer and the speed of learning, and we want to choose their more or less optimal values. This means that the work will result in a data frame containing three numbers - the number of neurons, the learning rate and the error, on the basis of which we will determine the optimality of the parameters. Earlier, I mentioned a function that grouped the results of a parallel loop. In the case of data that has a more complex structure than the vector, such a function will have to write itself.
comb <- function(df1, df2) if (df1$err < df2$err) df1 else df2 As can be seen from the code, the function compares the err field of two data frames and selects the one where the error is less. Below is a fragment of the script that provides network training in parallel mode. We start it and for some time we admire 100% loading of three cores.
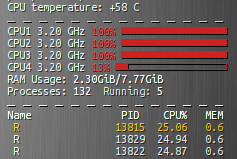
errCl <- function (predicted, true){ return(round(sum(predicted != true)/length(true), 4)) } size <- c(13,29,53,71) lr <- c(.001,.01,.1,.5) nn.time <- system.time({ elm_par <- foreach(s=size, .combine='comb') %:% foreach(r=lr, .packages='RSNNS', .combine='comb', .inorder=F) %dopar% { elm <- elman(x=train, y=trainC, size=s, learnFunc="JE_BP", learnFuncParams=r, linOut=F, maxit=193) pred <- max.col(predict(elm, valid)) - 1 e <- errCl(pred, validC) data.frame(opt_size=s, lrate=r, err=e) } }) The errCl function is used to determine the classification error. The size and lr vectors contain, respectively, the number of neurons in the hidden layer of the network and the speed of network learning. Notice how the nested loop is organized using the
%:% instruction. Actually, if you don’t go into details, the body of the cycle happens what is usually done when choosing parameters: the model is trained in a training data set, then a validating data set is used, a classification error is selected and those parameters are chosen for which the error is smaller. I got the same result: > elm_par opt_size lrate err 1 29 0.5 0.05 > nn.time user system elapsed 0.312 0.168 179.542 Although, of course, do not deceive yourself with an error of 5%. Check our network with 29 neurons and a learning rate of 0.5 on the test set:
elm <- elman(x=train, y=trainC, size=29, learnFunc="JE_BP", learnFuncParams=0.5, linOut=F, maxit=193) pred <- max.col(predict(elm, test)) - 1 e <- errCl(pred, testC) > e [1] 0.119 Well, 11.9% is also quite good. Now it remains for the small - to "pay off" the cluster
stopCluster(cluster) Instead of conclusion
R is a very convenient and cunning language. Getting used to it - and especially to the variety of packages in CRAN - it is difficult to switch to something else. But, of course, each language has its own niche. For R, this is statistics and data analysis. And although R can be quite unhurried, for many tasks its performance is enough.
Literature
High Performance and Parallel Computing with R
Nesting Foreach Loops
RSNNS Package
Source: https://habr.com/ru/post/206892/
All Articles