Usability: Job titles and activities
UPA has published data from the next survey of its members, UPA 2007 Salary Survey.
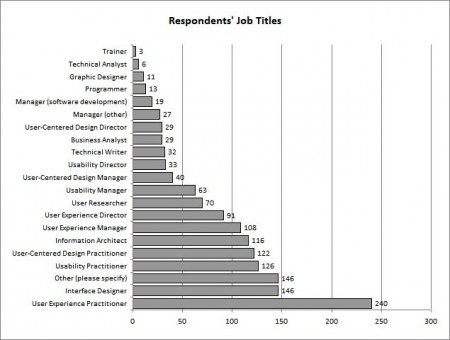
One of the first pages contains a diagram of the distribution of job titles among the respondents.
Among other things, the diagram illustrates the already old thesis that the usability mode is inferior to the user experience mode.
It is interesting to see what colleagues are doing and what changes occurred between 2005 and 2007.
| Technique | 2005 | 2007 | Change |
|---|---|---|---|
| Heuristic or expert review | 76% | 77% | + 1% |
| Usability testing (informal) | 75% | 77% | + 2% |
| User research (eg interviews & surveys) | 73% | 74% | + 1% |
| Interface / interaction design | 70% | 73% | + 3% |
| Creating prototypes (wireframes or low-fidelity) | 66% | 73% | + 7% |
| Requirements gathering | 64% | 63% | -one% |
| Personas & user profiles | 60% | 66% | + 6% |
| Task analysis | 60% | 60% | |
| Information architecture | 55% | 63% | + 8% |
| Usability testing (in a lab) | 53% | 54% | + 1% |
| Card sorting | 46% | 52% | + 6% |
| Surveys or other online research | 44% | 47% | + 3% |
| Focus groups | 37% | 41% | + 4% |
| Remote usability testing | 37% | 42% | + 5% |
| Benchmarking or competitive studies | 37% | 44% | + 7% |
| Contextual inquiry / ethnography | 37% | 46% | + 9% |
| Creating prototypes (high-fidelity) | 36% | 42% | + 6% |
| Satisfaction surveys | 35% | 35% | |
| Visual design | 33% | 35% | + 2% |
| Technical writing | 24% | 23% | -one% |
| Web development | 24% | 23% | -one% |
| Market research | 24% | 24% | |
| Analyze web metrics / logs | 23% | 29% | + 6% |
| Accessibility expert reviews | nineteen% | nineteen% | |
| Accessibility testing | 18% | nineteen% | + 1% |
| Other (please specify) | 6% | 7% | -one% |
| Eye tracking | five% | 13% | + 8% |
')
Source: https://habr.com/ru/post/20641/
All Articles