Per capita e-rubbish - an interactive map shows the reality of each country
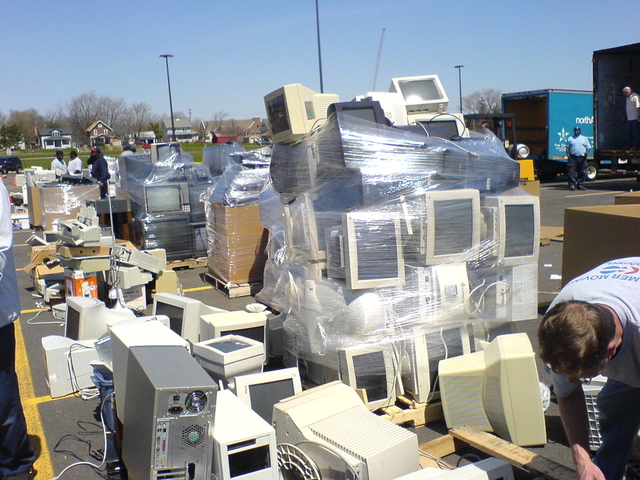
Since the production of computer equipment, mobile devices and other electronics is growing, respectively, the amount of "electronic garbage" is gradually increasing - after all, it is necessary to do something with outdated and malfunctioning equipment. This is where it is thrown away, and, despite all the attempts to organize the processing of this type of waste, the bulk still goes to the scrap without any processing. The other day, the organization StEP Initiative presented an interactive map where you can see how much “e-garbage” is per capita, how much such waste is recycled, and how much new technology is being bought by the population.
In addition, the map shows which standards and rules related to e-waste disposal are in force in a particular region. The map is really very informative, so that many representatives of the habrasoobschestva these data will be interesting, and maybe - useful for work.
')
The organization that submitted the card also published quite significant data on high-tech waste. So, by 2017 this type of garbage is expected to grow by a third, up to 65.4 million tons per year. This includes PCs, TVs, smartphones, electronic toys, and, for some reason, refrigerators.
On the map, you can view information on the amount of e-waste for each continent and country. As mentioned above, it is possible to review the current rules of the regulatory policy regarding waste in a particular region. It is worth noting that not necessarily in the so-called "developed" countries, the situation with the disposal of electronics is good. Rather the opposite.
As for individual countries, the United States, with 9.4 million tons of this type of waste per year, and China, with 7.3 million tons, are at the top of the list of the main "producers" of electronic garbage.
Via theverge
Source: https://habr.com/ru/post/206236/
All Articles