One day from the life of Moscow in geotagging of Vkontakte
Today's social networks provide an almost inexhaustible source of information. This information may be of a different nature, but it is not a secret to anyone that the main part of this information itself is data about users. In addition to the topical issue of anonymity (or more precisely transparency) of the user, insidious special services and marketers, these data may well be used for “peaceful” purposes.
We wondered how with the help of social networks it is possible to assess the attractiveness of the urban environment, find out which places are popular, where citizens are active in the morning, and where in the evening, where they go on weekends and what influences their behavior.
To clarify this issue, we launched a small project on the analysis of geotags ( “ckeck-in” -y ), published in Moscow. Data is collected in the last 24 hours and displayed in visual form on a map in real time. Who cares what we got from this venture - welcome under cat.
Why precisely VK? His choice, of course, was not accidental - today it is the most popular Russian social network, and as much data as there is nowhere else. VKontakte has about 36 million daily visitors living in Russia. Of these, about 9 million are in the capital. And this means that at least half of Muscovites visit their page every day. The best site for analysis, perhaps, can not be found.
')
So, problems with finding an audience for analysis has been resolved. There were only a couple of questions:
Together with technical support from VC, the first question was answered in the affirmative (bingo! But more on that below). And what about the second? Will not our map consist entirely of uninteresting data collected from home or work stationary PCs? Let us turn to statistics again: according to LiveInternet, at least 20-25% of visits fall on Android and iOS, and Opera Mini, although losing its position, still holds the place of the 4th most popular browser. The mobile boom has not bypassed the audience in VKontakte, and an ever-increasing part of its visitors are portable gadgets. It is worth considering the fact that “chekins” are usually still made not in the living room and in the kitchen, but in various public places, during leisure time. This means that the information that we receive, quite allow to judge about the citywide tendency of activity.
And now let's move on to the most interesting - to the technical part! It cannot be said that some revolutionary technologies were used, but perhaps some of the techniques presented below will be curious to the habr-public.
A brief analysis of the API documentation VC allowed us to detect the places.getCheckins method, which returns all posts with geotags near the original search point. Great? Of course! But the number of requests to the API is limited to 5 per second, and this is not our scale, at some point we will definitely rest on this limit. The execute method came to the rescue (thanks to VC technical support for the operational advice), which allowed to fit 20 hits into one single one; the main thing is to keep within the limited execution time of the subqueries embedded in the execute. Another bonus of this approach was the ability to transfer part of information processing to VC servers.
So, now everything was ready to directly apply for the necessary data in the VC. It would seem that the matter is small - we need to transfer the coordinates of the center of the capital to the places.getCheckins method and voila! But it was not there. With this approach, the objects returned by the API, clustered in the upper right corner, but the left side of the city was empty. We had to resort to a small trick: we broke the map of Moscow into areas (picture below), and began to interview several smaller areas instead of one large:
Now things have gone much better, but the API does not always return the coordinates we need. As far as it was possible to find out, this happened in the event that the VC could not recognize the place on its base. Here, the only way to pull out the latitude and longitude was a direct appeal to them on the user's wall using the wall.getById method. Considering that places.getCheckins sends ' wall_id ' to the ' id ' field, it was easy to turn off such an operation.
For continuous data collection, a small daemon was written that regularly performs a request for a new batch of geo-tags by constantly calling the execute method with the following contents:
A demon (written in Python ) polls the VC server about once every 3 seconds. Thanks to the ' timestamp ' parameter, you can easily get only new data without worrying about filtering old ones.
The result, which was obtained from the VC, understands - the coordinates and time are recorded in a binary file and in MongoDB . Initially, it was planned to use Mongo to create clusters, but later it was decided to abandon this idea, so now the binary file carries out a kind of backup data.
As soon as the daemon processes the new chekin, the http coordinates on the localhost host send the coordinates of the points to the second daemon, which keeps the websoket connection. After receiving the coordinates of the second demon, he immediately sends them to the user in the browser (and yes, the browser opens websocket and waits for an answer).
Well, in order to give a little dynamics to all of this, we decided to fasten a beautiful animation to each geo-tag that appears on the map:

As a cartographic basis, standard Google Maps was used with a little customization: color inversion + gamma and brightness adjustment to create an optimal contrast with labels.
The client part is written in PHP , which takes data from MongoDB in the last 24 hours.
So, all the preparations were completed and we started safely on a separate machine. The question that was postponed to the last became more relevant than ever: how many Chekini are committed per day in Moscow? Are they enough to fill the card? Fortunately, all concerns about this were quickly dispelled - in the very first day our server pulled out and processed about 10,000 publications with geo-tags! Day # 2 only confirmed that this figure was not an error or an occasional surge of activity.
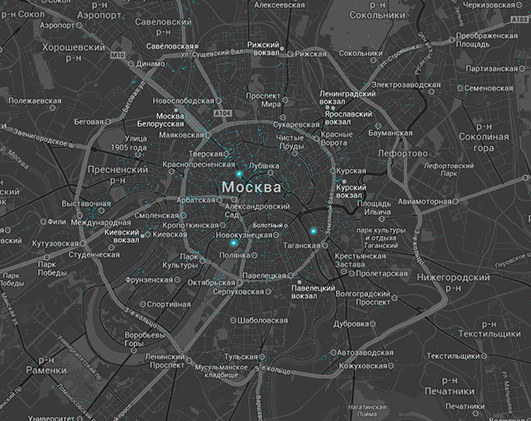
From interesting observations: it turns out that the creative cluster on the site of the former factory of “Red October” really became an important cultural center of Moscow and today is no less popular than Red Square.
The most favorite street of Muscovites is Arbat, and in 2012, the metropolitan authorities opened the pedestrian zone from Stoleshnikov Lane to Kuznetsky Most in one year became one of the most popular in the capital!
Such studies of urban space can be carried out for any place or event in the city. So, this weekend, together with the festival “The Best City of Winter ”, we monitored the activity during the launch of light installations. It was terribly exciting to see how every 10-30 seconds flashed a new label. The installations clearly left no one indifferent.

Feel the whole thing alive here - whatsupmoscow.ru
All project source code is available on GitHub.
We wondered how with the help of social networks it is possible to assess the attractiveness of the urban environment, find out which places are popular, where citizens are active in the morning, and where in the evening, where they go on weekends and what influences their behavior.
To clarify this issue, we launched a small project on the analysis of geotags ( “ckeck-in” -y ), published in Moscow. Data is collected in the last 24 hours and displayed in visual form on a map in real time. Who cares what we got from this venture - welcome under cat.
Why precisely VK? His choice, of course, was not accidental - today it is the most popular Russian social network, and as much data as there is nowhere else. VKontakte has about 36 million daily visitors living in Russia. Of these, about 9 million are in the capital. And this means that at least half of Muscovites visit their page every day. The best site for analysis, perhaps, can not be found.
')
So, problems with finding an audience for analysis has been resolved. There were only a couple of questions:
- And from a technical point of view, will we be able to collect from VKontakte the data we need for geo-tags? In other words, does the public API VKontakte allow to “get” information on the users' checks? And not just to get it, but to get it regularly, in real time and for ALL of Moscow.
- How much will these data fit into the idea of our experiment?
Together with technical support from VC, the first question was answered in the affirmative (bingo! But more on that below). And what about the second? Will not our map consist entirely of uninteresting data collected from home or work stationary PCs? Let us turn to statistics again: according to LiveInternet, at least 20-25% of visits fall on Android and iOS, and Opera Mini, although losing its position, still holds the place of the 4th most popular browser. The mobile boom has not bypassed the audience in VKontakte, and an ever-increasing part of its visitors are portable gadgets. It is worth considering the fact that “chekins” are usually still made not in the living room and in the kitchen, but in various public places, during leisure time. This means that the information that we receive, quite allow to judge about the citywide tendency of activity.
Implementation
And now let's move on to the most interesting - to the technical part! It cannot be said that some revolutionary technologies were used, but perhaps some of the techniques presented below will be curious to the habr-public.
A brief analysis of the API documentation VC allowed us to detect the places.getCheckins method, which returns all posts with geotags near the original search point. Great? Of course! But the number of requests to the API is limited to 5 per second, and this is not our scale, at some point we will definitely rest on this limit. The execute method came to the rescue (thanks to VC technical support for the operational advice), which allowed to fit 20 hits into one single one; the main thing is to keep within the limited execution time of the subqueries embedded in the execute. Another bonus of this approach was the ability to transfer part of information processing to VC servers.
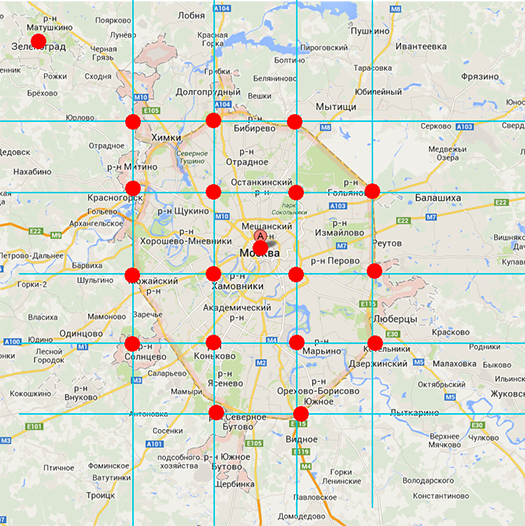
So, now everything was ready to directly apply for the necessary data in the VC. It would seem that the matter is small - we need to transfer the coordinates of the center of the capital to the places.getCheckins method and voila! But it was not there. With this approach, the objects returned by the API, clustered in the upper right corner, but the left side of the city was empty. We had to resort to a small trick: we broke the map of Moscow into areas (picture below), and began to interview several smaller areas instead of one large:
Now things have gone much better, but the API does not always return the coordinates we need. As far as it was possible to find out, this happened in the event that the VC could not recognize the place on its base. Here, the only way to pull out the latitude and longitude was a direct appeal to them on the user's wall using the wall.getById method. Considering that places.getCheckins sends ' wall_id ' to the ' id ' field, it was easy to turn off such an operation.
For continuous data collection, a small daemon was written that regularly performs a request for a new batch of geo-tags by constantly calling the execute method with the following contents:
Some code
var COUNT_CHEKING = 18; var LAST_TIME = %time_replace%; var max_time = 0; var cordinatesPonint = [ [55.91843, 37.379394], [55.908424, 37.541442], [55.895336, 37.682891], [55.822116, 37.821593], [55.742574, 37.839446], [55.658996, 37.836699], [55.579897, 37.687011], [55.583002, 37.551055], [55.646599, 37.387633], [55.72943, 37.38214], [55.829059, 37.399993], [55.827516, 37.541442], [55.816715, 37.680144], [55.730977, 37.680144], [55.66132, 37.677398], [55.66132, 37.537322], [55.740255, 37.535949], [55.754071, 37.617504], [55.989164, 37.184386], [55.519302, 37.520843], ]; var placesMoscow = []; var iCordinatesPonint = 0; while(iCordinatesPonint < cordinatesPonint.length) { placesMoscow = placesMoscow + [API.places.getCheckins({ "latitude":cordinatesPonint[iCordinatesPonint][0], "longitude":cordinatesPonint[iCordinatesPonint][1], "count":COUNT_CHEKING, "timestamp": LAST_TIME })]; iCordinatesPonint = iCordinatesPonint + 1; } var walls; var iMoscow = 0; var returnObj = []; var wallsIds = []; var returnObj2 = []; var i; while(iMoscow < placesMoscow.length) { var getWallId = placesMoscow[iMoscow]@.latitude; var i = 1; while(i < getWallId.length) { if(getWallId[i] == 0) { wallsIds = wallsIds + [placesMoscow[iMoscow][i].id]; } else { if(max_time < placesMoscow[iMoscow][i].date) { max_time = placesMoscow[iMoscow][i].date; } returnObj = returnObj + [{ "lat": placesMoscow[iMoscow][i].latitude, "lng": placesMoscow[iMoscow][i].longitude, "id": placesMoscow[iMoscow][i].id, "time": placesMoscow[iMoscow][i].date }]; } i = i + 1; } iMoscow = iMoscow + 1; } if(wallsIds.length > 0) { walls = API.wall.getById({"posts": wallsIds}); i = 0; while(i < walls.length) { if(max_time < walls[i].date) { max_time = walls[i].date; } returnObj2 = returnObj2 + [{ "coordinates": walls[i].geo.coordinates, "time": walls[i].date, "id": wallsIds[i] }]; i = i + 1; } } var moscow = { "checkins": returnObj, "wals": returnObj2 }; return { "max_time" : max_time, "spb": { "checkins": [], "wals": [] }, "moscow" : moscow}; A demon (written in Python ) polls the VC server about once every 3 seconds. Thanks to the ' timestamp ' parameter, you can easily get only new data without worrying about filtering old ones.
The result, which was obtained from the VC, understands - the coordinates and time are recorded in a binary file and in MongoDB . Initially, it was planned to use Mongo to create clusters, but later it was decided to abandon this idea, so now the binary file carries out a kind of backup data.
As soon as the daemon processes the new chekin, the http coordinates on the localhost host send the coordinates of the points to the second daemon, which keeps the websoket connection. After receiving the coordinates of the second demon, he immediately sends them to the user in the browser (and yes, the browser opens websocket and waits for an answer).
Well, in order to give a little dynamics to all of this, we decided to fasten a beautiful animation to each geo-tag that appears on the map:
As a cartographic basis, standard Google Maps was used with a little customization: color inversion + gamma and brightness adjustment to create an optimal contrast with labels.
The client part is written in PHP , which takes data from MongoDB in the last 24 hours.
Start given
So, all the preparations were completed and we started safely on a separate machine. The question that was postponed to the last became more relevant than ever: how many Chekini are committed per day in Moscow? Are they enough to fill the card? Fortunately, all concerns about this were quickly dispelled - in the very first day our server pulled out and processed about 10,000 publications with geo-tags! Day # 2 only confirmed that this figure was not an error or an occasional surge of activity.
First results
From interesting observations: it turns out that the creative cluster on the site of the former factory of “Red October” really became an important cultural center of Moscow and today is no less popular than Red Square.
The most favorite street of Muscovites is Arbat, and in 2012, the metropolitan authorities opened the pedestrian zone from Stoleshnikov Lane to Kuznetsky Most in one year became one of the most popular in the capital!
Such studies of urban space can be carried out for any place or event in the city. So, this weekend, together with the festival “The Best City of Winter ”, we monitored the activity during the launch of light installations. It was terribly exciting to see how every 10-30 seconds flashed a new label. The installations clearly left no one indifferent.
Feel the whole thing alive here - whatsupmoscow.ru
All project source code is available on GitHub.
Source: https://habr.com/ru/post/206206/
All Articles