Detailed monitoring of Apache requests using Python and Munin
One of the tasks during my recent internship at TomTome was to improve the company's web server monitoring tools. More specifically, it was necessary to write several plug-ins to Munin , which would output detailed statistics of requests to our API from Apache access logs. This task may initially seem primitive - it’s just that you need to parse the log file and output the results in the Munin-understood format. However, to create a truly reliable and convenient utility with flexible settings, I had to tinker a lot. So that this work is not in vain, I posted a code on Github called elfstats . In this article I will talk about what tasks this utility is capable of solving, so that interested network engineers can apply it in their environments.
In short, before working with elfstats, you need to describe the requests processed by the web server using regular expressions. After that, the program will regularly parse access logs and generate a report file containing the number of requests and the distribution of response time for each of the described templates. Further, this report will be processed with the help of Munin and displayed in the form of the corresponding graphs. Thus, by installing and configuring elfstats, you can easily track changes in the performance of your applications and user behavior at the web server level.
Now there are a huge number of different means of monitoring web servers. However, after analyzing the most popular of them, I did not find utilities that would allow tracking detailed data on requests in (near) real time, displayed all the information in one place and easily integrated into the monitoring infrastructure that already existed in the company. Before I started working on my solution, we used outdated and essentially unsupported two-part scripts — the data aggregator and Munin plug-ins — to analyze API requests. There were several serious problems with them: the impossibility of a more or less flexible configuration without changing the source codes, insufficient functionality and trivial bugs. I think we were not the only place where the task of parsing and displaying information from the logs was solved with scripts written on my knee.
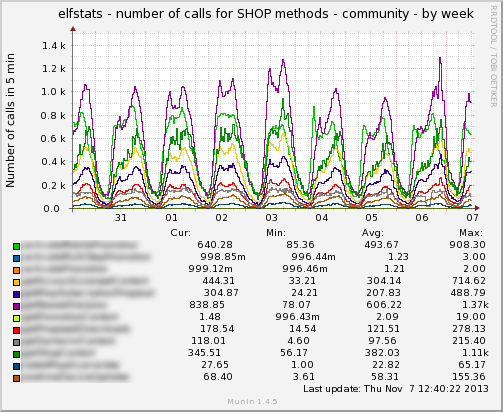
Output of the number of requests to the API group described by a single expression
')
For the basis of the new solution, I also took a two-component approach. To collect statistics from the logs, a daemon was written that runs at regular intervals and analyzes the data generated since the previous launch. The collected information is recorded in a report file, which can then be used by plug-ins to Munin or to other means of visual real-time monitoring. Since all data processing tasks are assigned to the daemon, the plugins are very simple and work out very quickly, which is very critical for our central server Munin, which slowly and sadly collects statistics from several dozen nodes. In addition, since plug-ins practically do not contain any logic, apart from parsing a short report file and returning values to munin-node, they can easily be rewritten for other monitoring utilities. The demon does not have to touch.
The current version of the program supports the following functionality.
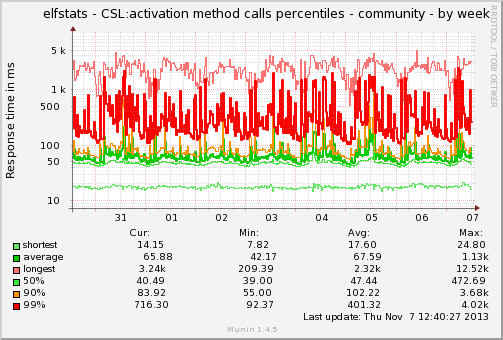
The response time distribution for one of the API calls
With the help of elfstats you can monitor the following data.
Six different Munin plugins based on the PyMunin framework are used to display this data. Plugins are distributed separately from the daemon, they are independent of each other and can be turned on and off as needed.

Return Code Monitoring
The code for the daemon and plugins is written in Python 2.6, and version 3.x is possible in the future. The binary build is available as rpm packages compiled on Linux RedHat 6. To work with other operating systems, you need to build a daemon and plugins from the source codes. To simplify the installation of elfstats on machines with RHEL6, RPM is supported with a pre-installed virtual python environment that includes all necessary dependencies. The source code of the daemon is open under the MIT license, the plugins are distributed under GPLv3, as required by the PyMunin framework. For the initial deployment and updating of elfstats on servers, Puppet manifests are used. They also modify the configuration files for the necessary tasks, different for all servers. There are no manifestos in the repositories yet, they will be added a little later.
It seems to me that the program I wrote was quite functional and flexible. For several months, it has been used to monitor a fairly large number of servers and works without complaints. I will be glad if you want to use elfstats to control your servers and will be happy to answer questions about the work of this utility in the comments and tracker.
In short, before working with elfstats, you need to describe the requests processed by the web server using regular expressions. After that, the program will regularly parse access logs and generate a report file containing the number of requests and the distribution of response time for each of the described templates. Further, this report will be processed with the help of Munin and displayed in the form of the corresponding graphs. Thus, by installing and configuring elfstats, you can easily track changes in the performance of your applications and user behavior at the web server level.
Now there are a huge number of different means of monitoring web servers. However, after analyzing the most popular of them, I did not find utilities that would allow tracking detailed data on requests in (near) real time, displayed all the information in one place and easily integrated into the monitoring infrastructure that already existed in the company. Before I started working on my solution, we used outdated and essentially unsupported two-part scripts — the data aggregator and Munin plug-ins — to analyze API requests. There were several serious problems with them: the impossibility of a more or less flexible configuration without changing the source codes, insufficient functionality and trivial bugs. I think we were not the only place where the task of parsing and displaying information from the logs was solved with scripts written on my knee.
Output of the number of requests to the API group described by a single expression
')
For the basis of the new solution, I also took a two-component approach. To collect statistics from the logs, a daemon was written that runs at regular intervals and analyzes the data generated since the previous launch. The collected information is recorded in a report file, which can then be used by plug-ins to Munin or to other means of visual real-time monitoring. Since all data processing tasks are assigned to the daemon, the plugins are very simple and work out very quickly, which is very critical for our central server Munin, which slowly and sadly collects statistics from several dozen nodes. In addition, since plug-ins practically do not contain any logic, apart from parsing a short report file and returning values to munin-node, they can easily be rewritten for other monitoring utilities. The demon does not have to touch.
The current version of the program supports the following functionality.
- Parsing the Apache log format. Regardless of how you set up the server, the daemon will correctly parse the format of the generated logs. To do this, just copy the Apache configuration string to the daemon settings file.
- Work with several different log files on one machine from one process.
- Reading and parsing the previous file with support for various rotation options (rotation in place or creating a new file with a temporary template in the name).
- Flexible customization of parsed and ignored queries using regular expressions.
- Support for log files with records shifted relative to the time on the target machine.
- Grouping similar requests into groups to simplify configuration and control of the system.
The response time distribution for one of the API calls
With the help of elfstats you can monitor the following data.
- The total number of requests in the log.
- The number of requests for each described group (and separately the number of slow requests).
- The distribution of response time for each group - minimum, maximum, average, arbitrary percentiles.
- Distribution of return codes - in general for the server and separately for each group of requests.
- The number of (different) matches for the given patterns.
- The number of parsed, missing, and erroneous records for monitoring a daemon and debugging a configuration.
Six different Munin plugins based on the PyMunin framework are used to display this data. Plugins are distributed separately from the daemon, they are independent of each other and can be turned on and off as needed.
Return Code Monitoring
The code for the daemon and plugins is written in Python 2.6, and version 3.x is possible in the future. The binary build is available as rpm packages compiled on Linux RedHat 6. To work with other operating systems, you need to build a daemon and plugins from the source codes. To simplify the installation of elfstats on machines with RHEL6, RPM is supported with a pre-installed virtual python environment that includes all necessary dependencies. The source code of the daemon is open under the MIT license, the plugins are distributed under GPLv3, as required by the PyMunin framework. For the initial deployment and updating of elfstats on servers, Puppet manifests are used. They also modify the configuration files for the necessary tasks, different for all servers. There are no manifestos in the repositories yet, they will be added a little later.
It seems to me that the program I wrote was quite functional and flexible. For several months, it has been used to monitor a fairly large number of servers and works without complaints. I will be glad if you want to use elfstats to control your servers and will be happy to answer questions about the work of this utility in the comments and tracker.
Source: https://habr.com/ru/post/206008/
All Articles