Profiling and debugging Python, debugging
In the previous article, we ended up talking about profiling an overview of event profilers.
Today I propose to consider the methods of debugging programs.
')
Before we start talking about debugging, we need to decide what it is. By tradition, we turn to Wikipedia : "Debugging - the detection, localization and elimination of errors." Generally, for successful debugging of the program, we need (but not always enough) two things: the value of variables in the place of the program where the error occurred, as well as the setrays: the order of function calls, up to the erroneous one. It is also useful to know about the environment in which the program runs: the presence (or absence) of free memory, system limitations (for example, on the number of file descriptors), and so on, but this is slightly beyond the scope of our article.
What does a novice programmer do when he wants to “get inside” a program and examine the contents of variables (in the right places) and the logic of the program (function calls, conditional fulfillment)? He resorts to the most common, simplest and most "effective" debugging method: he puts "prints" all over his code (the print statement in Python 2.x and the print () function in Python 3.x). But not only beginners sin with this: advanced developers are often too lazy to use special tools for debugging, hoping quickly, in a couple of minutes, to find the cause of the error and fix everything, and without noticing that the search for errors stretches for hours and even days. By the way, this approach is called “journaling”.
This also includes writing all the necessary information for debugging the program to a log file. Sometimes there are no other options, for example, when the script works in production and errors occur sporadically, or when an error only appears after a long program run (say, two or three weeks after launch).
But we write in Python, so why not use the built-in debugging tools or tools offered by the community? For example, instead of the usual logging to a file, it makes sense to use Sentry , so that in addition to the error message, you can send additional information: a template with all local variables, any other variables, and generally everything that you see fit.
Python has a built-in debugger: a pdb module. In principle, this could be the end of the article, because pdb is an extremely powerful debugger and everything else is, in fact, just “decorations” to it. But we will continue =)
As you can see from the title, pdb took a lot from gdb (GNU Project debugger) - the C debugger (and not only) programs. By the way, Python programs can be debugged using gdb, it's just a little more complicated and longer, although those who want to delve into the language structure, as well as those who write sishnye modules for python, cannot do without gdb. In addition, gdb allows you to connect to an already running program (through its pid) and debug it “on the spot”.
I’m not going to describe pdb in detail right now, here’s a great article by Doug Hellmann: pdb - Interactive Debugger on a very useful Python Module of the Week resource, but its good translation to Habré: pdb - An interactive debugger made by user xa4a .
I suggest to immediately put IPython and the ipdb module for it:
IPython (and ipdb, as its part) offers a “better” console and, as a result, more convenient debugging of programs: code highlighting, autocompletion, command history, dynamic introspection of any objects, magic functions, aliases and much more. A complete list of improvements can be viewed in the documentation or directly from the IPython console by typing "?" as a team. All this helps with debugging and makes it simple and fun.
There are several ways to start script debugging in ipdb:
These commands will open the program in the debugger, then you can do whatever you want: set breakpoints, study its work step by step, or just start the program - the debugger will automatically stop when an uncaught exception occurs.
But usually this option is too exhausting: until you get to the right place with all these "next", "step", and it is tiresome to put a break point ("break") with your hands. It is much more convenient to insert the following line in the right place of the program:
And then at the execution of this line, the program will pause and the debugger will be launched, - then you can begin to delve into the study of the program. In essence, the “set_trace” function is a breakpoint setting.
Python Debugger has another mode of operation, which in some cases is more convenient than the set_trace function. It is called “post mortem”: start the debugger with a given traceback:
or so:
In case of any non-catchable exceptions in the "some_code" function, the debugger will be called at the place of the program where the exception occurred.
An interesting replacement for the “set_trace” function is the debug module, which simply imports the ipdb and see libraries (a convenient alternative to the dir function) and starts debugging. The only advantage of the module is its usability; it’s enough to insert a line anywhere in the program:
And when executing this line, the “ipdb” debugger will be invoked and the “see” module will be imported.
Another interesting and, this time, useful library: nose-ipdb . With its help, you can automatically start the debugger in case of errors (exceptions) or simply with incorrectly tested tests (I hope you use nose? =). To start the ipdb debugger in case of errors, it is enough to add the "--ipdb" key when running the tests:
And to start the debugger with incorrectly completed tests, you need to add the key "--ipdb-failures":
Of course, you can catch everything at once:
I use this module every day and I just can’t imagine life without it.
Armin Ronacher’s stunning project ( Armin Ronacher ), author of the Flask framework and one of the coolest Python programmers in general, is called werkzeug and is a collection of various utilities for WSGI applications. One of them is a cool debugger that allows you to display a convenient traceback of errors, as well as run the Python console in the appropriate location of the traceback directly on the browser page:
It is very simple to use it, it is enough to wrap the application using the appropriate middleware:
They say that werkzeug can even debug Ajax requests, but, unfortunately, I myself have never done this. I would welcome any comments on this topic.
Another good module, this time for Django: django-pdb . It allows you to run the debugger if there is a corresponding GET parameter in the request (for example: http://127.0.0.1:8000/app/view?ipdb ) or for all requests:
Or, call the debugger when exceptions occur (post-mortem mode):
or
in settings.py.
But it is much better to use the django-extensions module in Django, which adds a very useful runserver_plus command. With this battery, you can make friends with Django and Werkzeug (see above) and start enjoying the pages with a five hundredth error =)
To use this miracle, it is enough to launch the developer server using the runserver_plus command:
Debugging the program in the development environment is, of course, convenient and good, but the most difficult thing is to locate the problem by a bug report from a live user. Sometimes it is difficult. Despite all the advantages of Python , the telepathy module does not exist, and the developer is left alone with the words of the user “nothing works !!! 11”.
The Sentry project allows you to save each user error with the text of the exception, the complete exception frame and the values of all local variables in each of the function functions, as well as a lot of other information: the user's environment (browser, OS), all request headers and everything the developer wishes .
Identical errors are grouped together, so you can monitor the “pulse” of the project and repair first of all the most critical places. Another example of using sentry is logging. You can simply add to the controversial place an entry in the log message with any variables of interest to the developer, and all this will be in sentry.
But the biggest plus is that all this can (and should) be used in production.
Another interesting debugger: PuDB is a console debugger with a graphical interface:
I will not write much about it (to be honest, I didn’t use it myself), I suggest reading a short note on Habré: Convenient debugger for Python / Django projects from user int22h or a more complete overview: Debugging Python / Django with PuDB .
Standalone Python debugger, this time with a full-fledged graphical user interface: Winpdb :
Its developers claim that winpdb is 20 times faster than pdb, and also supports work with threads. A very large and detailed tutorial can be found on this page: code.google.com/p/winpdb/wiki/DebuggingTutorial .
Separate words deserve universal "combines" of programming: IDE, which allow you to run code, profile it, or run the built-in debugger without leaving the editor. I, perhaps, will select several products intended for development on Python: PyCharm , PyDev , Wing IDE and PTVS .

To be honest, I do not see much point in considering each of these IDEs, it’s enough to know that they are there, that they successfully cope with their tasks and you can use the built-in debugger directly from the editor - this is really convenient, cool and cool.
Thanks to everyone who read and commented.
Vladimir Rudnykh,
Technical Director of the Mail.Ru Calendar.
Today I propose to consider the methods of debugging programs.
- Introduction and theory - why do you need profiling, different approaches, tools and differences between them?
- Manual and statistical profiling - go to practice
- Event Profiling - tools and their use
- Debugging - what to do when nothing works
')
Before we start talking about debugging, we need to decide what it is. By tradition, we turn to Wikipedia : "Debugging - the detection, localization and elimination of errors." Generally, for successful debugging of the program, we need (but not always enough) two things: the value of variables in the place of the program where the error occurred, as well as the setrays: the order of function calls, up to the erroneous one. It is also useful to know about the environment in which the program runs: the presence (or absence) of free memory, system limitations (for example, on the number of file descriptors), and so on, but this is slightly beyond the scope of our article.
Classics of the genre
What does a novice programmer do when he wants to “get inside” a program and examine the contents of variables (in the right places) and the logic of the program (function calls, conditional fulfillment)? He resorts to the most common, simplest and most "effective" debugging method: he puts "prints" all over his code (the print statement in Python 2.x and the print () function in Python 3.x). But not only beginners sin with this: advanced developers are often too lazy to use special tools for debugging, hoping quickly, in a couple of minutes, to find the cause of the error and fix everything, and without noticing that the search for errors stretches for hours and even days. By the way, this approach is called “journaling”.
This also includes writing all the necessary information for debugging the program to a log file. Sometimes there are no other options, for example, when the script works in production and errors occur sporadically, or when an error only appears after a long program run (say, two or three weeks after launch).
But we write in Python, so why not use the built-in debugging tools or tools offered by the community? For example, instead of the usual logging to a file, it makes sense to use Sentry , so that in addition to the error message, you can send additional information: a template with all local variables, any other variables, and generally everything that you see fit.
The python debugger
Python has a built-in debugger: a pdb module. In principle, this could be the end of the article, because pdb is an extremely powerful debugger and everything else is, in fact, just “decorations” to it. But we will continue =)
As you can see from the title, pdb took a lot from gdb (GNU Project debugger) - the C debugger (and not only) programs. By the way, Python programs can be debugged using gdb, it's just a little more complicated and longer, although those who want to delve into the language structure, as well as those who write sishnye modules for python, cannot do without gdb. In addition, gdb allows you to connect to an already running program (through its pid) and debug it “on the spot”.
I’m not going to describe pdb in detail right now, here’s a great article by Doug Hellmann: pdb - Interactive Debugger on a very useful Python Module of the Week resource, but its good translation to Habré: pdb - An interactive debugger made by user xa4a .
Ipython pdb
I suggest to immediately put IPython and the ipdb module for it:
➜ pip install ipython ipdb IPython (and ipdb, as its part) offers a “better” console and, as a result, more convenient debugging of programs: code highlighting, autocompletion, command history, dynamic introspection of any objects, magic functions, aliases and much more. A complete list of improvements can be viewed in the documentation or directly from the IPython console by typing "?" as a team. All this helps with debugging and makes it simple and fun.
There are several ways to start script debugging in ipdb:
➜ python -m ipdb script.py ➜ ipdb script.py These commands will open the program in the debugger, then you can do whatever you want: set breakpoints, study its work step by step, or just start the program - the debugger will automatically stop when an uncaught exception occurs.
But usually this option is too exhausting: until you get to the right place with all these "next", "step", and it is tiresome to put a break point ("break") with your hands. It is much more convenient to insert the following line in the right place of the program:
import ipdb; ipdb.set_trace() And then at the execution of this line, the program will pause and the debugger will be launched, - then you can begin to delve into the study of the program. In essence, the “set_trace” function is a breakpoint setting.
Note for aesthetes
Anyone who is familiar with the abbreviation PEP8, in this place can accuse me of using two commands on the same line through a semicolon, but this approach is completely entitled to life. First of all, this is a temporary code that will never be commited to the repository (a special hook will take care of this, which checks the code for compliance with PEP8 before committing and pushing, as well as auto-checking the code in a text editor). Secondly, it's easier to insert and delete this line in the code. And thirdly, as written in PEP8: “A Foolish Consistency is the Hobgoblin of Little Minds”.
Python Debugger has another mode of operation, which in some cases is more convenient than the set_trace function. It is called “post mortem”: start the debugger with a given traceback:
try: some_code() except: import sys import ipdb tb = sys.exc_info()[2] ipdb.post_mortem(tb) or so:
import sys import ipdb def run_debugger(type, value, tb): ipdb.pm() sys.excepthook = run_debugger some_code() In case of any non-catchable exceptions in the "some_code" function, the debugger will be called at the place of the program where the exception occurred.
debug
An interesting replacement for the “set_trace” function is the debug module, which simply imports the ipdb and see libraries (a convenient alternative to the dir function) and starts debugging. The only advantage of the module is its usability; it’s enough to insert a line anywhere in the program:
import debug And when executing this line, the “ipdb” debugger will be invoked and the “see” module will be imported.
ipdbplugin
Another interesting and, this time, useful library: nose-ipdb . With its help, you can automatically start the debugger in case of errors (exceptions) or simply with incorrectly tested tests (I hope you use nose? =). To start the ipdb debugger in case of errors, it is enough to add the "--ipdb" key when running the tests:
➜ nosetests --ipdb And to start the debugger with incorrectly completed tests, you need to add the key "--ipdb-failures":
➜ nosetests --ipdb-failures Of course, you can catch everything at once:
➜ nosetests --ipdb --ipdb-failures I use this module every day and I just can’t imagine life without it.
werkzeug
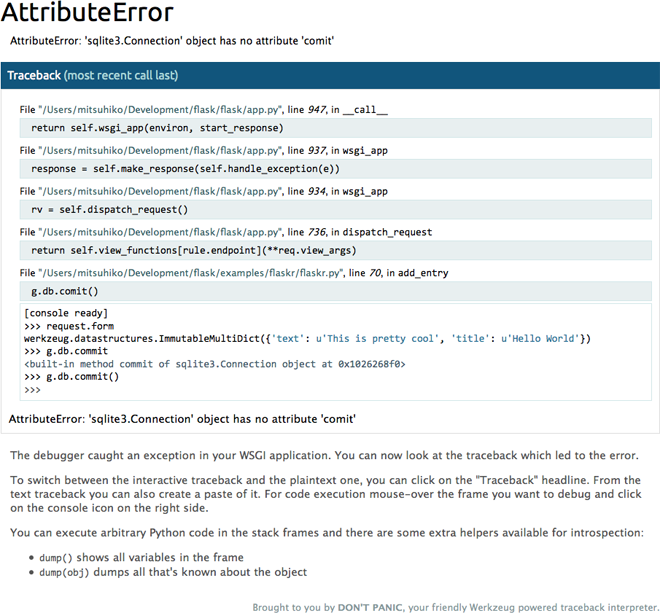
Armin Ronacher’s stunning project ( Armin Ronacher ), author of the Flask framework and one of the coolest Python programmers in general, is called werkzeug and is a collection of various utilities for WSGI applications. One of them is a cool debugger that allows you to display a convenient traceback of errors, as well as run the Python console in the appropriate location of the traceback directly on the browser page:
It is very simple to use it, it is enough to wrap the application using the appropriate middleware:
from werkzeug.debug import DebuggedApplication from myapp import app app = DebuggedApplication(app, evalex=True) They say that werkzeug can even debug Ajax requests, but, unfortunately, I myself have never done this. I would welcome any comments on this topic.
django-pdb
Another good module, this time for Django: django-pdb . It allows you to run the debugger if there is a corresponding GET parameter in the request (for example: http://127.0.0.1:8000/app/view?ipdb ) or for all requests:
➜ python manage.py runserver --ipdb Or, call the debugger when exceptions occur (post-mortem mode):
➜ python manage.py runserver --pm or
POST_MORTEM = True in settings.py.
django-extensions
But it is much better to use the django-extensions module in Django, which adds a very useful runserver_plus command. With this battery, you can make friends with Django and Werkzeug (see above) and start enjoying the pages with a five hundredth error =)
To use this miracle, it is enough to launch the developer server using the runserver_plus command:
➜ python manage.py runserver_plus sentry
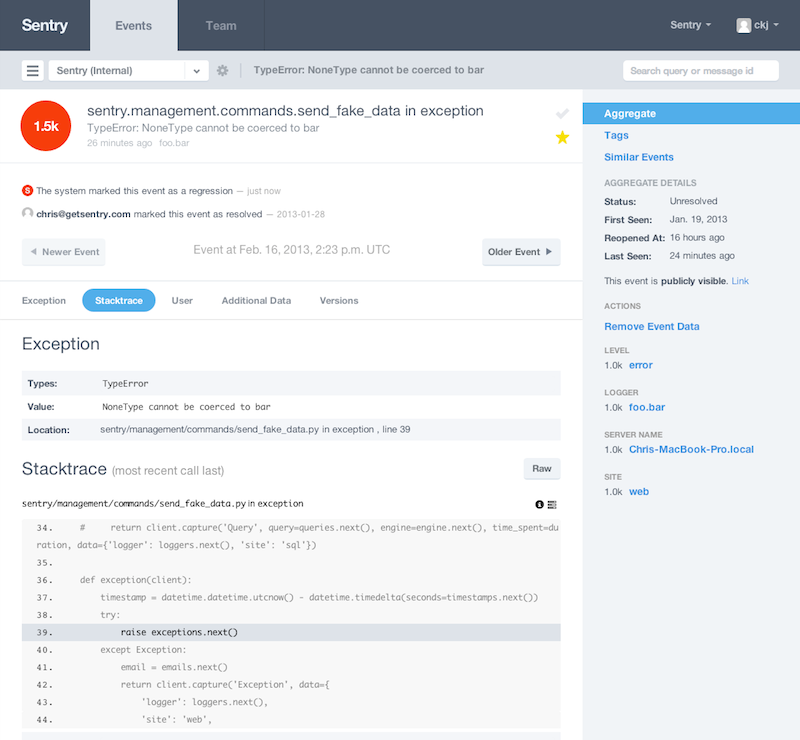
Debugging the program in the development environment is, of course, convenient and good, but the most difficult thing is to locate the problem by a bug report from a live user. Sometimes it is difficult. Despite all the advantages of Python , the telepathy module does not exist, and the developer is left alone with the words of the user “nothing works !!! 11”.
The Sentry project allows you to save each user error with the text of the exception, the complete exception frame and the values of all local variables in each of the function functions, as well as a lot of other information: the user's environment (browser, OS), all request headers and everything the developer wishes .
Identical errors are grouped together, so you can monitor the “pulse” of the project and repair first of all the most critical places. Another example of using sentry is logging. You can simply add to the controversial place an entry in the log message with any variables of interest to the developer, and all this will be in sentry.
But the biggest plus is that all this can (and should) be used in production.
Pudb
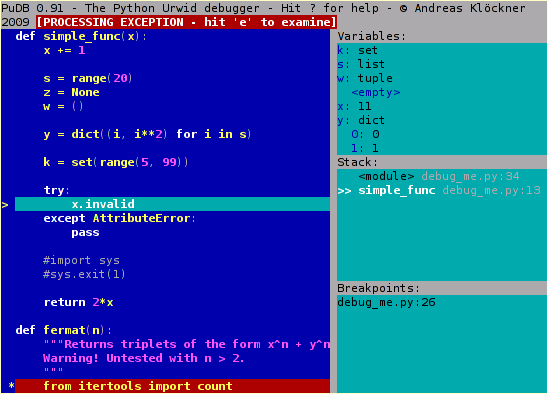
Another interesting debugger: PuDB is a console debugger with a graphical interface:
I will not write much about it (to be honest, I didn’t use it myself), I suggest reading a short note on Habré: Convenient debugger for Python / Django projects from user int22h or a more complete overview: Debugging Python / Django with PuDB .
Winpdb
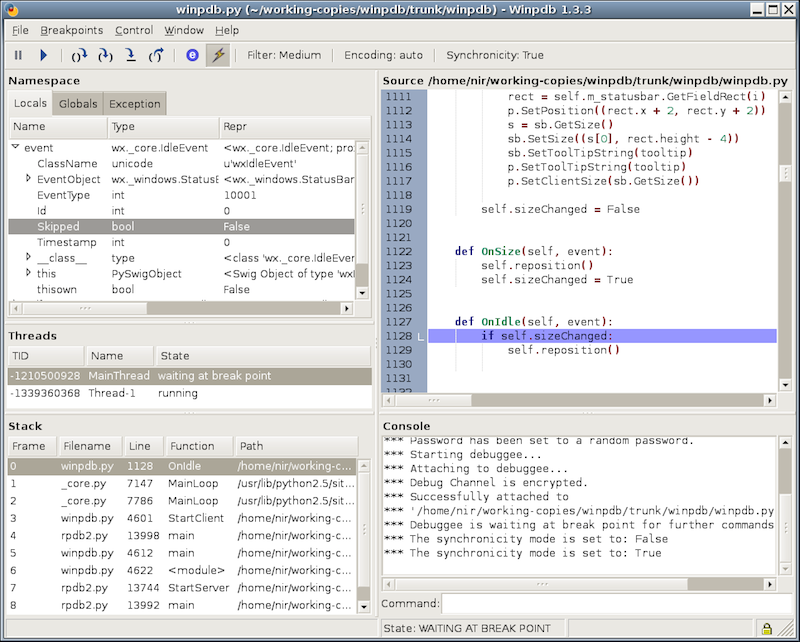
Standalone Python debugger, this time with a full-fledged graphical user interface: Winpdb :
Its developers claim that winpdb is 20 times faster than pdb, and also supports work with threads. A very large and detailed tutorial can be found on this page: code.google.com/p/winpdb/wiki/DebuggingTutorial .
IDE
Separate words deserve universal "combines" of programming: IDE, which allow you to run code, profile it, or run the built-in debugger without leaving the editor. I, perhaps, will select several products intended for development on Python: PyCharm , PyDev , Wing IDE and PTVS .
Lyrical digression
Unfortunately, I personally did not try as much as I could not overpower myself and exchange speed, amazing flexibility and convenience of working with the console and favorite text editor (be it vim, emacs or sublime text) for any of the above IDE, but my colleagues successfully they are used and therefore I advise you at least to give these wonderful products a chance and try them.
To be honest, I do not see much point in considering each of these IDEs, it’s enough to know that they are there, that they successfully cope with their tasks and you can use the built-in debugger directly from the editor - this is really convenient, cool and cool.
Thanks to everyone who read and commented.
Vladimir Rudnykh,
Technical Director of the Mail.Ru Calendar.
Source: https://habr.com/ru/post/205426/
All Articles