Telemetry of Windows Phone 8 and Windows 8 applications
 The new features of Visual Studio Online that we talked about at the launch of Visual Studio 2013 include the interesting Application Insights technology. This tool allows you to monitor the application and analyze important health parameters in many aspects. Exceptional situations, performance parameters, load on the processor, network and disk infrastructure - all this data can be obtained in the form of a concise presentation, which then allows you to make important decisions. Another interesting thing is that you can use Application Insights to monitor applications for Windows 8 and Windows Phone 8.
Soon the Application Insights technology will be available to a wide range of users of Visual Studio Online, and if you are among those who got access to the pre-release version, then you can try these features now.
Telemetry setup for Windows Phone Store and Windows Store applications
In order to enable telemetry in your application, first of all you need to get the Access Key in the Application Insights settings.
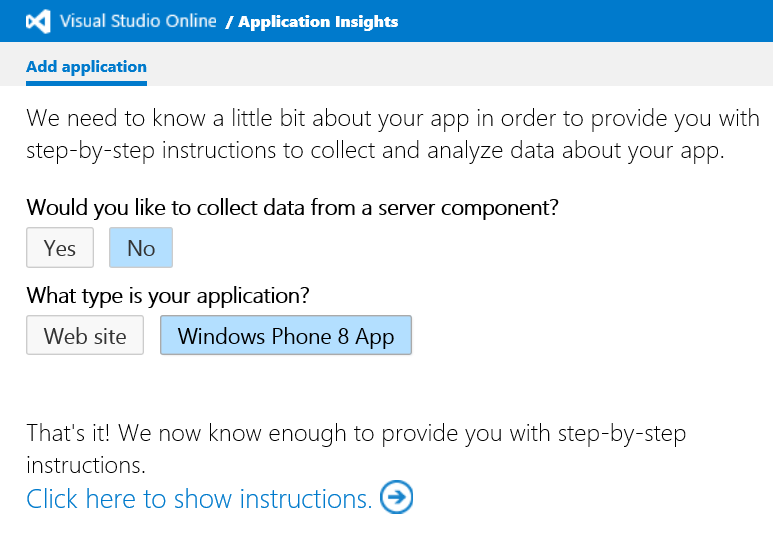
The next step is that the assistant will display you instructions on how to start monitoring your application, including the Access-Key.
Next you need to install the Nuget Package in your application:

')
We turn on monitoring inside the application
In order to use the monitoring functions in your application, it is now enough to connect the scope and in the starting function of the application, enable the monitoring mode:
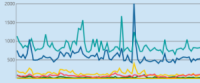
using Microsoft.ApplicationInsights.Telemetry.WindowPhone; … App() { ClientAnalyticsSession.Default.Start("KEY00000-0000-0000-0000-000000000000"); } These steps will be enough to start getting basic information about the operation of your application. After 15-20 minutes in the dashboard you will see data on the launches of your application:

Naturally, you can create your own metrics and then add them to the dashboard, as it is easily customizable:
For example, you want to analyze data about how many users have completed the game to the end. In the event handler for this event, simply insert the code that registers this event in Application Insigts:
ClientAnalyticsChannel.Default.LogEvent("EndOfGame"); If you need additional analytics parameters that allow filtering by some parameters, it is enough to add measurements to the event properties. For example, we want to make a filter that will allow us to analyze how many users have completed the game at the end at various difficulty levels:
var properties = new Dictionary<string, object>() { {"difficulty", currentGame.difficulty}}; ClientAnalyticsChannel.Default.LogEvent("EndOfGame", properties); In addition to simple types of events, it is also possible to analyze events related to time. For example, you want to analyze how long a web request takes from a mobile application. To do this, it is necessary to wrap the analyzed code segment in the context of TimenAnalyticsEvent and calling the StartTimedEvent () and End () functions.
TimedAnalyticsEvent token = ClientAnalyticsChannel.Default.StartTimedEvent("EventName")); // ... ... if (/**/) token.Cancel(); else token.End(); // . You just need to configure your dashboards and you will be able to make analytical decisions based on reliable information about the operation of your application.
You will learn more about this technology and its capabilities in the Brian Keller report on February 6 at the ALM Summit conference. We remind you that a special price is valid until the end of December. Register now to have the opportunity to talk with Microsoft employees and industry experts at the main conference on application lifecycle management!
Source: https://habr.com/ru/post/205020/
All Articles