Graphing tools for .NET

Not so long ago, we had to face a trivial task - to find a solution that would allow rendering graph graphics for .NET. Immediately make a reservation that I was interested only in linear graphs. The stumbling block that pushed for reworking an existing solution (these were graphs embedded in rdlc reports) was speed. In general, the following requirements were made for the solution sought:
- It is necessary to leave this optimization unnoticed for the end user, therefore, the solution must be widely customizable to ultimately look the same as its predecessor.
- Work quickly (well, of course, users do not like to wait).
- It is desirable to be free or open source. Buying would not be a big problem, I’ll find a great paid solution, but start better with open source.
What was done?
Googling, it turned out that there are quite a few options for solving this problem, and all of them are quite different in many ways (community size, speed, convenience). In the process of choosing a solution, 8 free options were tested:
- DisLin . Cross-platform library (UNIX, Linux, FreeBSD, OpenVMS, Windows, Mac OSX and MS-DOS). Extremely powerful, flexible, really worth it to write a separate article just about her. Maybe a little inferior to its competitors in the degree of readability of the code (uses the classical functional approach), but, thanks to this, it can be easily ported to almost any language. It has vanilla
cakesports in C, C ++, Fortran 77, Fortran 90, Perl, Python, Ruby, Tgl, GCL (the port in C # is a regular library with imported functions). Free for non-commercial use.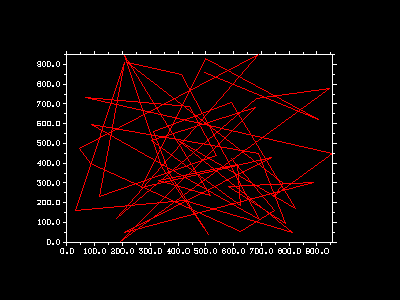
- Google Chart Sharp . Wrapper Google Chart API for C #. On Habré there were already articles about him, so in two words: free (with a limit of 50,000 thousand calls per day), works very fast, there are basic parameters for customization. Among the advantages: the ability to use wherever there is an internet connection, independence from the used language / OS. The main disadvantage is, of course, the additional round-trip data over the network (if you need the schedule even on the server), which slows down the process.
- Microsoft Chart Controls . Native functionality from Microsoft, which was presented to the public in the distant 2008. By that time, there were already a number of solutions from third-party developers, but this did not prevent Ms Chart Controls from quickly gaining popularity among developers. And it is not surprising, because they came with the .NET framework, had a successful architecture, were easily customizable and attractive in appearance. In terms of speed, they are inferior to the others, but, nevertheless, they also work quite well.
- NPlot . Another open source library. True, not the fastest and most popular - information on it can be found on the Internet, although not as much as, for example, Microsoft Chart Controls. Nevertheless, having played with her, I had a rather pleasant aftertaste.

- OxyPlot . “Live” cross-platform open source, where you can even report a bug, which is likely to respond. Also available in NuGet. There are corresponding controls for WPF / Silverligth, WinForms, Metro. Buns, like exporting directly to OpenXml and Pdf. If you need not a “minute” solution and the opportunity to correct it for yourself, this solution is for you.

- ZedGraph . Also "live" open source, a direct competitor for OxyPlot. In terms of the number of supported platforms (only Windows) and technologies (only WinForms and ASP .NET), it is inferior, but very nice and one of the fastest. An excellent choice if you need “just a beautiful schedule” and nothing else.
- WebChart . Free predecessor of Microsoft Chart Controls. As far as I can see, dead since 2004. It has a slightly poorer functionality in comparison with other solutions, but, since it has some external differences from the others, it can be quite useful.
- OpenMinded . Free option from the user OpenMinded . Looks beautiful. It is difficult to judge performance, since I did not find an opportunity to render the resulting image other than to a hard disk. But since the project is open, anyone can finish it for themselves, I am sure that this is not a problem.
At the very beginning, I decided that it was necessary to collect as many options as possible in one place and test them for speed, and after that it was very pitiful to throw the work done into the basket. Therefore, it was decided to issue this little article and post what happened, on GitHub . Thus, if the need arises, you can customize each solution for yourself and immediately check it. Personally, I really missed such an article at the beginning. Maybe the source will bring a smile to the guru, but for beginners who only delve into .NET and ASP, they will definitely be very useful.
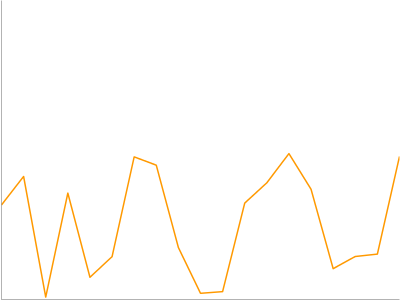
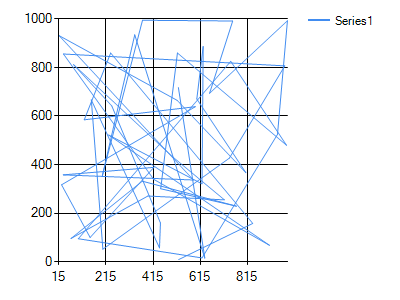
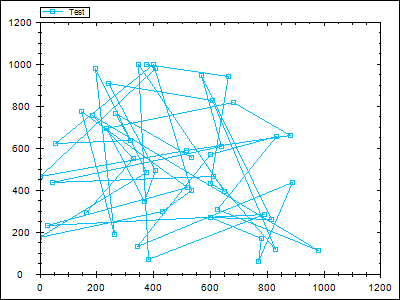
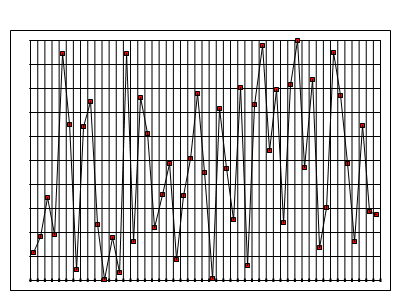
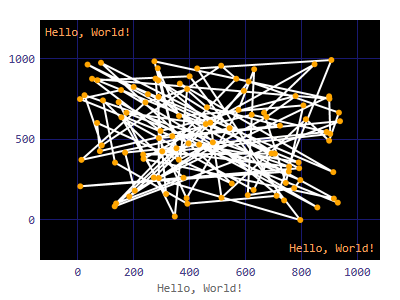
To compare the speed of work, the default settings of the graph are taken, the resolution of the output image is indicated and it is fed a fixed number of points. Each solution is run several times, and the average is taken as the actual speed. Again, this is quite subjective, and if you can offer a more beautiful approach, I will listen with interest.
On my PC (Intel Core I5 3.10 GHz, 8gb of RAM, Windows 7 x64), the following work speed distribution was released:
| No | Decision | Number of iterations | Total time (sec) | Average time per iteration (sec) |
| one | Dislin charts | five | 1.9071907 | 0.38143814 |
| 2 | Zed graph | five | 2.750275 | 0.550055 |
| 3 | NPlot | five | 3.1833183 | 0.63666366 |
| four | Web chart control | five | 5.130513 | 1.0261026 |
| five | Microsoft Chart Controls | five | 6.8456845 | 1.3691369 |
| 6 | Oxy plot | five | 7.0067006 | 1.40134012 |
| 7 | Open minded plot | five | 8.257 | 1.6514 |
| eight | Google Sharp charting | five | 9.8049804 | 1.96099608 |
For different input parameters (image resolution, number of points on the graph, PC parameters, Internet speed, moon phase, etc.), the results are slightly different, so you can test the speed in yourself.
I deliberately did not make a deep comparison of the features and possibilities of customization, since this is rather subjective information, which strongly depends on the specific task. If necessary, anyone can spend half an hour, take a look, look at the solution architecture, estimate how easy it is to customize them for specific requirements.
If someone knows more free solutions for graphs for .NET, which are omitted in the article, write in the comments, and I will try to add them.
upd - (added solution from OpenMinded )
upd2 - (included DevExpress in the survey)
')
Source: https://habr.com/ru/post/204308/
All Articles