Yandex.Tank and load testing automation
 During testing of some products from Positive Technologies, it became necessary to conduct quick stress tests of a single web service. These tests had to be simple and fast in development, undemanding to hardware resources and at the same time give a significant load of the same type HTTP requests, as well as provide statistical data for analyzing the system under load.
To implement them, we researched and tested a number of tools, among which were Apache JMeter and the Python script LogSniper, which we wrote in Python, which performed replays of previously prepared server logs with HTTP requests for the target.
It was decided to abandon the use of JMeter due to the considerable complexity of preparing and conducting tests, the high performance requirements of the load stand and the relatively low load capacities, although these disadvantages were compensated for by the high information content of the statistics collected. LogSniper was rejected due to the low power of the generated load, and here even the simplicity of preparing HTTP load packets could not outweigh. Other well-known tools, for one reason or another, also did not fit us.
')
As a result, we stopped at the Yandex.Tank tool, which we learned about, having visited the YAC-2013 conference and talked to Yandex specialists. This tool fully met all our requirements for ease of preparation of the test and for the generated load.
What is it
Yandex.Tank is a load testing tool developed by Yandex and distributed under the LGPL license. The tool is based on a high-performance asynchronous phantom load generator: it was converted from a web server of the same name, which was “taught” to work in client mode. With the help of phantom you can generate tens and hundreds of thousands of HTTP requests per second (http-requests per second, http-rps ).
In the course of its work, the Tank saves the obtained results in ordinary text logs, grouped in directories for individual tests. During the test, a special module organizes the output of results to the console interface in the form of tables. At the same time, a local web server is started, allowing you to see the same results on informative graphs. At the end of the test, it is possible to automatically save the results on Loadosophia.org . There is also a module for uploading results to the Graphite repository.
Some useful links:
- project code on GitHub ;
- official documentation on setting up and using the tool;
- information about Tank modules in the developers wiki;
- presentation on the history of the instrument;
- the history of the load testing service in Yandex and the development of Tank;
- Yandex club dedicated to the use of the tool .
Today, we will not dwell on the installation and configuration of the Tank, since this information is easy to find on the network, but we’ll go straight to describing our experience in using it.
Performance comparison of two similar web services
In the course of work, we needed to compare the characteristics of two web services, whose work can be roughly described as “transparent HTTP proxies that redirect incoming requests to the backend application”.
The general scheme of work can be represented as follows:
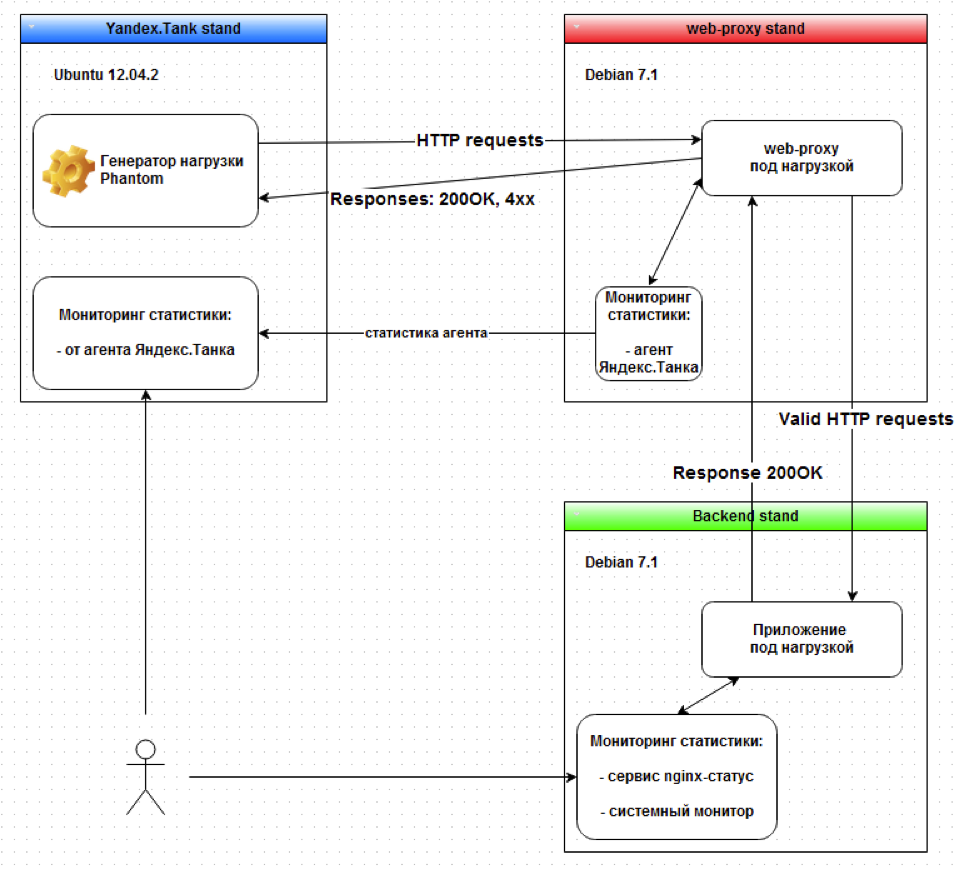
At the stand with the Tank, the phantom load generator was used with the performance monitor turned on.
As a web proxy stand, two test web services were used on the scheme, from which performance indicators were taken with the help of the Tank agent. Let's call them Reference Web service and Test web service . We needed to understand whether the performance of the test web service corresponds to the reference one.
For backend, we used a small web application running under Nginx and returning one simple HTML page.
Revealed limitations
Before starting work, we collected information on the limitations of virtual stands on which the entire test infrastructure was built.
Backend application stand features:
- 8 vCPU, 4 GB, 10 Gb / s,
- nginx web server.
The maximum return of the server, which was achieved, was ~ 25,000 http-rps, but even with a load above 25k http-rps, the work of the stand was not disrupted.
The stand of the Tank with the characteristics of 16 vCPU, 8 GB, 10 Gb / s allowed to realize the load up to 300 000 http-rps.
The throughput of the ESXi virtual environment, determined using Iperf, was 8 Gb / s in one direction, 4 Gb / s with a two-way load between two virtual machines.
Metrics and comparison criteria
Before starting work, we determined the following metrics for each load profile for further measurement:
- http_rps_out - the http-rps value sent from Tank to the web application,
- http_rps_in - the http-rps value received on Tank by the web application,
- http_request_size - http request size in bytes,
- send_requests - the number of sent HTTP requests,
- bs_out - bytes per seconds , bytes per second - the parameter determines the speed of sending data from the Tank,
- bs_in - bs value sent from the web application to Tank,
- test_time - test time in seconds
- response_time_med is the average time at which 90% of all responses fit.
Knowing the number of HTTP requests and their size, we find that bs and http-rps are related by the formula: bs = http_rps * http_request_size .
In this case, we decided to choose the following criteria for comparing the performance of web services under load:
- For the entire time of the test, the value of the parameter “time within which 90% of responses fit in” for a web service under test should be no more than that of the reference web service.
- On the segment of increasing load on the next 1000 http-rps, the value of the parameter “time in which 90% of responses fit” in the tested web service should be no more than that of the reference web service.
- For the entire test time, the total number of correctly processed requests for the tested web service should be no less than that of the reference web service.
Similarly, you can define other criteria load tests for any projects.
Test HTTP requests
For one of the stress test profiles, we needed to create mixed HTTP traffic from GET and POST requests with a linear increase in load up to 10k http-rps within 10 minutes.
HTTP requests included in the cartridge of Yandex.Tank
GET /loadtest/index.php?id=1&login=user&pwd=password HTTP/1.1 X-Sniffer-Forwarded-For: yandex-tank-example-domain.ptsecurity.ru Host: backend-example-domain.ptsecurity.ru User-Agent: Mozilla/5.0 (compatible; Googlebot/2.1; +http://www.google.com/bot.html) POST /loadtest/index.php HTTP/1.1 X-Sniffer-Forwarded-For: yandex-tank-example-domain.ptsecurity.ru Host: backend-example-domain.ptsecurity.ru User-Agent: Mozilla/5.0 (compatible; Googlebot/2.1; +http://www.google.com/bot.html) Content-Length: 32 id=1&login=user&pwd=password POST /loadtest/index.php HTTP/1.1 X-Sniffer-Forwarded-For: yandex-tank-example-domain.ptsecurity.ru Content-Type: multipart/form-data; boundary=validFile Host: backend-example-domain.ptsecurity.ru User-Agent: Mozilla/5.0 (compatible; Googlebot/2.1; +http://www.google.com/bot.html) Content-Length: 150 --validFile Content-Disposition: form-data; name="login"; filename="validFile.txt" Content-Type: text/plain Valid file content --validFile-- To simplify the preparation of the patron for such a mixed traffic, we have made scripts similar to the perl scripts offered on the forum.
Data collection and analysis of results
After preparing the requests, we simply launched the Tank in the standard way and performed a load test with mixed traffic for both tested web services.
Results for reference web service
Tank's web monitor information:
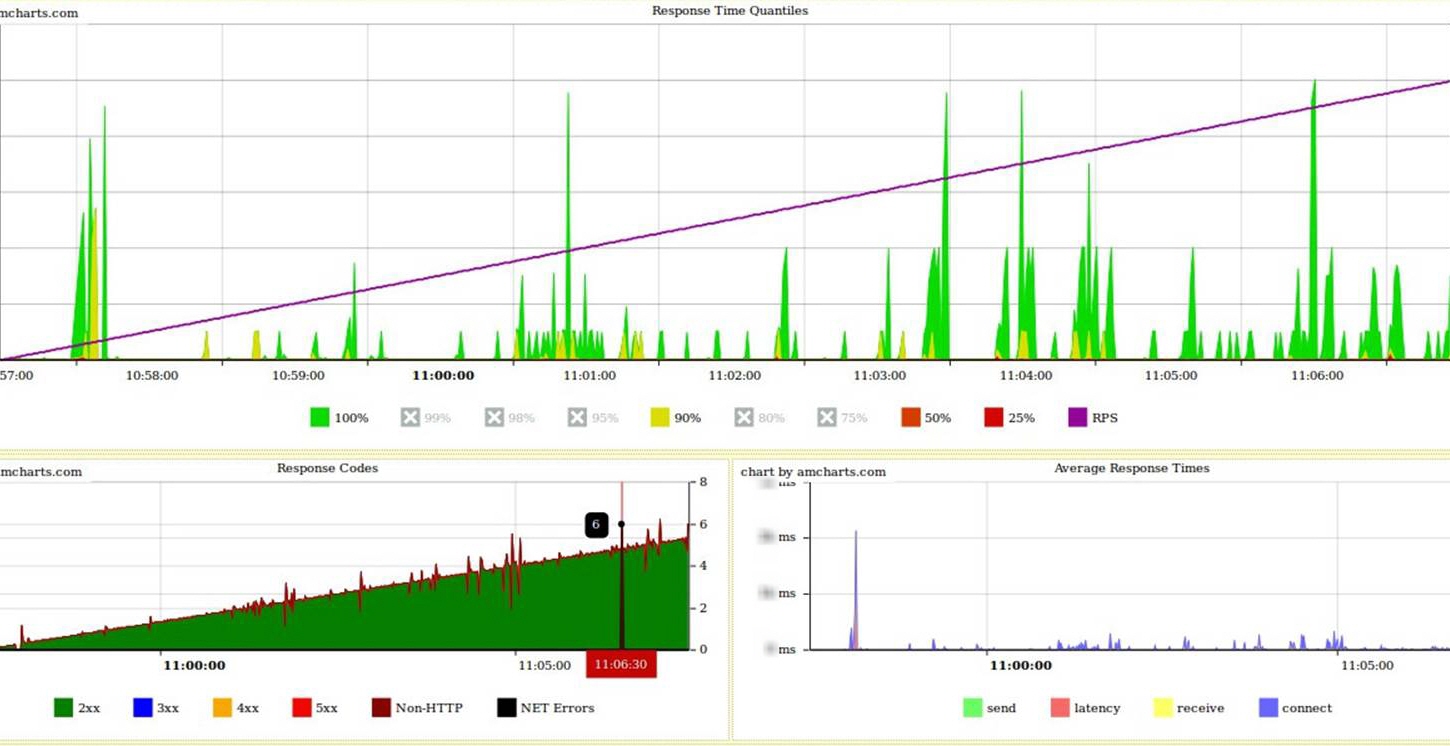
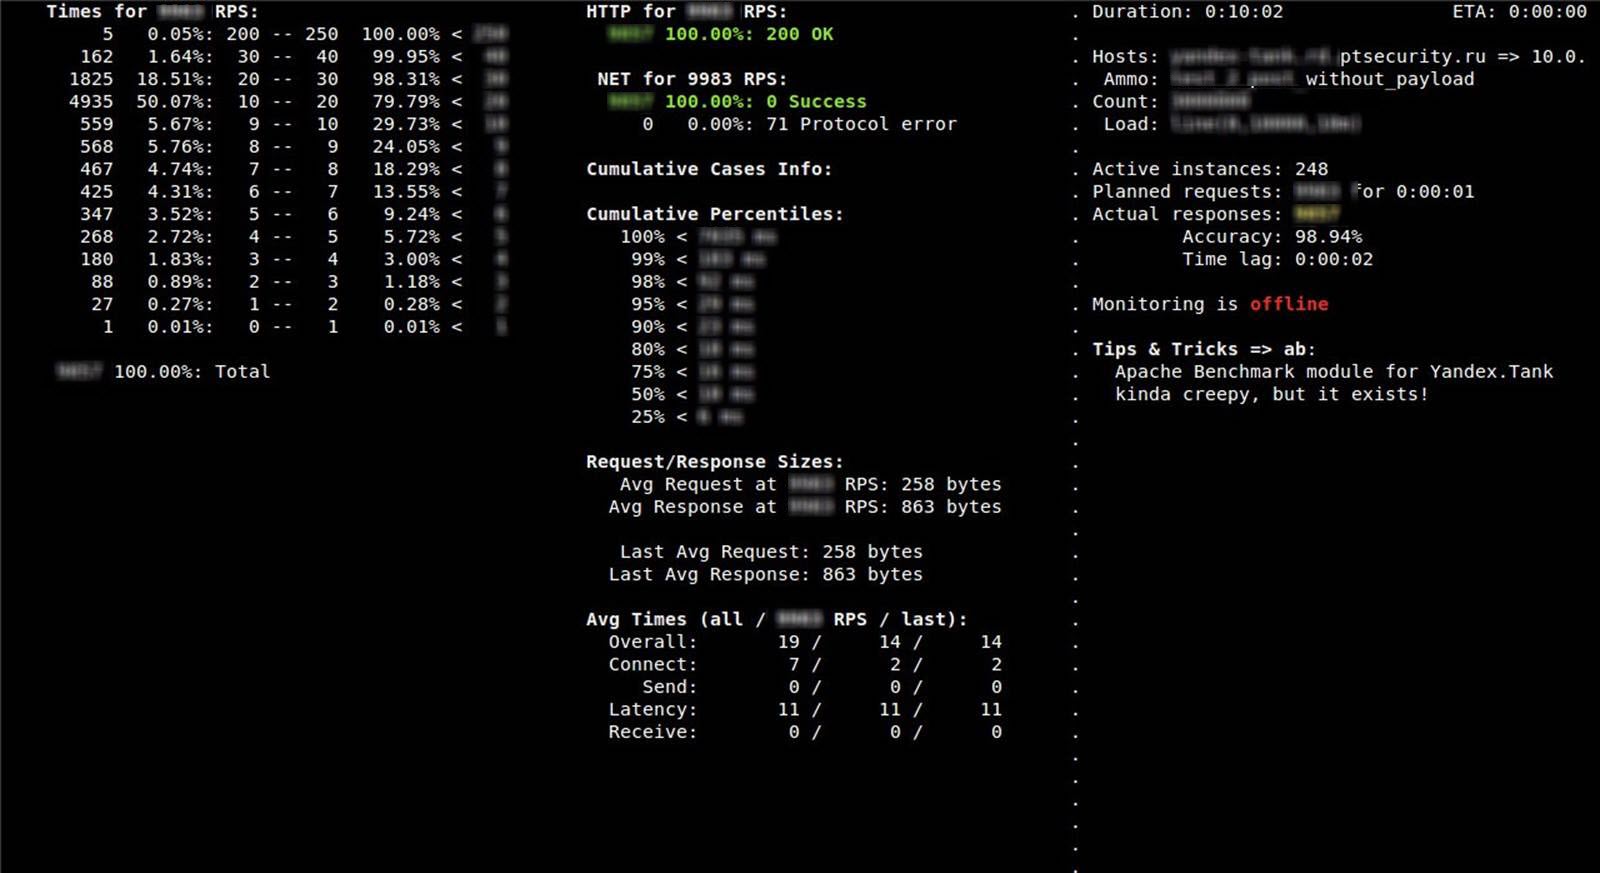
Tank console information:
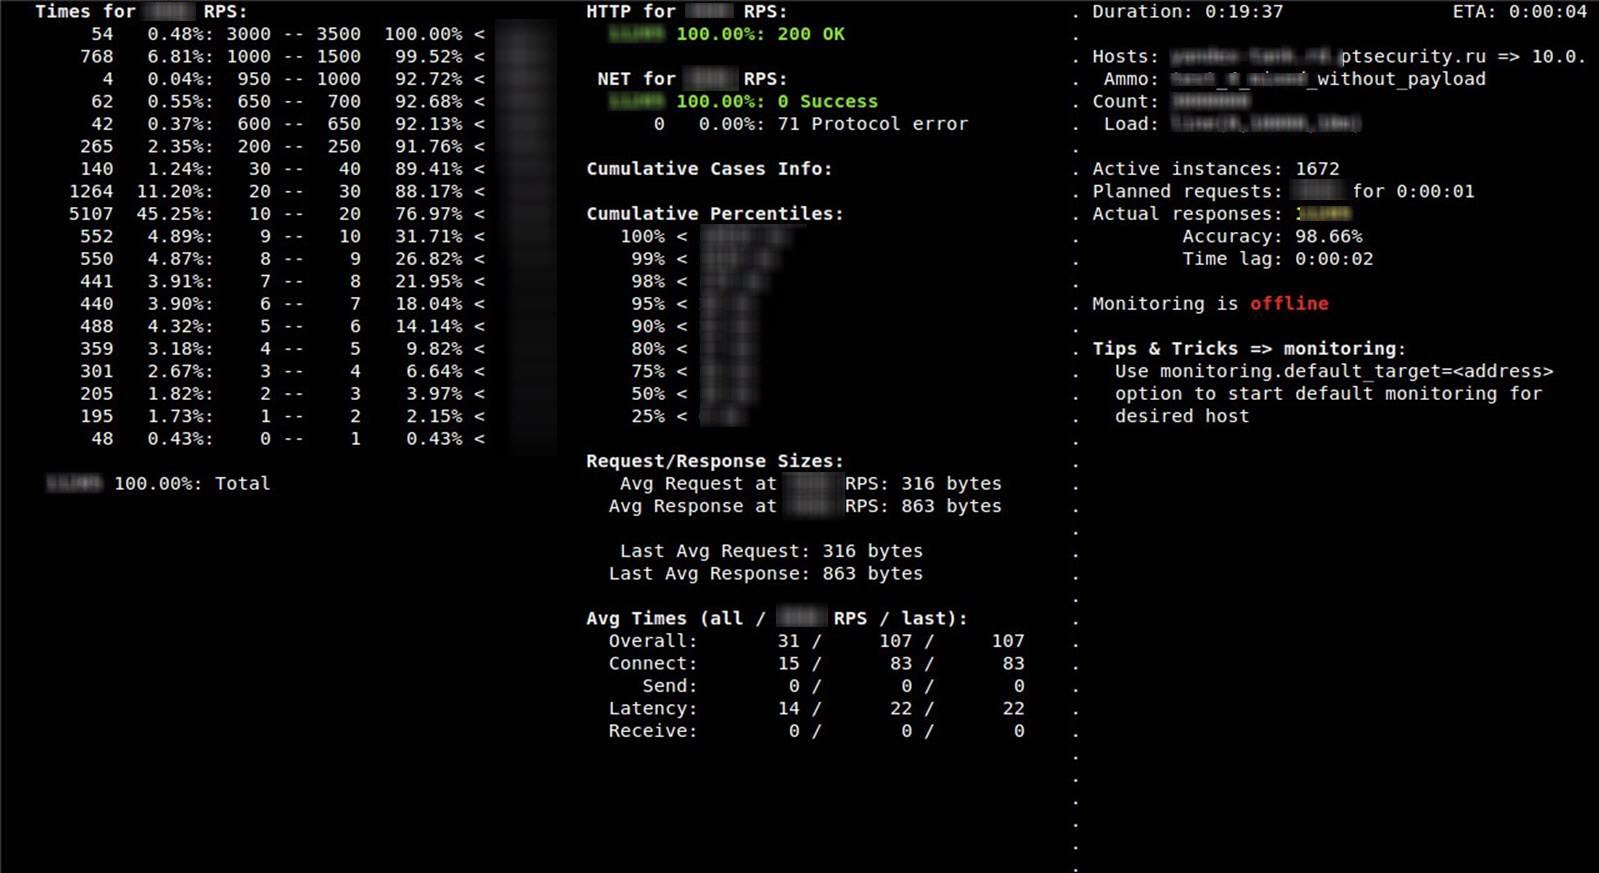
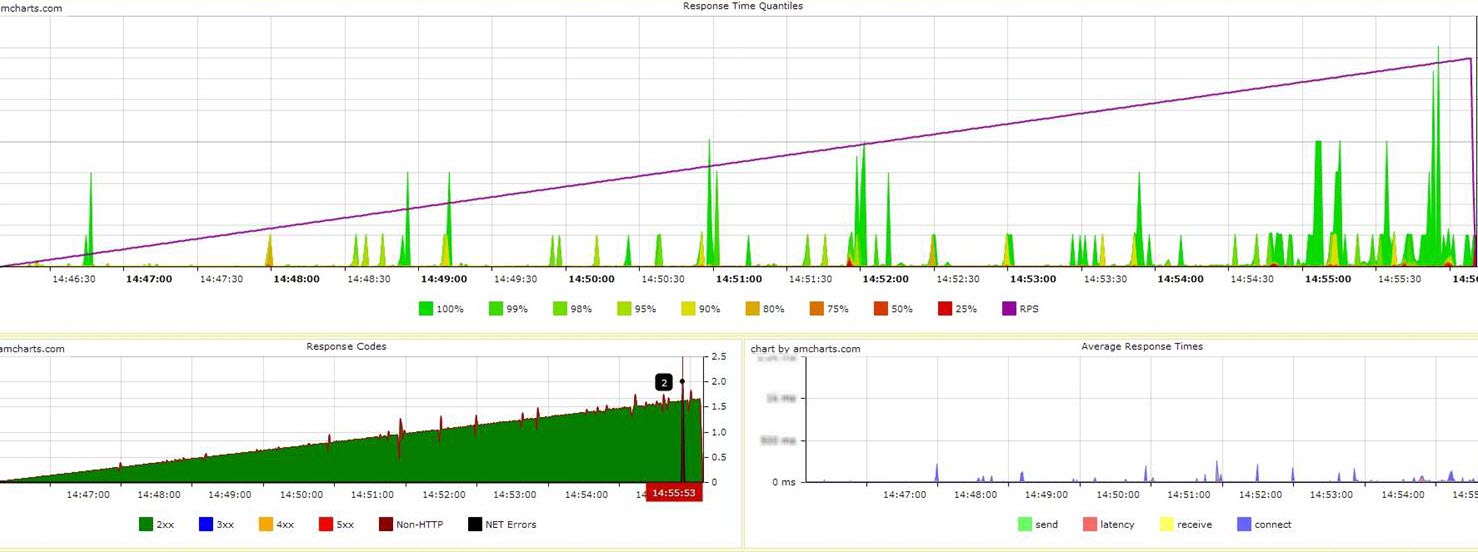
Results for the tested web service
Tank's web monitor information:
Tank console information:
Even judging by the graphs, the test service showed results no worse than the reference one. Having checked all three criteria formally defined above, we were convinced of this.
- The tested service satisfies the first criterion, since for 90% of requests the average response time for the tested service did not exceed the same indicator for the reference service.
- The requirement of the second criterion was met for each stage of the load.
- Judging by the analysis of the status codes of the responses recorded in the Tank journals, the web service subject received and correctly processed the requests more than the reference web service.
findings
According to the results of working with Yandex.Tank, you can declare with full responsibility that this tool is excellent in cases where you need to quickly conduct load testing of web applications without their complicated preparation and at the same time get a lot of useful statistical data for performance analysis.
In addition, it is well embedded in existing automation systems. For example, to simplify the work with the Tank booth - control, launch, preparation of cartridges for tapes, control over the testing process and collection of results - we effortlessly wrote a class-binding in Python that connects to the stand via SSH and performs all of the above actions. This class was then built into our existing auto-testing system.
Additionally, you can see how to connect and use the high-performance Graphit system for analyzing a large number of graphs (described in one of the presentations at the YAC-2013 conference). It can also be adapted for the needs of load testing using Yandex.Tank.
I express my gratitude to my colleague Oleg Kashtanov for technical support.
Author : Timur Gilmullin ( blog ).
Source: https://habr.com/ru/post/204224/
All Articles