OpenMP application performance profiling
OpenMP is perhaps the most common parallel programming model on threads, on shared memory systems. Appreciate it for high-level parallel constructions (in comparison with programming system streams) and support by different manufacturers of compilers. But this post is not about the OpenMP standard itself, there are a lot of materials about it on the net.
Parallelize computations on OpenMP for the sake of performance, which is what the article is about. More precisely, performance measurement using Intel VTune Amplifier XE. Namely, how to get information about:
- Retrieving the profile of the entire OpenMP application
- Profile of individual OpenMP parallel regions (CPU time, hot functions, etc.)
- Work balance within a separate OpenMP parallel region
- Parallel / Serial Code Balance
- The granularity level of parallel tasks
- Synchronization objects, latency and inter-thread control transfers
Run OpenMP profiling application
To profile an OpenMP program, you will need VTune Amplifier XE 2013 Update 4 or later. The application is better to build Composer XE 2013 Update 2 or newer. Analysis of older OpenMP implementations from Intel or from other manufacturers (GCC and Microsoft OpenMP) is also possible, but less useful information will be collected. VTune Amplifier XE cannot recognize their parallel regions.
')
All steps described in the article are valid for Windows and Linux. The examples given were tested on Linux.
If your compiler is older than Intel Composer XE 2013 SP1, set the KMP_FORKJOIN_FRAMES environment variable to 1. You can do this in the VTune Amplifier itself in the “User-defined Environment Variable” dialog in the project properties, well or manually:
#
export KMP_FORKJOIN_FRAMES=1To get complete information about source files with parallel regions, compile with the option -parallel-source-info = 2. For my examples, I used the following compilation line:
#
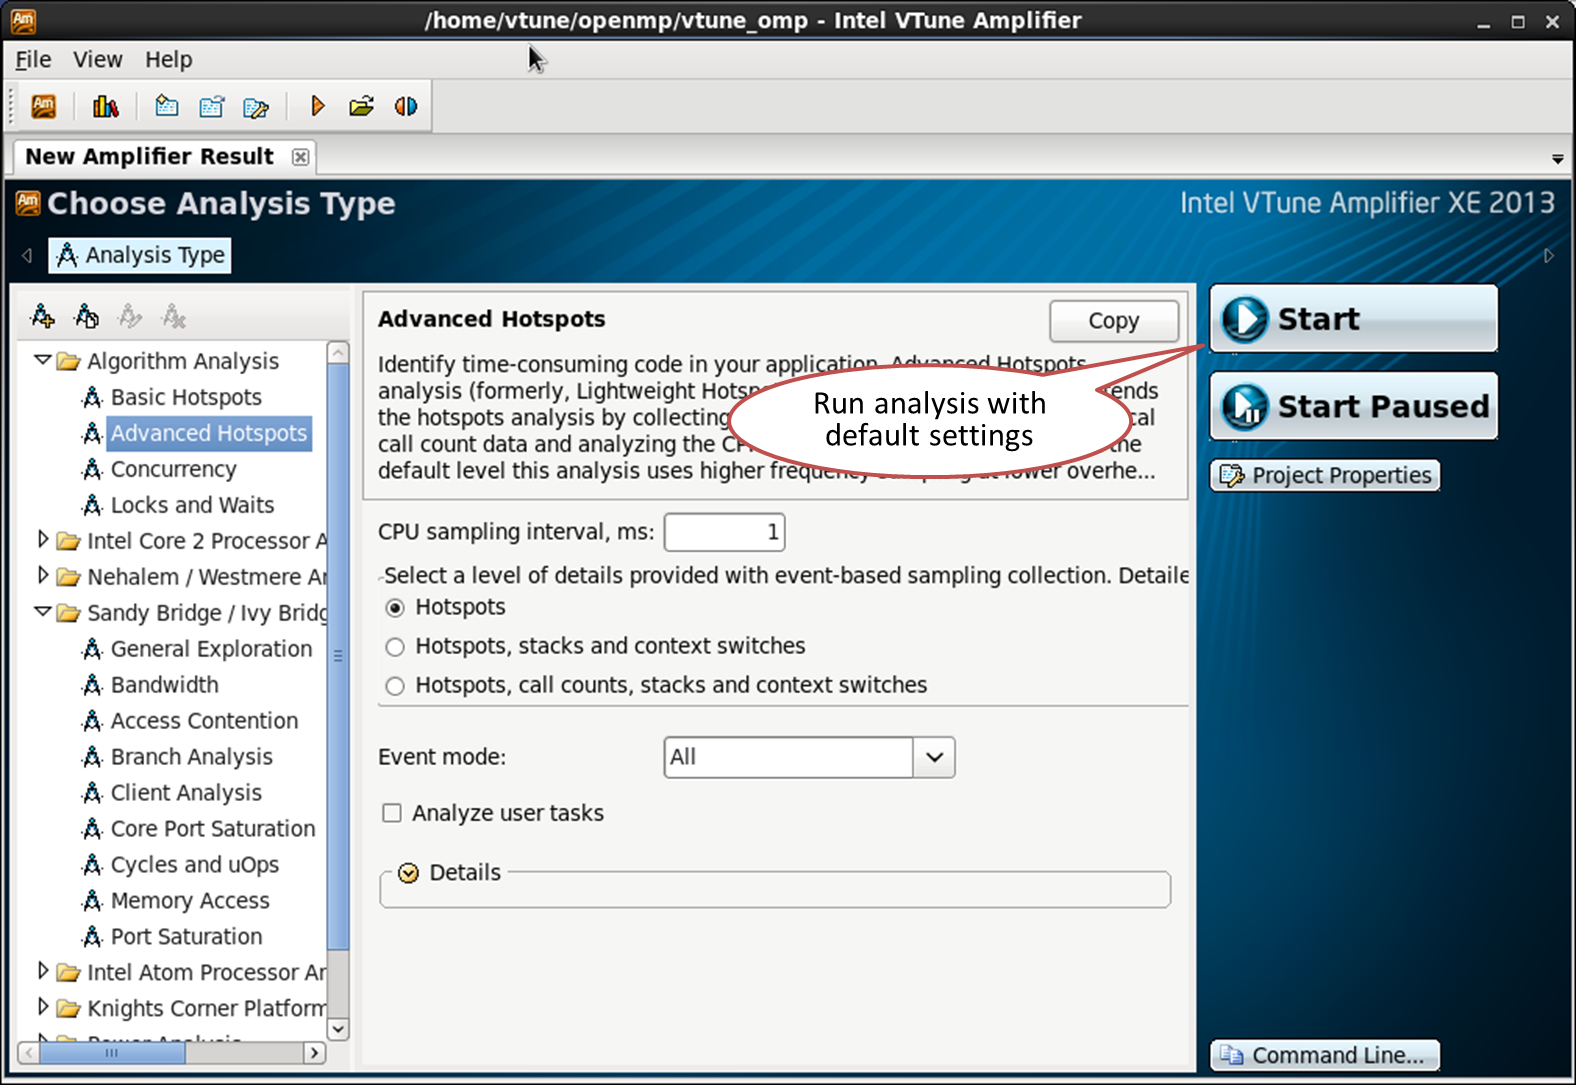
icc -openmp -O3 -g -parallel-source-info=2 omptest.cpp work.cpp -o omptestEverything else is no different from the analysis of a regular application: we launch the VTune Amplifier, create a project, specify our application, and start profiling:
View OpenMP parallel regions
OpenMP parallel regions are represented in VTune Amplifier XE as frame domains. Frames are a sequence of non-overlapping intervals of application execution time. Those. You can break the program all the time at the stage: for example, stage 1 (initialization), stage 2 (work), stage 3 (completion). These stages can be represented by three frames. Frames are often mentioned in graphics applications - the idea is the same, but the concept of a frame in VTune Amplifier is broader. Frames are global and not tied to specific threads.
Each parallel OpenMP region is shown as a separate frame domain. It is identified by the source file and line numbers. The frame domain denotes a region in the source code. Each challenge to this region is a frame. Frame - the period from the point of separation (or launch) of threads (fork) to the point of their reunion (join) The number of frames is not related to the number of threads and the size of the tasks.
The pseudo code below contains two parallel OpenMP constructs, two regions. Each of them will be recognized as a domain frame in the VTune Amplifier XE profile, so there will be two domain frames:
int main() { #pragma omp parallel for // frame domain #1, frame count: 1 for (int i=0; i < NUM_ITERATIONS; i++) { do_work(); } for (int j=0; j<4; j++) { #pragma omp parallel for // frame domain #2, frame count: 4 for (int i=0; i < NUM_ITERATIONS; i++) { do_work(); } } } The first frame domain is called only once. Therefore, frame domain # 1 will have only 1 frame, even if the body of a parallel loop is executed immediately by 16 threads. The second parallel region (frame domain # 2) is launched from the loop sequentially 4 times. For each iteration, a parallel construction is invoked, with the corresponding starts and terminations of the threads. Therefore, frame domain # 2 will have 4 frames in the VTune Amplifier XE profile.
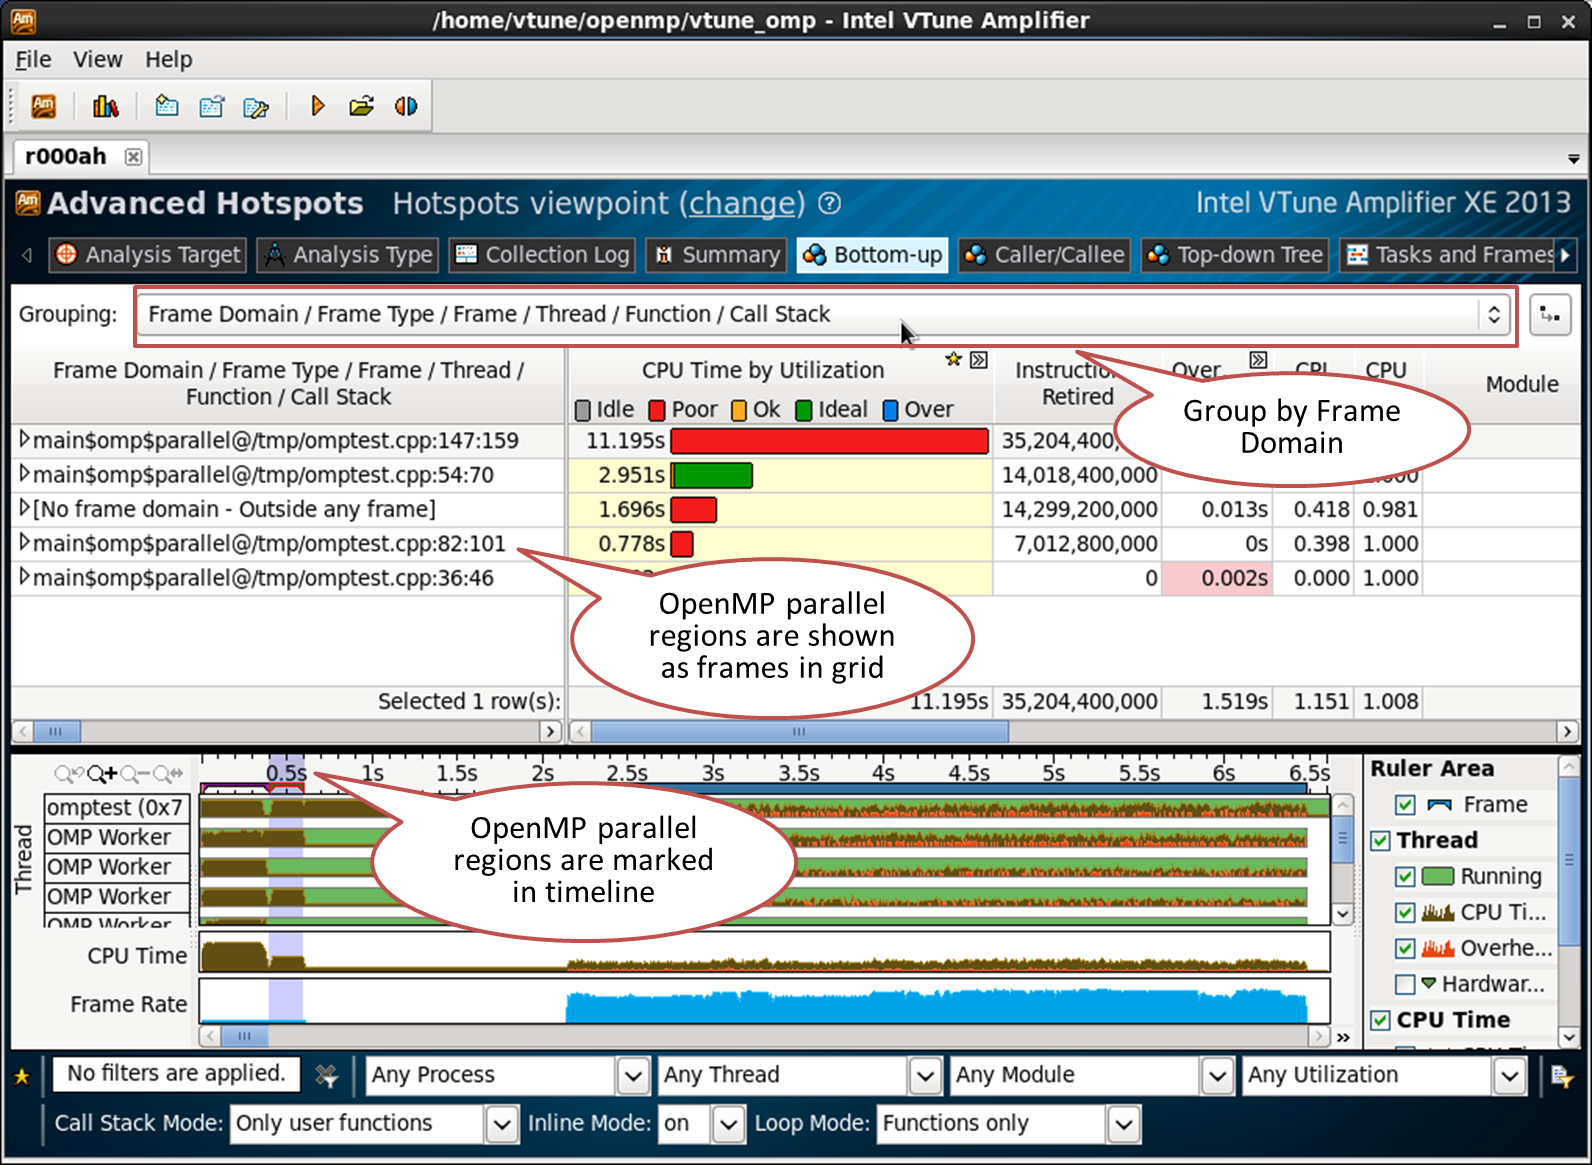
Parallel regions are recognized if the program uses Intel OpenMP runtime. To see them, as a result of VTune Amplifier XE, switch to the Bottom-up tab and select the grouping by "Frame Domain / Frame Type ...":
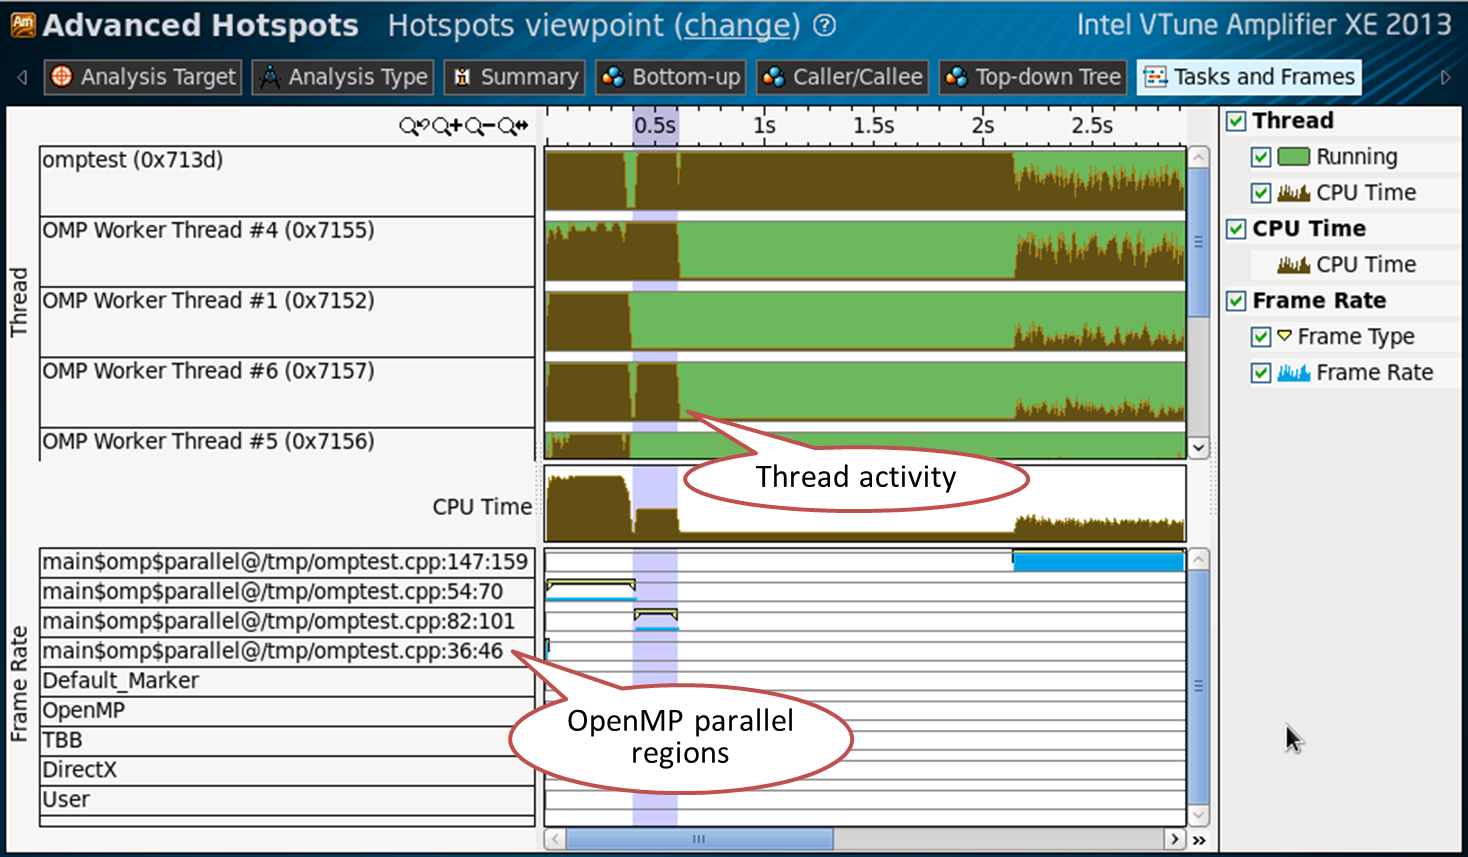
Parallel OpenMP regions and their corresponding thread activity can also be seen in the Tasks and Frames tab:
Sequential region
All the CPU time spent outside the parallel regions is going to the frame domain called “[No frame domain - Outside any frame]”. This allows you to evaluate the sequential part of your code:

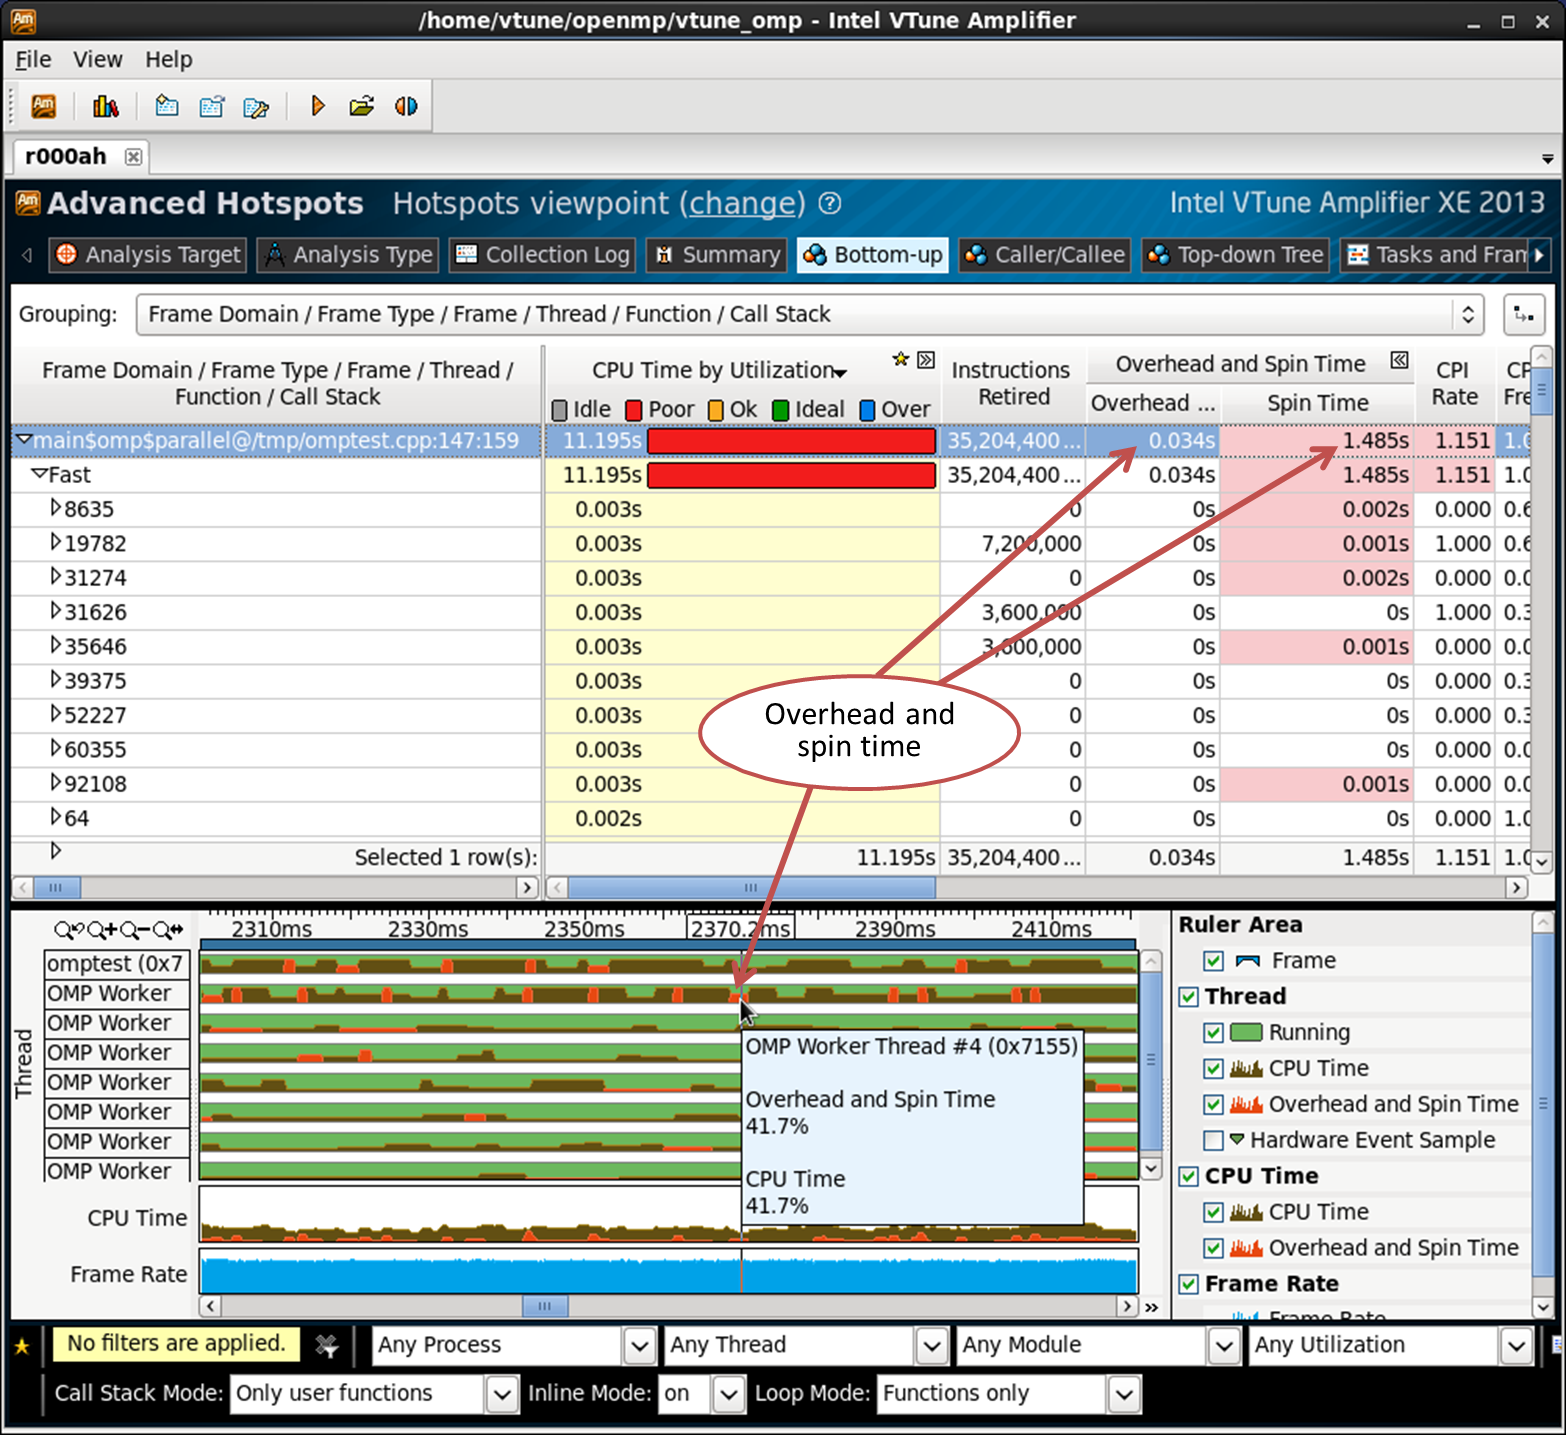
Overhead and active wait (overhead and spin time)
Overhead time in OpenMP is the time spent executing internal runtime procedures related to flow control, work distribution, scheduling, synchronization, etc. This is the time spent not on useful calculations, but on the internal functions of the library. Spin time is the time during which the CPU is running. This can occur, for example, if the synchronization object makes a call to the poll, instead of going into the waiting state — spinning (spinning) while waiting. OpenMP threads can also “spin” like this, for example, on the synchronization barrier.
Overhead and active wait are tracked by known function names and call sequences that waste CPU time. Some internal OpenMP functions manage threads, tasks, and so on, so the time spent in them is related to overhead. The time of active waiting is also determined by the functions that implement the “torsion”.
Overhead costs and active waiting are defined for Intel OpenMP runtimes, GCC and Microsoft OpenMP, Intel Threading Building Blocks and Intel Cilk Plus.
Scenario 1: Ideally balanced parallel region
In my simple example, a parallel region in the omptest.cpp file on line 54 is a good case. Look at the Bottom-up tab, grouped by “Frame Domain / Frame Type / Frame / Thread / Function / Call Stack”:
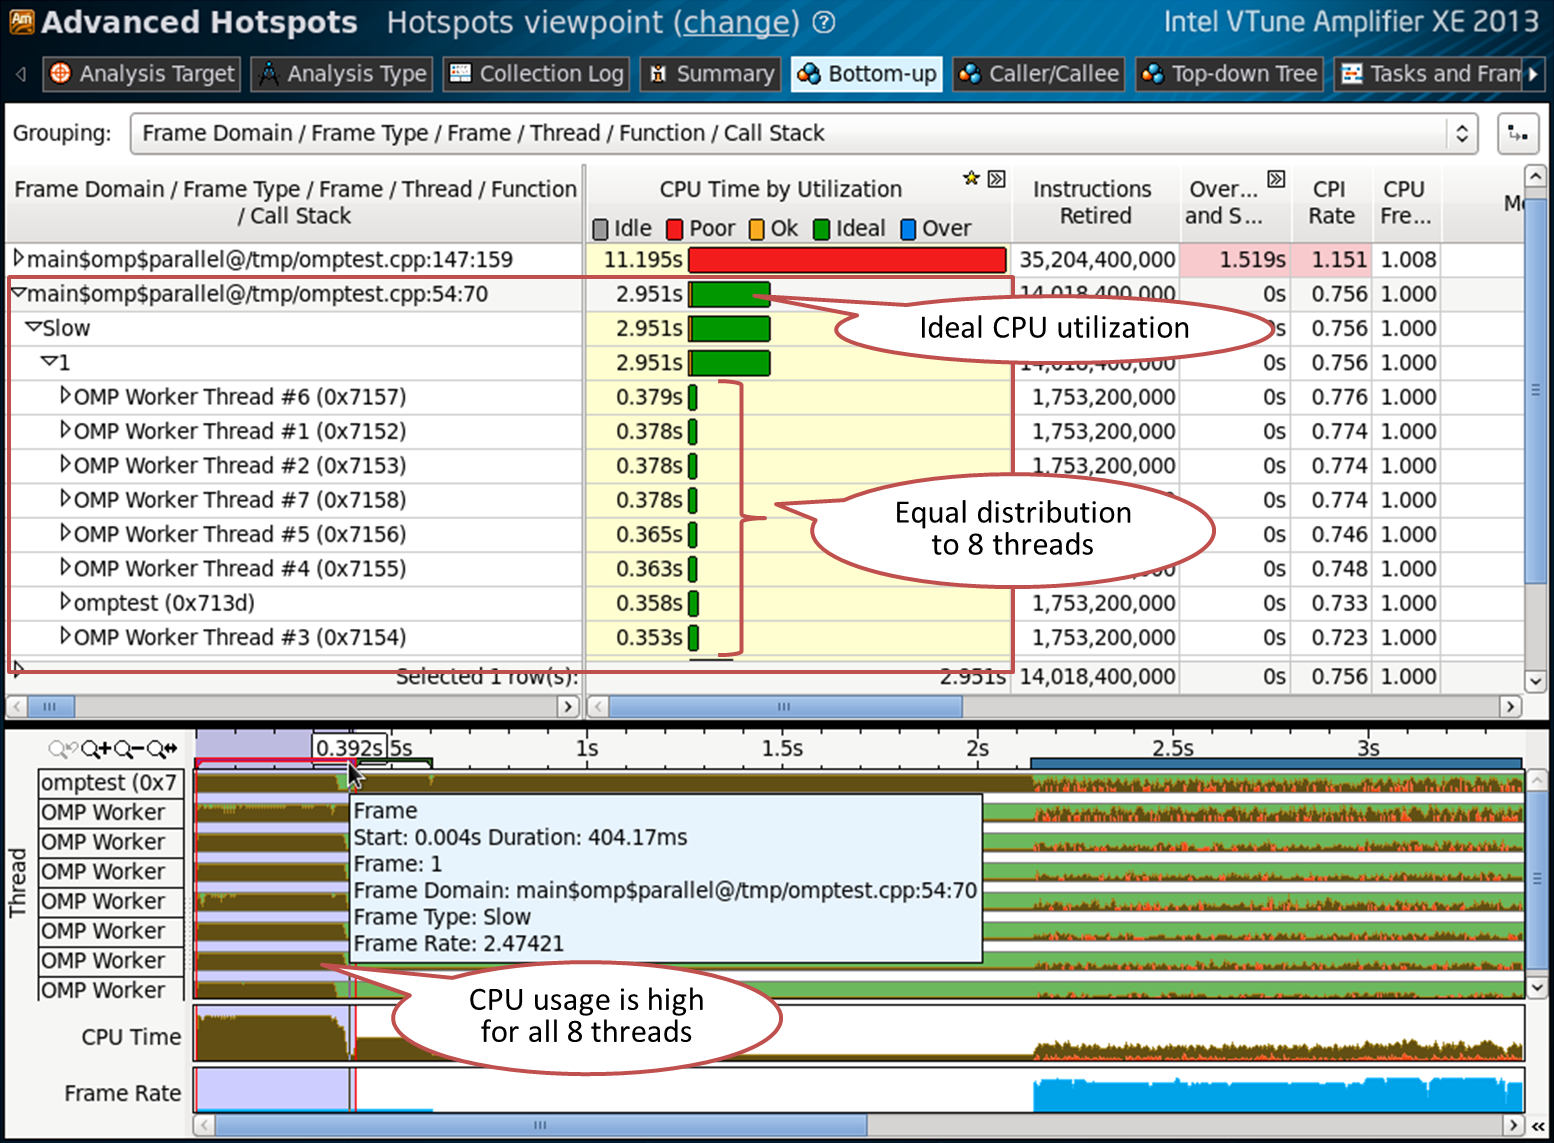
The domain frame contains only one frame, which means that the parallel region was called only once. Expanding the details in the table shows 8 threads. This is good for a 4 core machine with Hyper Threading that was tested. The CPU is well loaded (green color of the CPU time bar), all 8 threads are busy in this region and do almost the same amount of work. This parallel region is marked on the timeline, where a high processor load is also visible for all eight threads. This does not mean that everything is perfect - for example, there may be cache misses or insufficient use of SIMD instructions. But no problems with the OpenMP threads and the balance of work were found.
The code from the example on line 54:
#pragma omp parallel for schedule(static,1) // line 54 for (int index = 0 ; index < oloops ; index++) { double *a, *b, *c, *at ; int ick ; a = ga + index*84 ; c = gc + index*84 ; fillmat (a) ; ick = work (a, c,gmask) ; if (ick > 0) { printf("error ick failed\n") ; exit(1) ; } } Scenario 2: Unbalanced parallel region
The region on line 82 is not so balanced. It uses only 4 streams from 8 available, the remaining 4 are waiting. This is reflected in the level of CPU usage (red color):
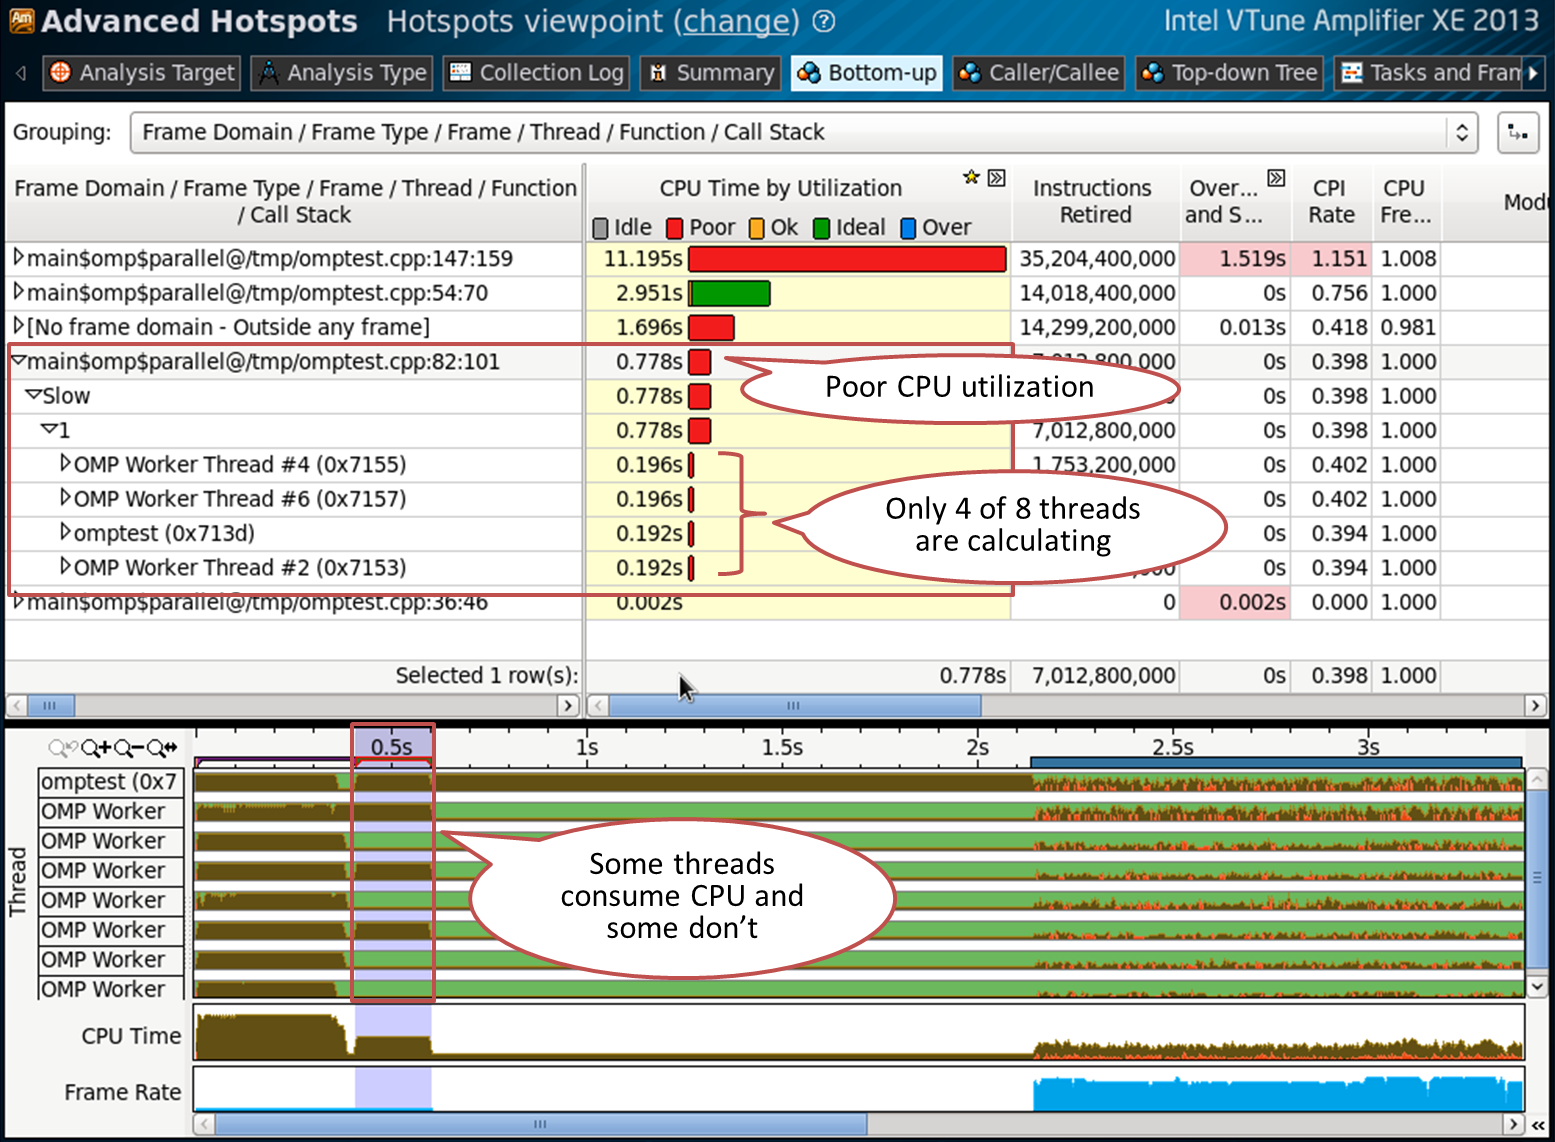
The code on line 82 (just turned off every second iteration):
#pragma omp parallel for schedule(static,1) // line 82 for (int index = 0 ; index < oloops ; index++) { double *a, *b, *c, *at ; int ick ; if (index%2 == 0) { a = ga + index*84 ; c = gc + index*84 ; fillmat (a) ; ick = work (a, c, gmask) ; if (ick > 0) { printf("error ick failed\n") ; exit(1) ; } } } Scenario 3: Problems with granularity
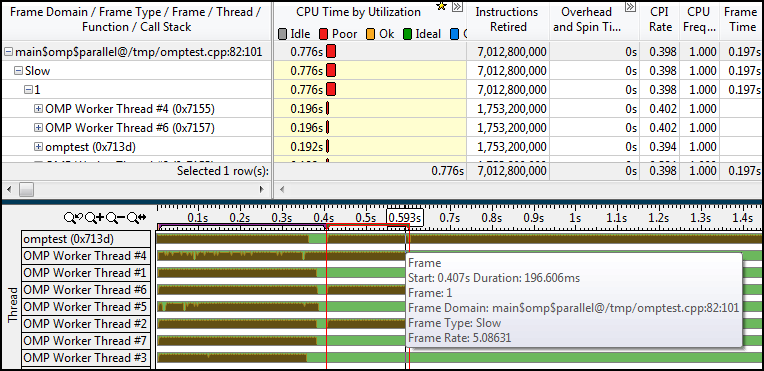
The previous examples had one domain frame and one frame. The region on line 147 contains a number of frames:
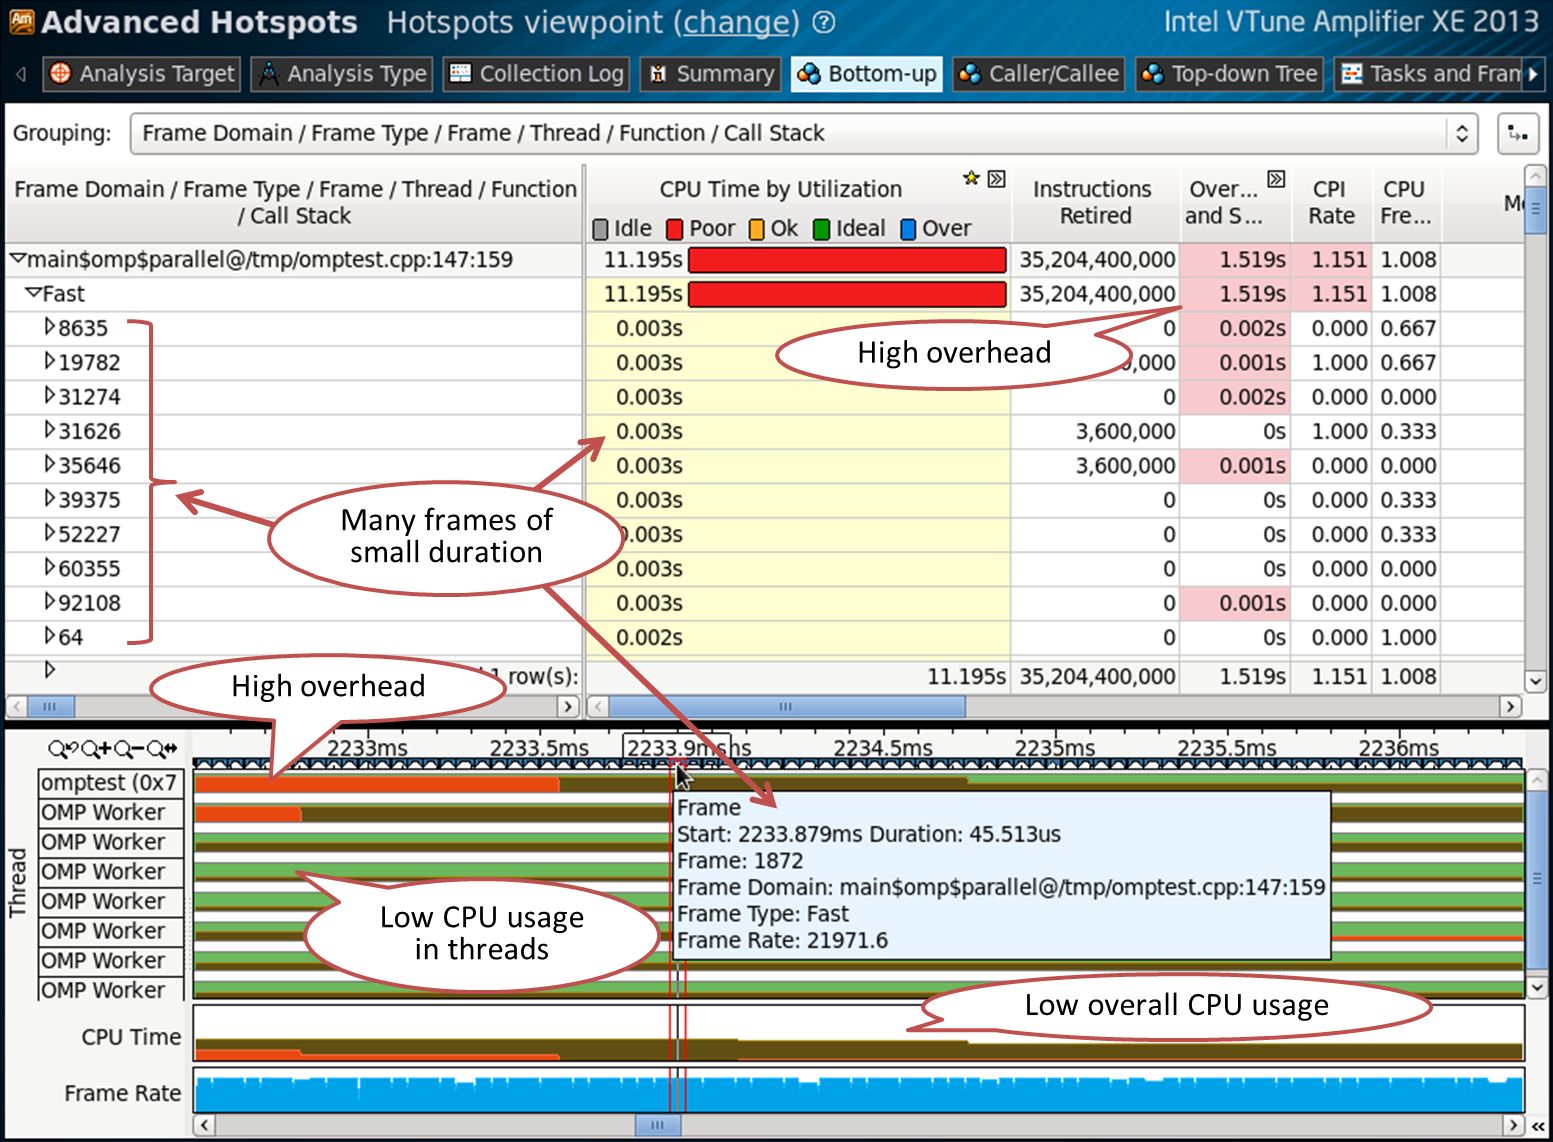
This means that a parallel region has been called multiple times. The CPU time of each frame is very small - this can be seen in the pop-up window when you hover the frame with the mouse in the timeline. This suggests that granularity is too high, in the sense that we too often run very short parallel OpenMP regions. From this we get high overhead and low CPU.
The code on line 147:
for (q = 0 ; q < LOOPS ; q++) { #pragma omp parallel for schedule(static,1) firstprivate(tcorrect) lastprivate(tcorrect) // line 147 for (int index = 0 ; index < oloops ; index++) { double *la, *lc; int lq,lmask ; la = ga + index*84 ; lc = gc + index*84 ; lq = q ; lmask = gmask ; ick = work1(ga, gc, lq,lmask) ; if (ick == VLEN) tcorrect++ ; } } Scenario 4: Sync Objects and Wait Time
Waiting on the synchronization object can be a serious bottleneck for performance. For a complete picture of the synchronizations and expectations in your application, collect the “Locks and Waits” analysis. Before launch, enable the “Analyze user tasks” and “Analyze Intel runtimes and user synchronization” checkboxes in the new analysis settings.
The Bottom-up panel shows you a list of synchronization objects, sorted by timeout:
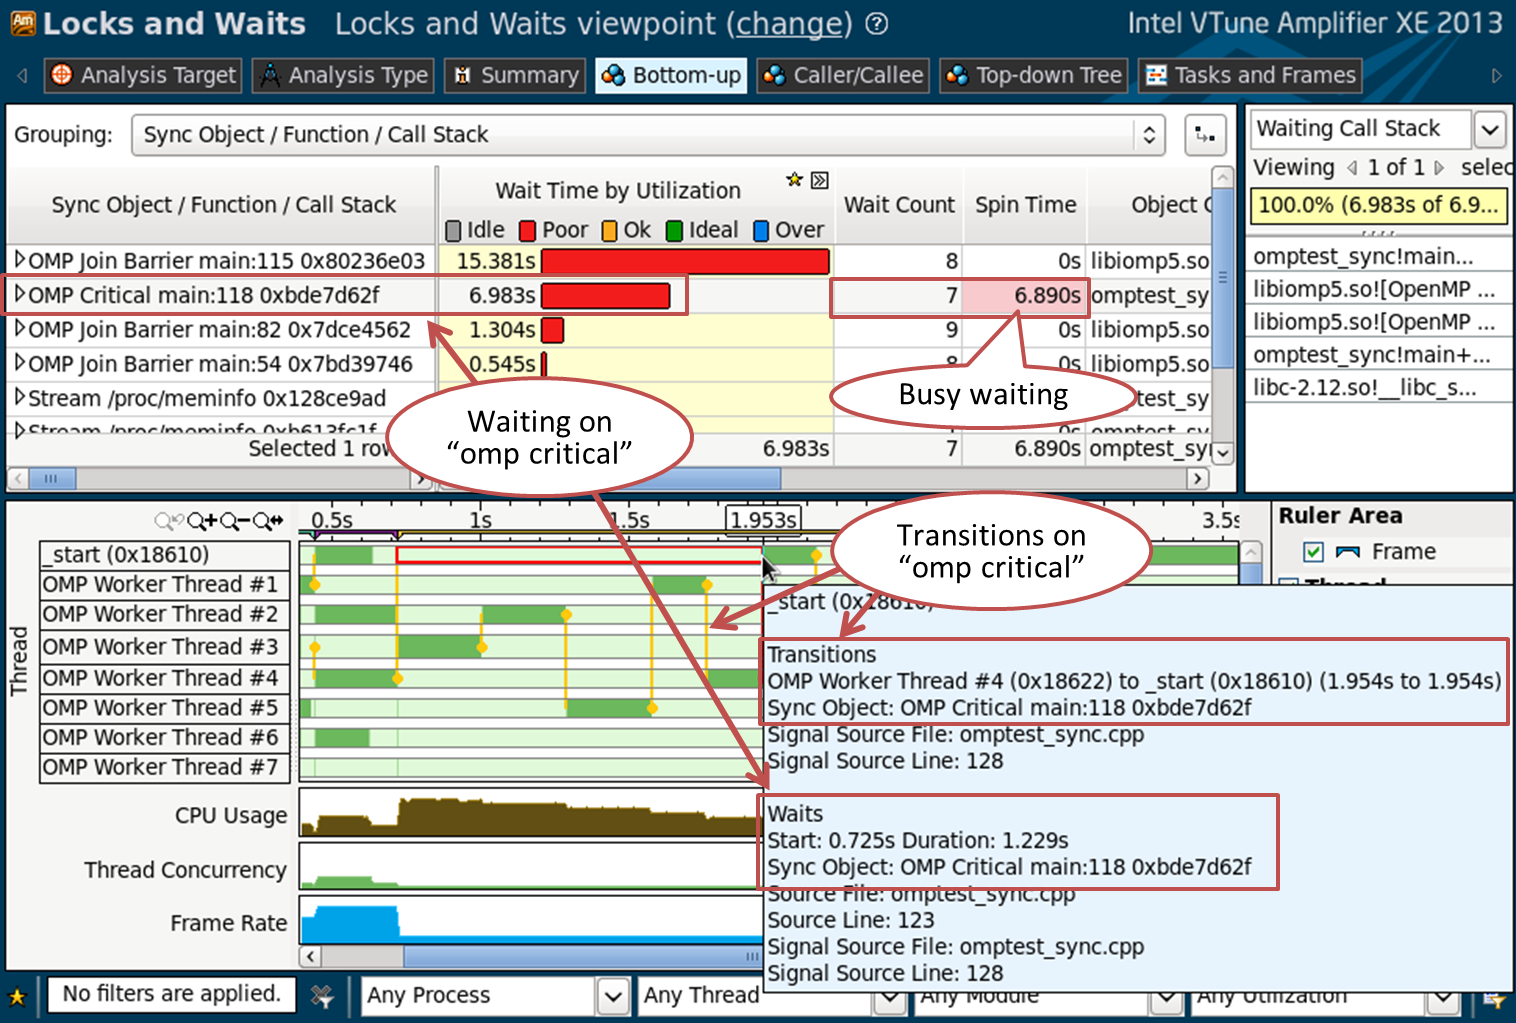
VTune Amplifier XE can recognize OpenMP synchronization primitives, such as the omp critical construction or synchronization barriers used inside OpenMP runtime. You can see how much time is spent waiting and how it is distributed: many expectations of short duration, or several long expectations. VTune Amplifier XE shows if the thread waited actively (spin waiting), or really went into a wait state. The timeline gives a picture of transitions of management (transitions) - vertical yellow lines. From them you can understand which threads intercepted the synchronization object, how often, what kind of object it was, how long they waited, and so on.
The code on line 118:
#pragma omp parallel for schedule(static,1) for (int index = 0 ; index < oloops ; index++) { #pragma omp critical (my_sync) // line 118 { double *a, *b, *c, *at ; int ick ; a = ga + index*84 ; c = gc + index*84 ; fillmat (a) ; ick = work (a, c,gmask) ; if (ick > 0) { printf("error ick failed\n") ; exit(1) ; } } } Summary
Intel VTune Amplifier XE gives you the opportunity to look deep inside the OpenMP application. You can evaluate the balance of sequential and parallel code, and how the program behaves in each parallel region. Intel VTune Amplifier XE can help you find problems with load balancing between OpenMP threads, problems with granularity, estimate overhead, and understand the timing pattern. Linking detailed CPU usage statistics to a specific OpenMP region will allow you to better understand the behavior of your application. You can get the most detailed information using Intel OpenMP runtime, but profiling of other implementations is also possible (GCC and Microsoft OpenMP).
Source: https://habr.com/ru/post/204058/
All Articles