Experience using the logman utility to collect application performance metrics on Windows
Introduction
Good day!
In my first post, I would like to share my experience using a utility such as logman , with which you can collect information on resource consumption (and not only) by a Windows application.
One day at work, the task was to remove performance metrics for a single Windows application. The main condition was to use at a minimum any third-party utilities, and since I didn’t have experience with such things at that time, after a little digging, the choice fell on logman. Special accuracy was not required and it was necessary only to understand the nature of resource consumption by the application, for which logman at first glance was quite appropriate.
')
So, let's go directly to the essence of the post.
What is logman?
Many of you, most likely at work or at home, used the native Windows performance monitor (perfmon) utility. So logman is roughly a command line representation of a perfmon. It allows you to create, start, stop performance counters, write the result to external files and much more. I only needed the basic functionality, which I will describe below.
Basic operations
A small note: to perform the following operations, you must have administrator rights, otherwise such an error may take off.
: . , . View created and running counters
You can view the list of data collectors with the
logman commandAs a result, approximately the following conclusion will be obtained:
------------------------------------------------------------------------------- cpu . Creating a performance counter
To create a counter, I used the following command (for a complete list of options, see the official documentation .):
logman create counter "counter_name" -f csv -si "interval" --v -o "output_file" -c counter - counter_name is the name of the counter. It can be any, for example "explorer_cpu"
- -f - file format with measurement results
- --v - this option suppresses the output of the version in the output file
- -si is an interval. with which measurements will be recorded
- -o - file with measurement results
- -c - performance counter id
Let us dwell on the last option. To understand what to enter in the “counter” field, you can proceed in perfmon, create a group of data collectors and select “Create -> Data collector”. Then select “Add counter” and in the appeared window find the type of counter that interests us.
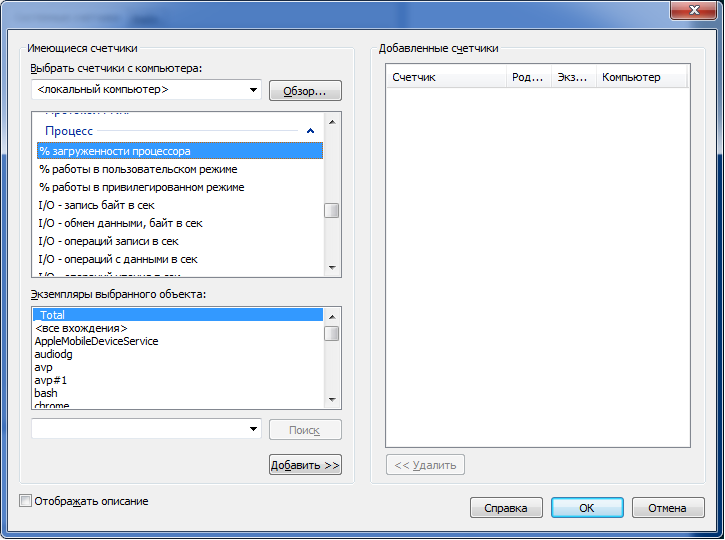
I was interested in cpu and memory consumption by a specific process, so I used the following counters for measurements (the following post helped me in calculating the CPU):
- "\ Processor (_Total) \% User time" - the percentage of CPU in user mode
- "\ Process (application_name) \% Processor time" - the CPU share of the application from the user mode
- "\ Process (application_name) \ Working Set" - the use of RAM by the process
The percentage of CPU consumption by a process can be calculated as ("\ Processor (_Total) \% User time" * "\ Process (application_name) \% Processor time") / (number of processors * 100)
Counters can be written with a space, then in the output file the values will be each in its own column.
As a result, I will give an example of a ready-made command for creating a counter:
logman create counter "explorer-cpu.usage" -f csv -si 1 --v -o "d:\logman-test\raw\explorer-cpu.usage.csv" -c "\Processor(_Total)\% User time" "\Process(explorer)\% Processor time" Start and stop the counter
Executed by the appropriate commands:
logman start "counter_name" logman stop "counter_name" Delete counter
You can delete the counter with the following command (it must be stopped before this):
logman delete "counter_name" Python wrapper
Before turning to the code, I would like to talk about a small (although for me it became quite substantial) problem that arose during the collection of metrics.
Since it was supposed to collect data for a rather short period of time (5-15 seconds), it became clear that the collection interval of 1 s (set via the "-si" option) is too large. Searching on the Internet and in the office. documentation, I could not find a way to reduce this interval, and I really wanted to increase the number of points on the graph. After some thought, I decided to go on the contrary - if the interval cannot be reduced, then the number of counters can be increased. Thus, by running several collectors in a row with an interval of 100-500 milliseconds, you can get as much data as you need in one second.
The data collection process had to be integrated into the existing automated test and in the end a small auxiliary wrapper was written to perform all the above actions.
Below is the source code of the module that collects data on the CPU and RAM for the specified application with the required accuracy.
pylogman.py
import os import logging import random import time import subprocess import glob import multiprocessing CPU_USER_COUNTER = '"\Processor(_Total)\% User time"' CPU_APP_COUNTER = '"\Process({app})\% Processor time"' MEMORY_COUNTER = '"\Process({app})\Working Set"' APP_PLACEHOLDER = '{app}' class PerflogManager(object): def __init__(self, app_name, precision, results_dir, max_mem=1, interval=1): """ Args: app_name: name of the application without "exe" extention precision: amount of results_dir: output folder max_mem: this value is used to calculate % from total avaliable memory for further plotting interval: interval which will be used as "-si" logman option value """ self._app_name = app_name self._precision = precision self._counters = { 'cpu.usage': '{cpu_user} {cpu_app}'.format(cpu_user=CPU_USER_COUNTER, cpu_app=CPU_APP_COUNTER).replace(APP_PLACEHOLDER, app_name), 'mem.usage': MEMORY_COUNTER.replace(APP_PLACEHOLDER, app_name) } self._results_dir = os.path.normpath(results_dir) self._raw_dir = os.path.join(self._results_dir, 'raw') self._final_dir = os.path.join(self._results_dir, 'csv') self._interval = interval self._max_mem = max_mem self._collectors = [] if not os.path.exists(self._results_dir): os.makedirs(self._results_dir) os.makedirs(self._raw_dir) os.makedirs(self._final_dir) logging.info('Directory "{path}" for logman results has been created.'.format(path=self._results_dir)) logging.info('Performance logman manager has been created for "{}" application.'.format(self._app_name)) def init_collectors(self): """ Creates collectors by "logman create" command """ logging.info('Creating collectors set...') for lang in self._counters: for idx in range(self._precision): collector = '{app}-{collector}-{id}'.format(app=self._app_name, collector=lang, id=idx) output = os.path.join(self._raw_dir, collector + '.csv') self.__create(collector, self._counters[lang], output) self._collectors.append(collector) def start_all(self): """ Starts all the collectors from self._collectors list """ for collector in self._collectors: self.__start(collector) time.sleep(random.uniform(0.1, 0.9)) def stop_all(self): """ Stops and deletes all initiated collectors from self._collectors list """ for collector in self._collectors: self.__stop(collector) self.__delete(collector) def cleanup(self): """ Cleans raw_dir directory which contains unprocessed csv file from logman """ logging.info('Cleaning results directory from unnecessary files.') for collector in self._collectors: csv = os.path.join(self._raw_dir, '{}.csv'.format(collector)) if os.path.isfile(csv): os.remove(csv) def process_csv(self): """ Composes and formats data from all counters for further plotting """ for lang in self._counters: final_output = os.path.join(self._final_dir, '{}.csv'.format(lang)) self.__compose_csv(final_output, lang) self.__format_data(final_output) def __compose_csv(self, output, counter): """ Concatenates gathered csv data to one file """ logging.info('Composing file "{}".'.format(output)) try: with open(output, 'a') as outfile: for csv in glob.glob(os.path.join(self._raw_dir, '*{}*'.format(counter))): with open(csv, 'r') as file: outfile.writelines(file.readlines()[1:]) # Get rid of a file header with service info logging.info('File {} successfully created.'.format(output)) except (FileNotFoundError, IOError) as e: logging.error('Failed to compose file {file}: {exception}'.format(file=output, exception=e)) def __format_data(self, file): """ Sorts data after self.__compose_csv function and calculates % of CPU and Memory """ try: with open(file, 'r') as csv: raw_data = csv.readlines() with open(file, 'w') as csv: sorted_data = [line.replace('"', '').replace(',', ';') for line in sorted(raw_data) if '" "' not in line] csv_data = [] if 'cpu' in file: for line in sorted_data: time, cpu_user, cpu_app = line.split(';') cpu = (float(cpu_user) * float(cpu_app)) / (multiprocessing.cpu_count() * 100) csv_data.append('{};{:.2f}\n'.format(time, cpu)) if 'mem' in file: for line in sorted_data: time, total_memory = line.split(';') mem = float(total_memory) / (self._max_mem * 10000) csv_data.append('{};{:.2f}\n'.format(time, mem)) csv.writelines(csv_data) except (FileNotFoundError, IOError) as e: logging.error('Failed to process file "{file}": {exception}'.format(file=file, exception=e)) def __logman(self, cmd): """ Default wrapper for logman commands Args: cmd: windows command to be executed """ try: logging.debug('Running {}'.format(cmd)) subprocess.check_call(cmd) except (subprocess.CalledProcessError, OSError) as e: logging.error('Failed to execute command "{}": {}.'.format(cmd, e)) def __create(self, name, counter, output): """ Creates logman counter Args: name: uniq name of a collector counter: type of the counter (can be taken from perfmon) output: csv file for results """ logging.info('Creating collector "{}"'.format(name)) cmd = 'logman create counter "{name}" -f csv -si {interval} ' \ '--v -o "{output}" -c {counter}'.format(name=name, interval=str(self._interval), output=output, counter=counter) self.__logman(cmd) def __start(self, name): """ Starts logman collector Args: name: uniq name of a collector """ logging.info('Starting collector "{}".'.format(name)) cmd = 'logman start {}'.format(name) self.__logman(cmd) def __stop(self, name): """ Stops logman collector Args: name: uniq name of a collector """ logging.info('Stopping collector "{}".'.format(name)) cmd = 'logman stop {}'.format(name) self.__logman(cmd) def __delete(self, name): """ Deletes logman collector Args: name: uniq name of a collector """ logging.info('Deleting collector "{}".'.format(name)) cmd = 'logman delete {}'.format(name) self.__logman(cmd) if __name__ == '__main__': logging.basicConfig(level=logging.DEBUG) app = 'skype' start_time = time.strftime('%Y%m%d-%H%M%S', time.gmtime()) logman = PerflogManager(app, 3, 'd:/logman-test/') logman.init_collectors() logman.start_all() time.sleep(20) logman.stop_all() logman.process_csv() Conclusion
In conclusion, I would like to say that logman is quite a useful utility, if it is necessary to automate the collection of performance metrics under Windows with minimal cost. In a short time I did not manage to find a more convenient way, so I will be glad to learn about other ways and approaches in solving such problems in the comments.
Source: https://habr.com/ru/post/203692/
All Articles