ServerView Operations Manager - Fujitsu Unified Server Management Point
Earlier, we briefly talked about the integrated solution Fujitsu ServerView Suite , which allows you to effectively manage the basic processes of the server life cycle that comes bundled with Fujitsu PRIMERGY servers. In this article we will try to tell in more detail about the functionality of the Fujitsu ServerView Suite, which is provided through its single point of administration - ServerView Operations Manager.
This software assumes that it is installed on a separate physical or virtual server, which is a Central Management Station (CMS). It is the CMS that stores and processes information about Fujitsu PRIMERGY servers serviced by ServerView Operations Manager (and not only). CMS can be accessed from any computer or mobile device via a web browser. This allows system administrators to effectively manage servers, even being outside the walls of the server or at a considerable distance from them.
In order to better uncover the functionality of the considered software, let's go through its main functions sequentially. After authorization, we will get to the main menu of ServerView Operations Manager , which lists all the main components of this software package:
')

Hovering the mouse over one or another menu item, to its left we will see a tooltip with a brief description of the functionality of this or that application:
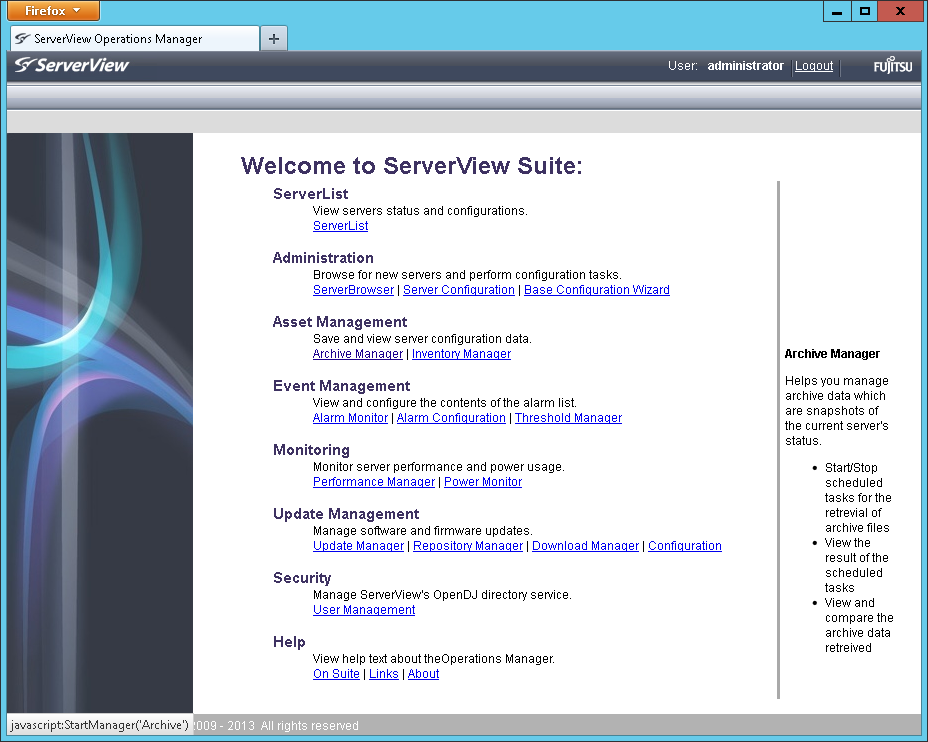
Let's try to consider each of them in more detail. So, Server List is a list of all servers managed by this CMS. In this window, we can: add or remove servers, see their current status, define server groups and distribute existing servers, view their properties.
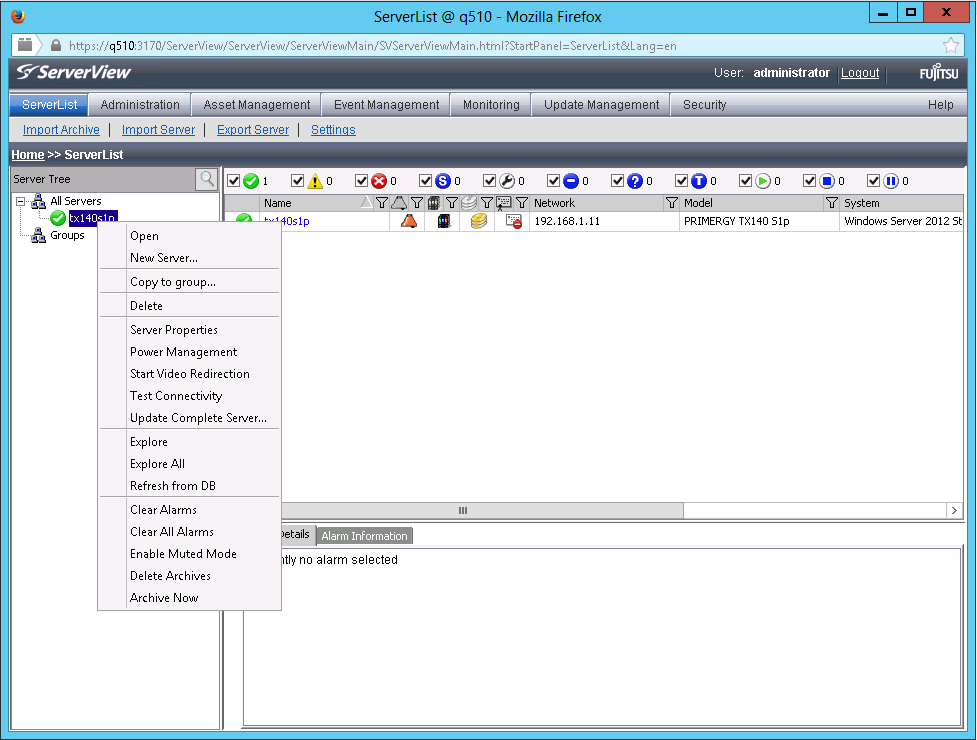
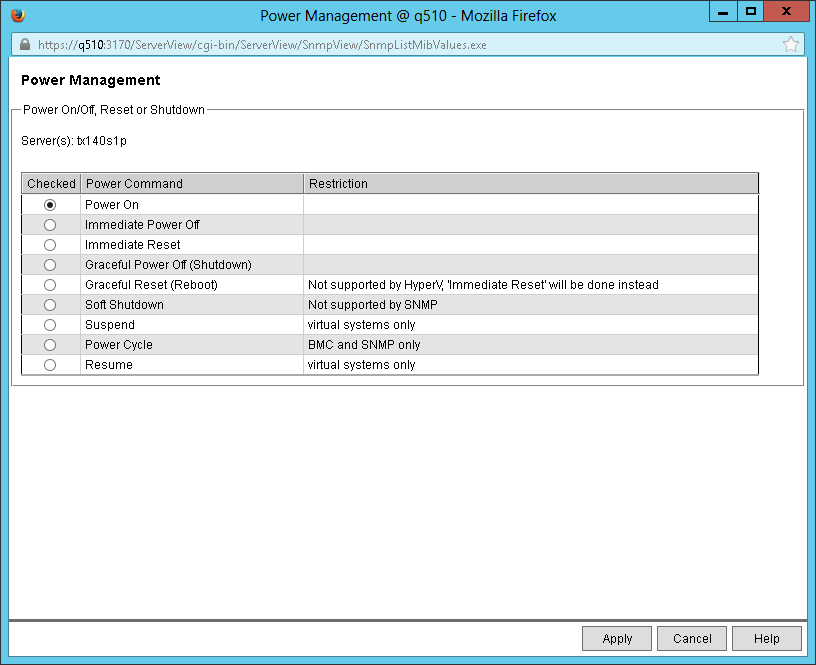
Also, right from this window, you can control the server’s power (turn it off, restart or turn it on) or check the connection to it:

In fact, the Server List is the starting point for administering Fujitsu PRIMERGY servers.
The Administration section contains applications that allow you to search for new servers, configure them, and define users. Moreover, the setting is possible both through individual setting of various parameters, and fast through the Configuration Wizard.
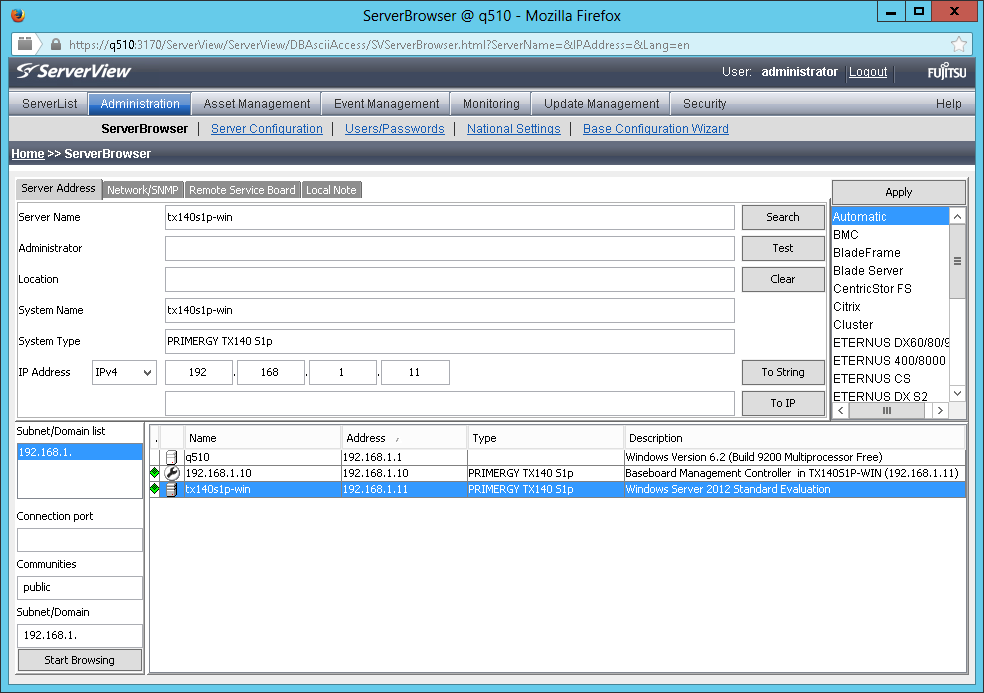
In particular, you can configure the server to turn on and turn off the server on schedule, determine its behavior after the temperature sensor trips or the fan is turned off. Configure tracking of server boot success or its operating system hang. For example, you can force the server to shut down forcibly if the processor overheats or the ambient temperature exceeds the maximum allowed. Here you can also configure the integrated Remote Management Controller (iRMC) settings: define network settings, authorization, activate additional functionality keys, configure error notifications via SNMP or Email.

The next group of Asset Management applications contains two applications that can be very demanded for accounting servers, as well as, for example, in identifying the causes of a malfunction. The first application is called Archive Manager .
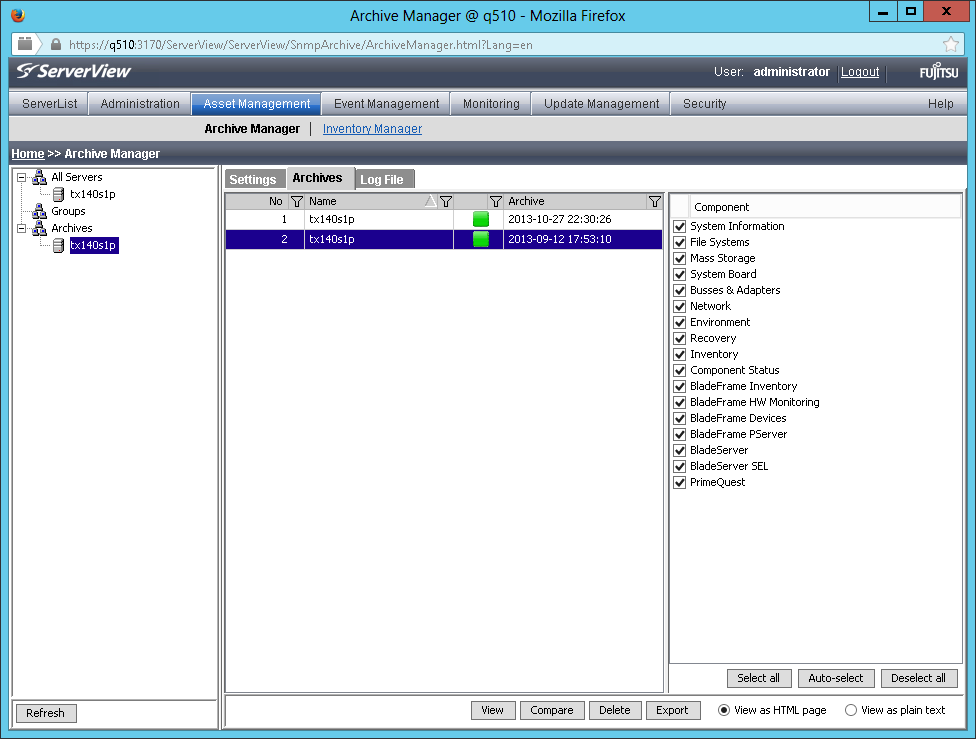
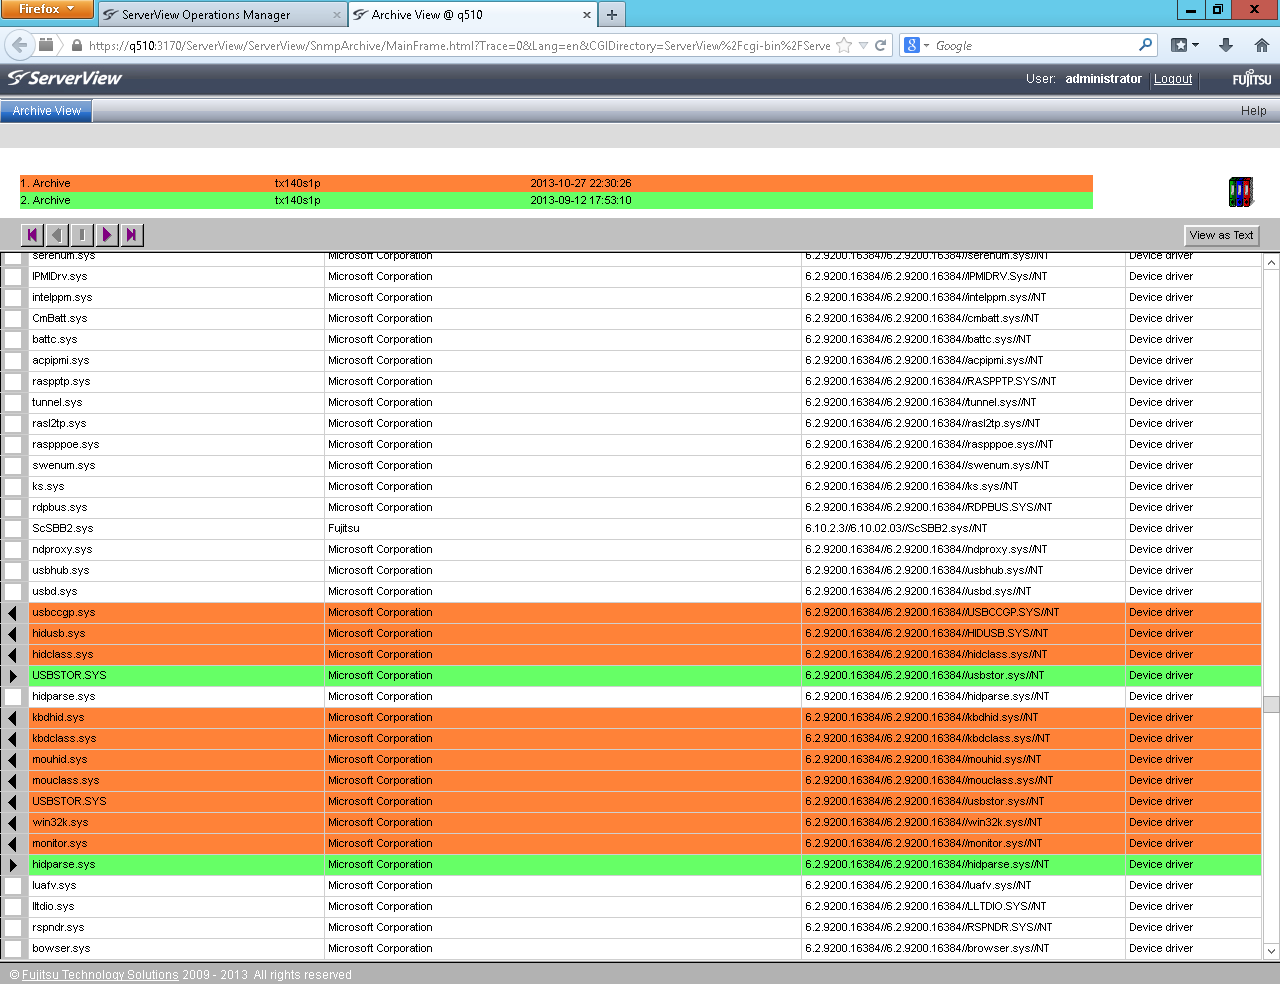
It allows you to create archives with information about servers and manage them. These archives include all possible server information: about hardware components, storage system, sensor readings, firmware versions, system event logs, information about the operating system and drivers. Archive Manager has convenient archive comparison functionality and allows you to track changes that occur in the system over time.
The following application - ServerView Inventory Manage - allows you to create collections with information about servers and store them in a ServerView database. This data may include inventory data, information about all hardware components of the servers, including firmware versions, energy consumption data, and temperature sensor readings. Based on the collected data, you can create reports that allow you to assess the status of the system. For example, identify the servers on which you want to perform firmware updates.
One of the most important sections of ServerView Operations Manager is Event Management, which allows you to monitor various events occurring with the server and filter them:
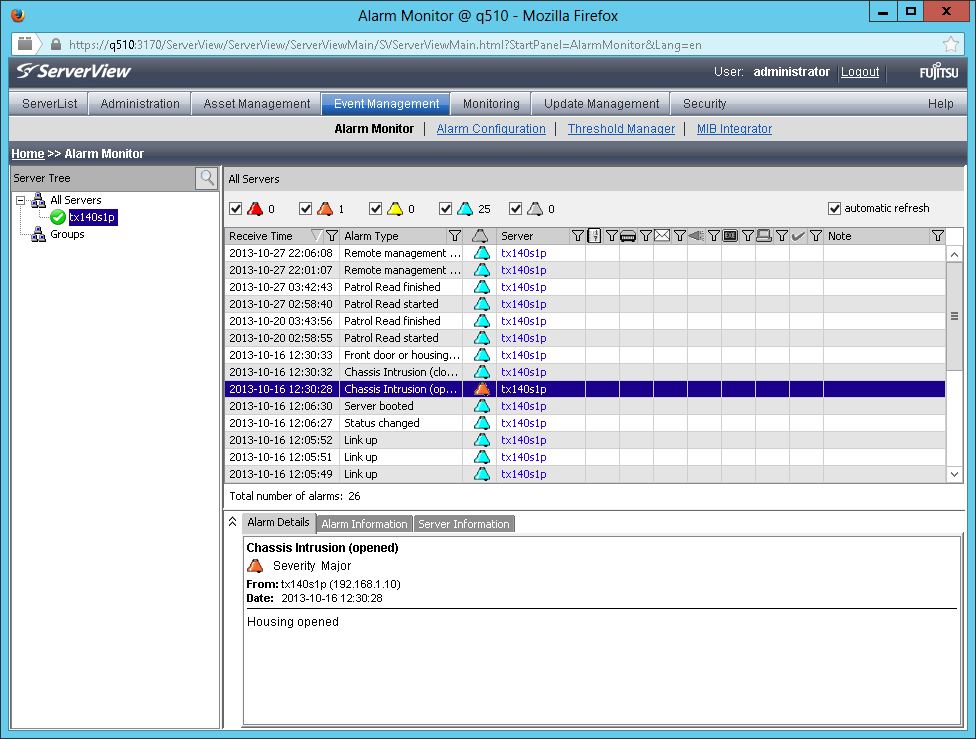
In addition, it is possible to independently configure the thresholds at which the values of the sensor readings will be considered critical or important.
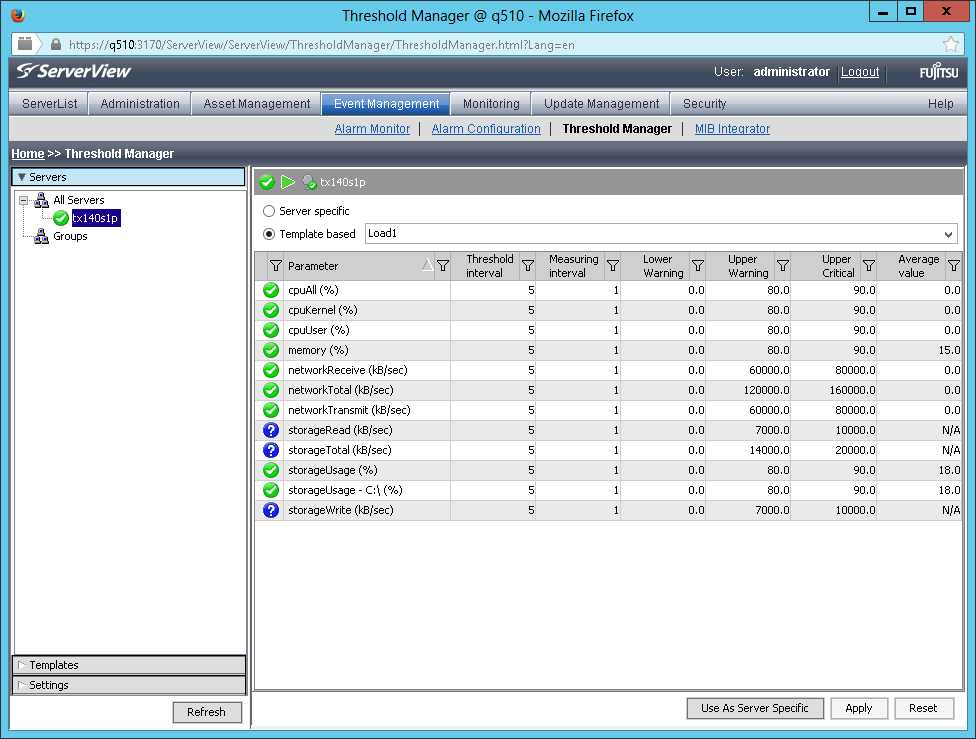
All this, together with the ability to customize the sending of error notifications via SNMP or Email, allows you to ensure that the system administrator or another responsible employee is promptly informed about the occurrence of a problem.
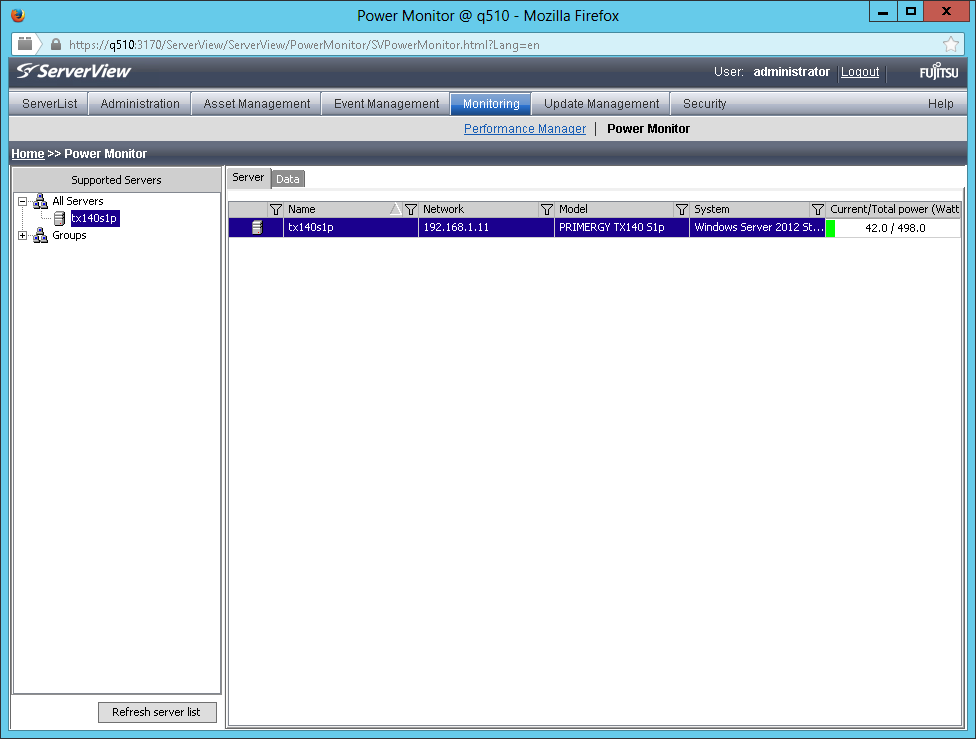
The following two Performance Manager and Power Monito applications are grouped into the Monitoring group. And, as its name implies, they provide monitoring of the performance and power consumption of servers, respectively.
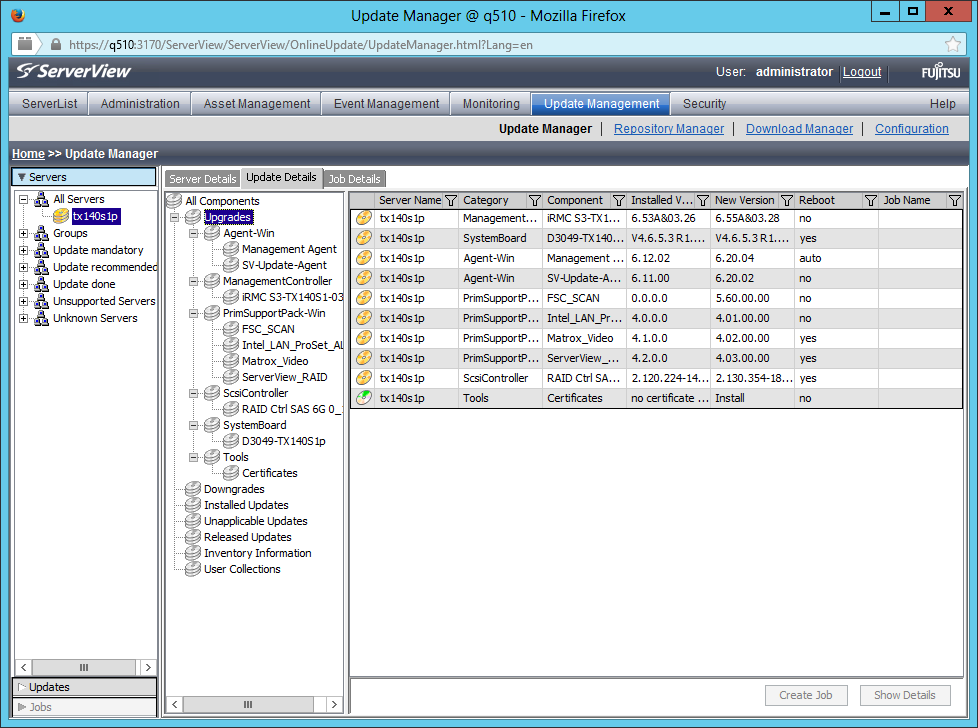
The Update Management group allows you to centrally manage firmware updates (BIOS and other firmware), ServerView drivers and agents on one specific server, and in parallel on several. At the same time, all updates can be performed on a schedule, which will allow you to plan and execute them during off-hours, minimizing losses from server downtime.
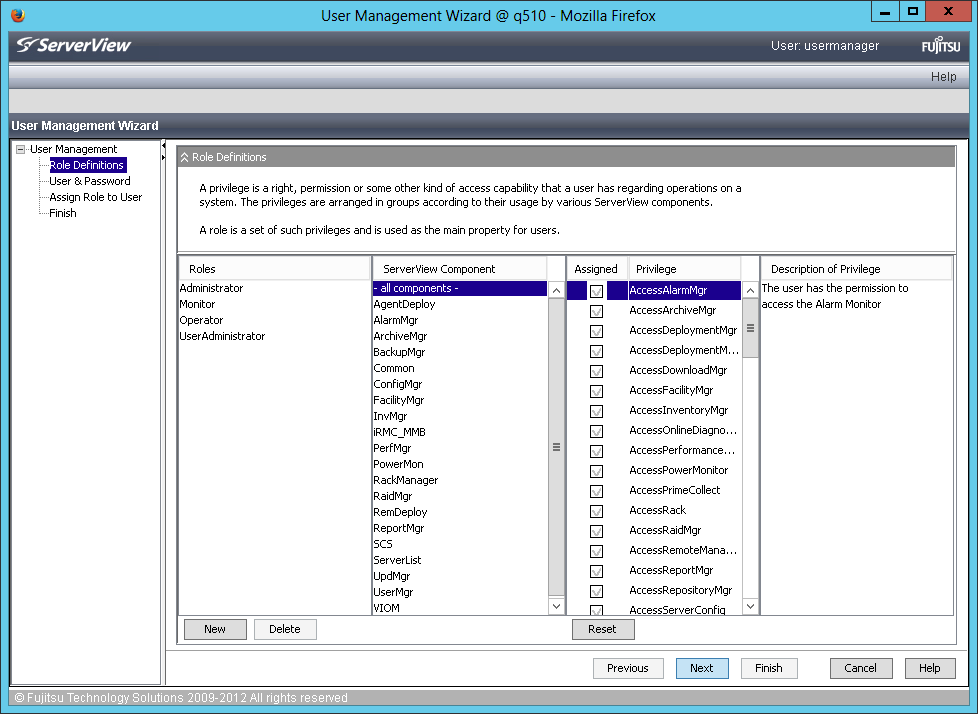
And with the help of ServerView User Management, you can flexibly configure the roles of users of Fujitsu ServerView software.
All of the above actually allows the system administrator to work not with a single server, but with all or their group at once, which saves significant time for performing routine operations. But besides this, if we are in the Server List window, which was described almost at the very beginning, by clicking on the server of interest to us, we can switch to the Single System View mode, which allows you to review the entire server functionality from a single window.
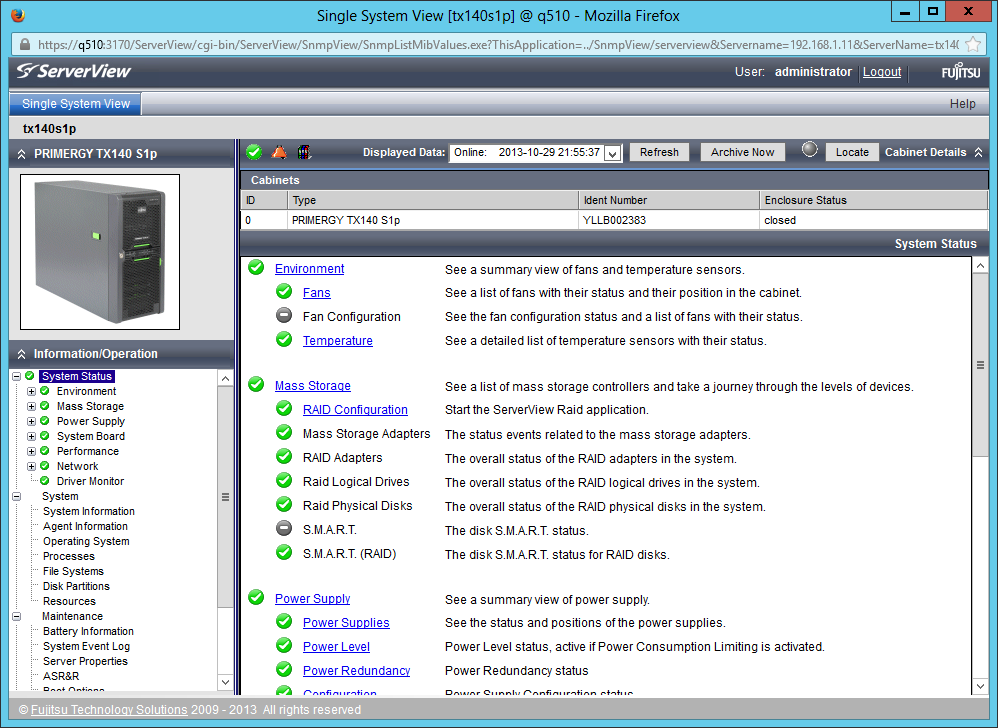
In fact, here we can get all the information about one particular selected server. Moreover, the methods used for detailing this information allow you to more quickly navigate the problems and troubleshoot. So, for example, wanting to get information about the fans, we will see the following window:
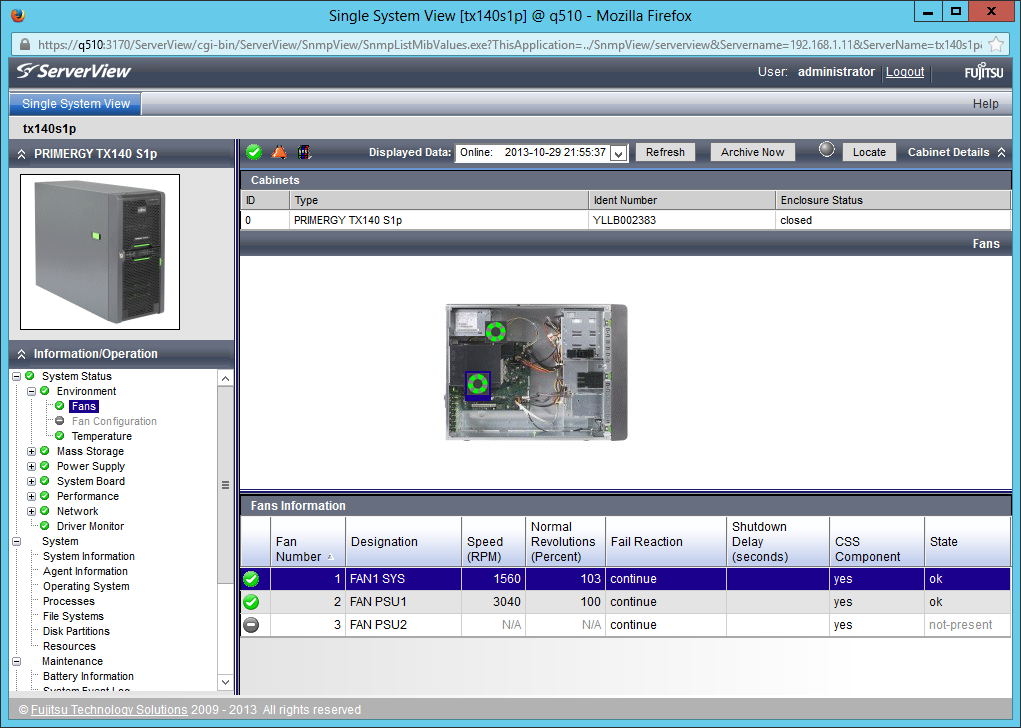
In this case, the fan selected by us will also stand out in the diagram above. Thus, if suddenly one of the fans fails, we will even be able to find out which one needs replacing before we open the server cover.
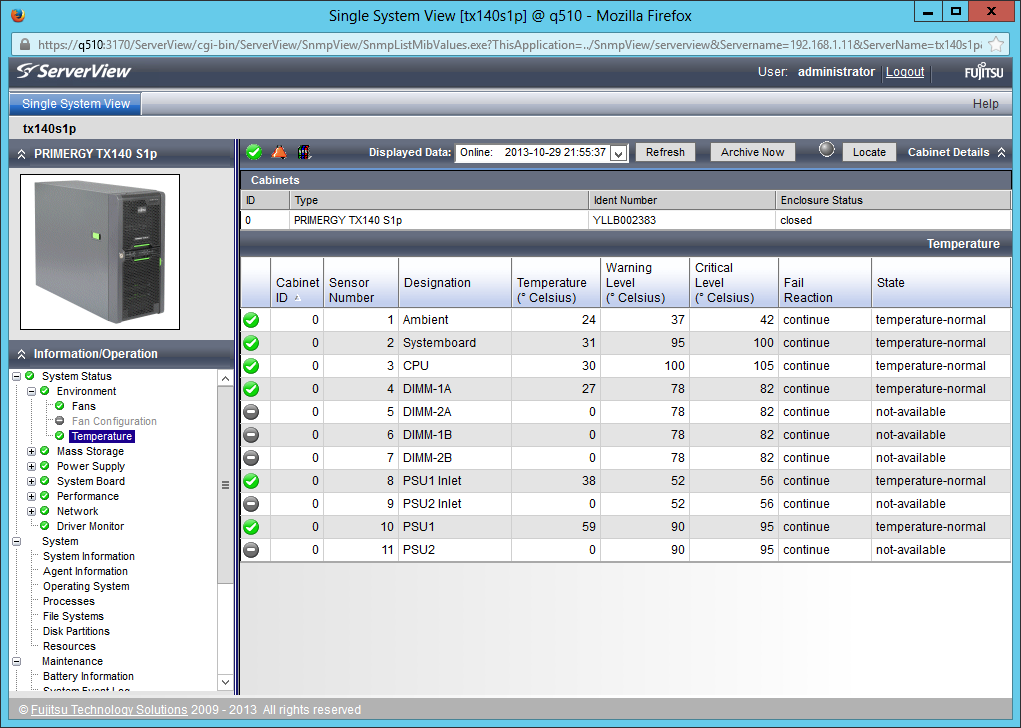
The ServerView Single System View interface allows you to conveniently and quickly obtain information from any system sensors, such as temperature sensors, voltage sensors, or fan speed sensors:
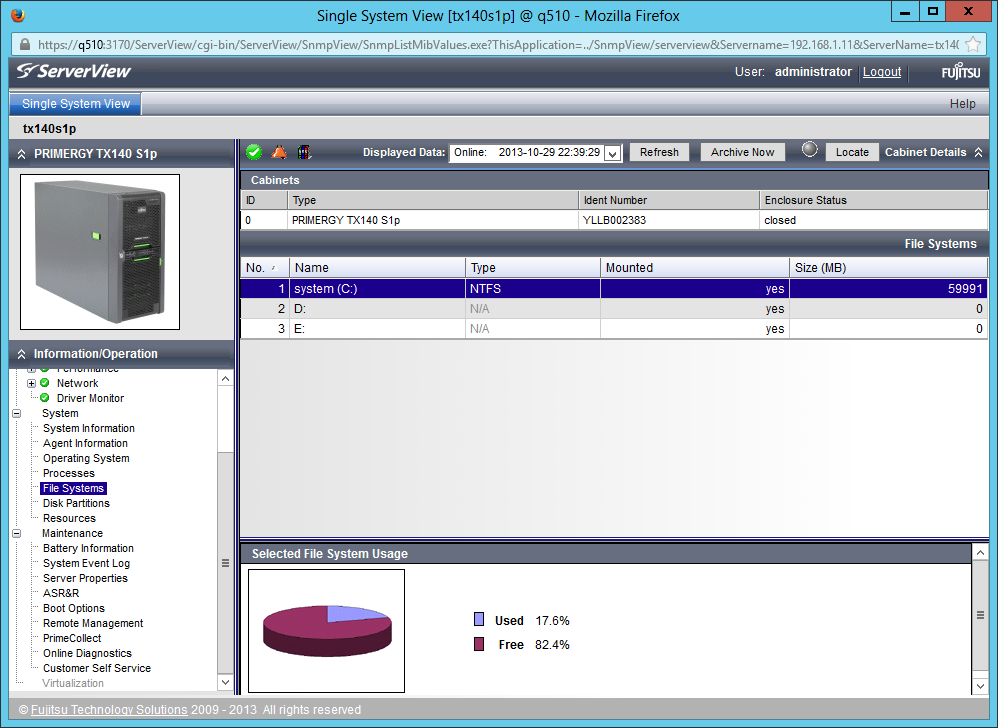
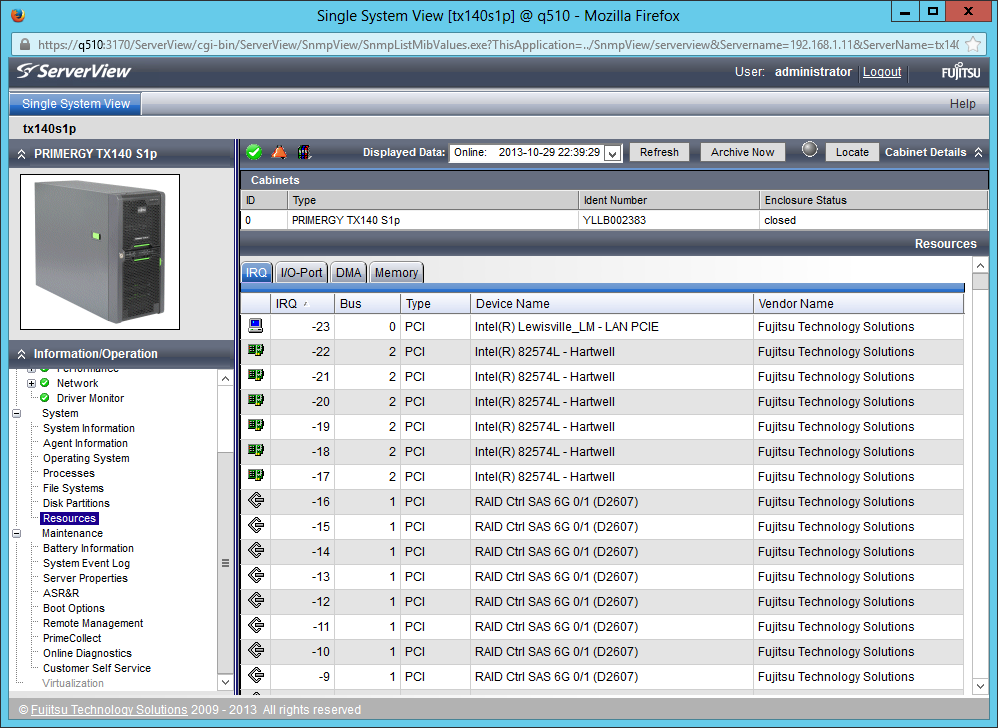
It is also easy to view information about the file system and disk subsystem of the server of interest to us or its system resources:
Thus, Single System View allows you to get detailed information about all PC hardware components, including their firmware versions, information about network connections, including their addresses, retrieve data from the server's system event log, and much more.
The purpose of this article was not to provide detailed guidance about ServerView Operations Manager, but to tell about its functionality, and about that, which does not require any additional activation keys, but is available in the basic version, which is supplied free of charge with Fujitsu servers. We hope that we succeeded, but for those who need a detailed ServerView manual, we recommend that you refer to the Help section in ServerView Operations Manager or to the official Fujitsu support site: support.ts.fujitsu.com/Manuals (in the form on this page, select Software and ServerView).
And finally, an important point: we understand that our customers can use third-party monitoring systems (both from server manufacturers, such as HP SIM, and independent solutions, such as Microsoft System Center), and offer tools to integrate into these solutions, completely free of charge. The list of systems supported by us is quite wide, and includes open source products:
Thus, it is possible to control from one point both Fujitsu servers and solutions from other manufacturers.
This software assumes that it is installed on a separate physical or virtual server, which is a Central Management Station (CMS). It is the CMS that stores and processes information about Fujitsu PRIMERGY servers serviced by ServerView Operations Manager (and not only). CMS can be accessed from any computer or mobile device via a web browser. This allows system administrators to effectively manage servers, even being outside the walls of the server or at a considerable distance from them.
In order to better uncover the functionality of the considered software, let's go through its main functions sequentially. After authorization, we will get to the main menu of ServerView Operations Manager , which lists all the main components of this software package:
')
Hovering the mouse over one or another menu item, to its left we will see a tooltip with a brief description of the functionality of this or that application:
Let's try to consider each of them in more detail. So, Server List is a list of all servers managed by this CMS. In this window, we can: add or remove servers, see their current status, define server groups and distribute existing servers, view their properties.
Also, right from this window, you can control the server’s power (turn it off, restart or turn it on) or check the connection to it:
In fact, the Server List is the starting point for administering Fujitsu PRIMERGY servers.
The Administration section contains applications that allow you to search for new servers, configure them, and define users. Moreover, the setting is possible both through individual setting of various parameters, and fast through the Configuration Wizard.
In particular, you can configure the server to turn on and turn off the server on schedule, determine its behavior after the temperature sensor trips or the fan is turned off. Configure tracking of server boot success or its operating system hang. For example, you can force the server to shut down forcibly if the processor overheats or the ambient temperature exceeds the maximum allowed. Here you can also configure the integrated Remote Management Controller (iRMC) settings: define network settings, authorization, activate additional functionality keys, configure error notifications via SNMP or Email.
The next group of Asset Management applications contains two applications that can be very demanded for accounting servers, as well as, for example, in identifying the causes of a malfunction. The first application is called Archive Manager .
It allows you to create archives with information about servers and manage them. These archives include all possible server information: about hardware components, storage system, sensor readings, firmware versions, system event logs, information about the operating system and drivers. Archive Manager has convenient archive comparison functionality and allows you to track changes that occur in the system over time.
The following application - ServerView Inventory Manage - allows you to create collections with information about servers and store them in a ServerView database. This data may include inventory data, information about all hardware components of the servers, including firmware versions, energy consumption data, and temperature sensor readings. Based on the collected data, you can create reports that allow you to assess the status of the system. For example, identify the servers on which you want to perform firmware updates.
One of the most important sections of ServerView Operations Manager is Event Management, which allows you to monitor various events occurring with the server and filter them:
In addition, it is possible to independently configure the thresholds at which the values of the sensor readings will be considered critical or important.
All this, together with the ability to customize the sending of error notifications via SNMP or Email, allows you to ensure that the system administrator or another responsible employee is promptly informed about the occurrence of a problem.
The following two Performance Manager and Power Monito applications are grouped into the Monitoring group. And, as its name implies, they provide monitoring of the performance and power consumption of servers, respectively.
The Update Management group allows you to centrally manage firmware updates (BIOS and other firmware), ServerView drivers and agents on one specific server, and in parallel on several. At the same time, all updates can be performed on a schedule, which will allow you to plan and execute them during off-hours, minimizing losses from server downtime.
And with the help of ServerView User Management, you can flexibly configure the roles of users of Fujitsu ServerView software.
All of the above actually allows the system administrator to work not with a single server, but with all or their group at once, which saves significant time for performing routine operations. But besides this, if we are in the Server List window, which was described almost at the very beginning, by clicking on the server of interest to us, we can switch to the Single System View mode, which allows you to review the entire server functionality from a single window.
In fact, here we can get all the information about one particular selected server. Moreover, the methods used for detailing this information allow you to more quickly navigate the problems and troubleshoot. So, for example, wanting to get information about the fans, we will see the following window:
In this case, the fan selected by us will also stand out in the diagram above. Thus, if suddenly one of the fans fails, we will even be able to find out which one needs replacing before we open the server cover.
The ServerView Single System View interface allows you to conveniently and quickly obtain information from any system sensors, such as temperature sensors, voltage sensors, or fan speed sensors:
It is also easy to view information about the file system and disk subsystem of the server of interest to us or its system resources:
Thus, Single System View allows you to get detailed information about all PC hardware components, including their firmware versions, information about network connections, including their addresses, retrieve data from the server's system event log, and much more.
The purpose of this article was not to provide detailed guidance about ServerView Operations Manager, but to tell about its functionality, and about that, which does not require any additional activation keys, but is available in the basic version, which is supplied free of charge with Fujitsu servers. We hope that we succeeded, but for those who need a detailed ServerView manual, we recommend that you refer to the Help section in ServerView Operations Manager or to the official Fujitsu support site: support.ts.fujitsu.com/Manuals (in the form on this page, select Software and ServerView).
And finally, an important point: we understand that our customers can use third-party monitoring systems (both from server manufacturers, such as HP SIM, and independent solutions, such as Microsoft System Center), and offer tools to integrate into these solutions, completely free of charge. The list of systems supported by us is quite wide, and includes open source products:
- Nagios,
- Icinga,
- Microsoft SCM,
- Microsoft SCE,
- Microsoft SC PRO,
- VMware vCenter,
- HP Operations Manager,
- HP Systems Insight Manager,
- IBM Tivoli,
- Altiris Deployment Server
- CA Unicenter
- CA Spectrum
Thus, it is possible to control from one point both Fujitsu servers and solutions from other manufacturers.
Source: https://habr.com/ru/post/203008/
All Articles