Profiling and debugging Python tools
In the previous article, we learned in practice, where and in what cases you can use manual profiling, as well as met with statistical profilers.
Today we will get acquainted with the main and most numerous group of tools - event profilers.
')
In the last article we analyzed problem 3 from the Euler Project . For a change, let's take some other example, for example, task 7 from the same collection of tasks:
Write the code:
Remember that the code is not perfect, and many things can be done easier, better, faster. This is the purpose of this article =)
In the last article I was embarrassed and did not do the most important thing: tests. In fact, breaking a program in the process of refactoring or optimizing is easier than ever, and each cycle of profiling and rewriting the code must necessarily be accompanied by testing functionality (both directly affected by changes and everything else, because side effects are side effects). Let's try to fix it and add tests to our program. The easiest and most suitable option for such a simple script is to use the doctest module. Add tests and run them:
Let's see how fast we got the code:
Yes, not fast, there is something to optimize =)
The standard Python libraries are amazing. In them, it seems, there is everything that a developer may need, and profilers are no exception. In fact, there are three of them out of the box:
What talk about python profiling goes without a description of cProfile - one of the standard Python modules?
I’m sure every Python programmer ever tried to run cProfile:
Immediately notice the difference in program execution time: without profiler: 1.27 seconds, with profiler: 1.55 seconds, that is, 20% slower in our particular case. And this is a very good result!
So, we see that the longest (in total time) operation is the is_prime function. Almost all the time the program spends in this function. The next most serious call is the range function, which is called from the is_prime function. We read the documentation and understand that when you call range, a list is created in memory with all the numbers in the specified range. Taking into account the fact that the range function is called 104741 times, and the upper limit of the range is incremented with each call (iterating over numbers), it can be concluded that the list created by the range function reaches hundreds of thousands of elements by the end of the program and the list is more than one hundred thousand time. Having read the documentation, we learn that we should use the xrange function in this cycle (an attentive reader should feel the sarcasm in this place, because any Pythonist knows about range VS xrange). The advantage of replacing range with xrange will also be an obvious saving of memory (we will check this theory later). Replace, run tests: everything is OK, run profiler:
1.010 seconds instead of 1.552, that is, one and a half times faster! Fine. Now the bottleneck in the program is the is_prime function itself. We optimize it later using other tools.
It is not always convenient to display profiling results in the console; it is much more convenient to save them to a file for further analysis. To do this, you can use the key "-o":
or you can use the simplest decorator:
And then each time the foo function is called, the file with the results of profiling will be saved (“get_prime_numbers.prof” in our case).
hotshot is another standard Python module, currently not supported and can be removed from the standard libraries at any time. But while it is, you can use it, because it is very fast and gives a minimum overhead when you start the program under the profiler. Using it is very simple:
Or in the form of a decorator:
It is rare when it turns out to display the results of profiling on the screen immediately after starting the program And there is little sense in such results: only the simplest scripts can be studied. To view and analyze data, it is better to use the pstats module built into Python (more convenient in combination with the excellent iPython console):
The console, of course, is a good thing, but not very visual. In especially difficult situations, in programs with hundreds and thousands of challenges, analysis of the results is difficult. So people are arranged, that we (much like computers) take graphic information much easier than text information. Various tools for analyzing profiling results come to the rescue.
To begin, perhaps, with such a well-known tool, like kcachegrind , which, in fact, is intended to visualize the results of the Callgrind utility, but after converting the results of the Python-profiler, you can open them in kcachegrind. Conversion is performed using the pyprof2calltree utility:
You can immediately open the results in kcachegrind, without saving to the file:
The program allows you to visually see how long a particular call takes, as well as all the calls within it. You can also see the call tree and a bunch of other useful information. The interface looks like this:

Another program for visualization of the profiling results of RunSnakeRun was originally written to work with the profiler of python (this is evident from its name). It is similar to kcachegrind, but, as the authors say, stands out with its simpler interface and functionality. Installation will not cause difficulties:
Use too:
Similarly, we see a map of squares: the larger the area of the square, the longer it took to perform the corresponding function:
RunSnakeRun also allows you to visualize the result of profiling memory consumption using the Meliae utility:
The gprof2dot utility generates a picture with the function call tree and information about the time of their execution. In most cases, this is enough to find bottlenecks in the program. We set and generate a picture:
Result:
For Django profiling, it is convenient to use the django-extensions module, which, in addition to a heap of various useful things, has a useful “runprofileserver” command. Using it is easy. We put:
Add application in settings.py:
Run:
In the / tmp / prof / directory, a file will be created with the profiling results for each request to the application:
Further analysis can be performed using any of the tools listed above: pstats, kcachegrind, RunSnakeRun or gprof2dot. Or any other =)
In addition to the profiler built into Python, there are also a lot of third-party programs, simple and complex, not very useful.
pycallgraph allows you to build a Python call tree. We put:
Run and see the result:
line_profiler , as its name implies, allows you to line up the necessary sections of code line by line. We put:
Add the “profile” decorator to the right places (I temporarily removed the dockstrings for a more compact display of the results):
We start profiling:
Immediately, we notice a huge overhead projector: the program has been running for more than 30 seconds, despite the fact that without a profiler, it performs faster in less than a second.
Analyzing the results we can conclude that the program spends the most time in lines 9 and 10, checking the number divisors to determine its “simplicity”. And for each subsequent number all the same checks take place. Logical optimization of the program is to check as divisors only those numbers that were previously defined as simple:
We run the tests, we make sure that everything works out correctly, we measure the program execution time:
We accelerated the work almost three times, not bad. Run the profiling one more time:
As you can see, the program began to run much faster.
For memory profiling, you can use memory_profiler . Using it is as easy as line_profiler. We put:
Run:
As you can see, we have no special problems with memory. Everything is within normal limits.
I will list a few more tools for profiling, unfortunately, the article turned out to be huge and it is not possible to disassemble all of them.
We learned about tools for profiling Python code. A lot of them are left behind the scenes, I hope my colleagues will complement me in the comments.
In the next article, we will introduce methods and tools for debugging Python programs. Stay in touch!
Minute of statistics: in three articles about python profiling I used the word “profiling” more than a hundred times.
Today we will get acquainted with the main and most numerous group of tools - event profilers.
- Introduction and theory - why do you need profiling, different approaches, tools and differences between them?
- Manual and statistical profiling - go to practice
- Event Profiling - tools and their use
- Debugging - what to do when nothing works
')
Task for training
In the last article we analyzed problem 3 from the Euler Project . For a change, let's take some other example, for example, task 7 from the same collection of tasks:
Writing out the first six prime numbers, we get 2, 3, 5, 7, 11, and 13. Obviously, the 6th prime is 13.
What is the 10001st prime number?
Write the code:
"""Project Euler problem 7 solve""" from __future__ import print_function import math import sys def is_prime(num): """Checks if num is prime number""" for i in range(2, int(math.sqrt(num)) + 1): if num % i == 0: return False return True def get_prime_numbers(count): """Get 'count' prime numbers""" prime_numbers = [2] next_number = 3 while len(prime_numbers) < count: if is_prime(next_number): prime_numbers.append(next_number) next_number += 1 return prime_numbers if __name__ == '__main__': try: count = int(sys.argv[1]) except (TypeError, ValueError, IndexError): sys.exit("Usage: euler_7.py number") if count < 1: sys.exit("Error: number must be greater than zero") prime_numbers = get_prime_numbers(count) print("Answer: %d" % prime_numbers[-1]) Remember that the code is not perfect, and many things can be done easier, better, faster. This is the purpose of this article =)
In the last article I was embarrassed and did not do the most important thing: tests. In fact, breaking a program in the process of refactoring or optimizing is easier than ever, and each cycle of profiling and rewriting the code must necessarily be accompanied by testing functionality (both directly affected by changes and everything else, because side effects are side effects). Let's try to fix it and add tests to our program. The easiest and most suitable option for such a simple script is to use the doctest module. Add tests and run them:
Tests
"""Project Euler problem 7 solve""" from __future__ import print_function import math import sys def is_prime(num): """ Checks if num is prime number. >>> is_prime(2) True >>> is_prime(3) True >>> is_prime(4) False >>> is_prime(5) True >>> is_prime(41) True >>> is_prime(42) False >>> is_prime(43) True """ for i in range(2, int(math.sqrt(num)) + 1): if num % i == 0: return False return True def get_prime_numbers(count): """ Get 'count' prime numbers. >>> get_prime_numbers(1) [2] >>> get_prime_numbers(2) [2, 3] >>> get_prime_numbers(3) [2, 3, 5] >>> get_prime_numbers(6) [2, 3, 5, 7, 11, 13] >>> get_prime_numbers(9) [2, 3, 5, 7, 11, 13, 17, 19, 23] >>> get_prime_numbers(19) [2, 3, 5, 7, 11, 13, 17, 19, 23, 29, 31, 37, 41, 43, 47, 53, 59, 61, 67] """ prime_numbers = [2] next_number = 3 while len(prime_numbers) < count: if is_prime(next_number): prime_numbers.append(next_number) next_number += 1 return prime_numbers if __name__ == '__main__': try: count = int(sys.argv[1]) except (TypeError, ValueError, IndexError): sys.exit("Usage: euler_7.py number") if count < 1: sys.exit("Error: number must be greater than zero") prime_numbers = get_prime_numbers(count) print("Answer: %d" % prime_numbers[-1]) Test run and result
➜ python -m doctest -v euler_7.py Trying: get_prime_numbers(1) Expecting: [2] ok Trying: get_prime_numbers(2) Expecting: [2, 3] ok Trying: get_prime_numbers(3) Expecting: [2, 3, 5] ok Trying: get_prime_numbers(6) Expecting: [2, 3, 5, 7, 11, 13] ok Trying: get_prime_numbers(9) Expecting: [2, 3, 5, 7, 11, 13, 17, 19, 23] ok Trying: get_prime_numbers(19) Expecting: [2, 3, 5, 7, 11, 13, 17, 19, 23, 29, 31, 37, 41, 43, 47, 53, 59, 61, 67] ok Trying: is_prime(2) Expecting: True ok Trying: is_prime(3) Expecting: True ok Trying: is_prime(4) Expecting: False ok Trying: is_prime(5) Expecting: True ok Trying: is_prime(41) Expecting: True ok Trying: is_prime(42) Expecting: False ok Trying: is_prime(43) Expecting: True ok 1 items had no tests: euler_7 2 items passed all tests: 6 tests in euler_7.get_prime_numbers 7 tests in euler_7.is_prime 13 tests in 3 items. 13 passed and 0 failed. Test passed. Let's see how fast we got the code:
➜ python -m timeit -n 10 -s'import euler_7' 'euler_7.get_prime_numbers(10001)' 10 loops, best of 3: 1.27 sec per loop Yes, not fast, there is something to optimize =)
Instruments
The standard Python libraries are amazing. In them, it seems, there is everything that a developer may need, and profilers are no exception. In fact, there are three of them out of the box:
- cProfile is a relatively new (since version 2.5) module written in C and therefore fast
- profile - native implementation of the profiler (written in pure python), slow, and therefore not recommended for use
- hotshot - experimental module on C, very fast, but no longer supported and can be removed from standard libraries at any time.
cProfile
What talk about python profiling goes without a description of cProfile - one of the standard Python modules?
I’m sure every Python programmer ever tried to run cProfile:
➜ python -m cProfile -s time euler_7.py 10001 428978 function calls in 1.552 seconds Ordered by: internal time ncalls tottime percall cumtime percall filename:lineno(function) 104741 0.955 0.000 1.361 0.000 euler_7.py:7(is_prime) 104741 0.367 0.000 0.367 0.000 {range} 1 0.162 0.162 1.550 1.550 euler_7.py:32(get_prime_numbers) 104741 0.039 0.000 0.039 0.000 {math.sqrt} 104742 0.024 0.000 0.024 0.000 {len} 10000 0.003 0.000 0.003 0.000 {method 'append' of 'list' objects} 1 0.001 0.001 1.552 1.552 euler_7.py:1(<module>) 1 0.000 0.000 0.000 0.000 {print} 1 0.000 0.000 0.000 0.000 __future__.py:48(<module>) 7 0.000 0.000 0.000 0.000 __future__.py:75(__init__) 1 0.000 0.000 0.000 0.000 __future__.py:74(_Feature) 1 0.000 0.000 0.000 0.000 {method 'disable' of '_lsprof.Profiler' objects} Immediately notice the difference in program execution time: without profiler: 1.27 seconds, with profiler: 1.55 seconds, that is, 20% slower in our particular case. And this is a very good result!
So, we see that the longest (in total time) operation is the is_prime function. Almost all the time the program spends in this function. The next most serious call is the range function, which is called from the is_prime function. We read the documentation and understand that when you call range, a list is created in memory with all the numbers in the specified range. Taking into account the fact that the range function is called 104741 times, and the upper limit of the range is incremented with each call (iterating over numbers), it can be concluded that the list created by the range function reaches hundreds of thousands of elements by the end of the program and the list is more than one hundred thousand time. Having read the documentation, we learn that we should use the xrange function in this cycle (an attentive reader should feel the sarcasm in this place, because any Pythonist knows about range VS xrange). The advantage of replacing range with xrange will also be an obvious saving of memory (we will check this theory later). Replace, run tests: everything is OK, run profiler:
➜ python -m cProfile -s time euler_7.py 10001 324237 function calls in 1.010 seconds Ordered by: internal time ncalls tottime percall cumtime percall filename:lineno(function) 104741 0.825 0.000 0.857 0.000 euler_7.py:7(is_prime) 1 0.127 0.127 1.009 1.009 euler_7.py:32(get_prime_numbers) 104741 0.032 0.000 0.032 0.000 {math.sqrt} 104742 0.022 0.000 0.022 0.000 {len} 10000 0.003 0.000 0.003 0.000 {method 'append' of 'list' objects} 1 0.001 0.001 1.010 1.010 euler_7.py:1(<module>) 1 0.000 0.000 0.000 0.000 {print} 1 0.000 0.000 0.000 0.000 __future__.py:48(<module>) 7 0.000 0.000 0.000 0.000 __future__.py:75(__init__) 1 0.000 0.000 0.000 0.000 __future__.py:74(_Feature) 1 0.000 0.000 0.000 0.000 {method 'disable' of '_lsprof.Profiler' objects} 1.010 seconds instead of 1.552, that is, one and a half times faster! Fine. Now the bottleneck in the program is the is_prime function itself. We optimize it later using other tools.
It is not always convenient to display profiling results in the console; it is much more convenient to save them to a file for further analysis. To do this, you can use the key "-o":
➜ python -m cProfile -o euler_7.prof euler_7.py 10001 ➜ ls euler_7.prof euler_7.py or you can use the simplest decorator:
import cProfile def profile(func): """Decorator for run function profile""" def wrapper(*args, **kwargs): profile_filename = func.__name__ + '.prof' profiler = cProfile.Profile() result = profiler.runcall(func, *args, **kwargs) profiler.dump_stats(profile_filename) return result return wrapper @profile def get_prime_numbers(count): ... And then each time the foo function is called, the file with the results of profiling will be saved (“get_prime_numbers.prof” in our case).
hotshot
hotshot is another standard Python module, currently not supported and can be removed from the standard libraries at any time. But while it is, you can use it, because it is very fast and gives a minimum overhead when you start the program under the profiler. Using it is very simple:
import hotshot prof = hotshot.Profile("profile_name.prof") prof.start() # your code goes here prof.stop() prof.close() Or in the form of a decorator:
import hotshot def profile(func): """Decorator for run function profile""" def wrapper(*args, **kwargs): profile_filename = func.__name__ + '.prof' profiler = hotshot.Profile(profile_filename) profiler.start() result = func(*args, **kwargs) profiler.stop() profiler.close() return result return wrapper @profile def get_prime_numbers(count): ... Profiling results analysis
It is rare when it turns out to display the results of profiling on the screen immediately after starting the program And there is little sense in such results: only the simplest scripts can be studied. To view and analyze data, it is better to use the pstats module built into Python (more convenient in combination with the excellent iPython console):
➜ ipython In [1]: import pstats In [2]: p = pstats.Stats('get_prime_numbers.prof') In [3]: p.sort_stats('calls').print_stats() 324226 function calls in 1.018 seconds Ordered by: call count ncalls tottime percall cumtime percall filename:lineno(function) 104742 0.023 0.000 0.023 0.000 {len} 104741 0.821 0.000 0.854 0.000 euler_7.py:19(is_prime) 104741 0.034 0.000 0.034 0.000 {math.sqrt} 10000 0.003 0.000 0.003 0.000 {method 'append' of 'list' objects} 1 0.138 0.138 1.018 1.018 euler_7.py:44(get_prime_numbers) The console, of course, is a good thing, but not very visual. In especially difficult situations, in programs with hundreds and thousands of challenges, analysis of the results is difficult. So people are arranged, that we (much like computers) take graphic information much easier than text information. Various tools for analyzing profiling results come to the rescue.
kcachegrind
To begin, perhaps, with such a well-known tool, like kcachegrind , which, in fact, is intended to visualize the results of the Callgrind utility, but after converting the results of the Python-profiler, you can open them in kcachegrind. Conversion is performed using the pyprof2calltree utility:
➜ pip install pyprof2calltree ➜ pyprof2calltree -i profile_results.prof -o profile_results.kgrind You can immediately open the results in kcachegrind, without saving to the file:
➜ pyprof2calltree -i profile_results.prof -k The program allows you to visually see how long a particular call takes, as well as all the calls within it. You can also see the call tree and a bunch of other useful information. The interface looks like this:
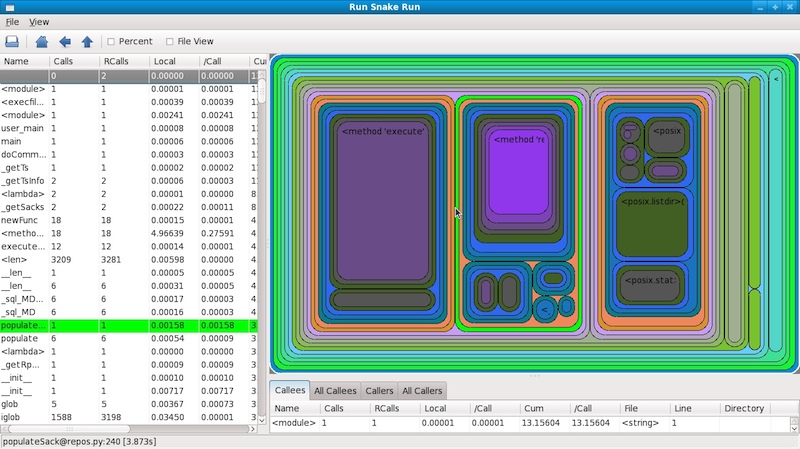
RunSnakeRun
Another program for visualization of the profiling results of RunSnakeRun was originally written to work with the profiler of python (this is evident from its name). It is similar to kcachegrind, but, as the authors say, stands out with its simpler interface and functionality. Installation will not cause difficulties:
➜ brew install wxwidgets ➜ pip install SquareMap RunSnakeRun Use too:
➜ runsnake profile_results.prof Similarly, we see a map of squares: the larger the area of the square, the longer it took to perform the corresponding function:
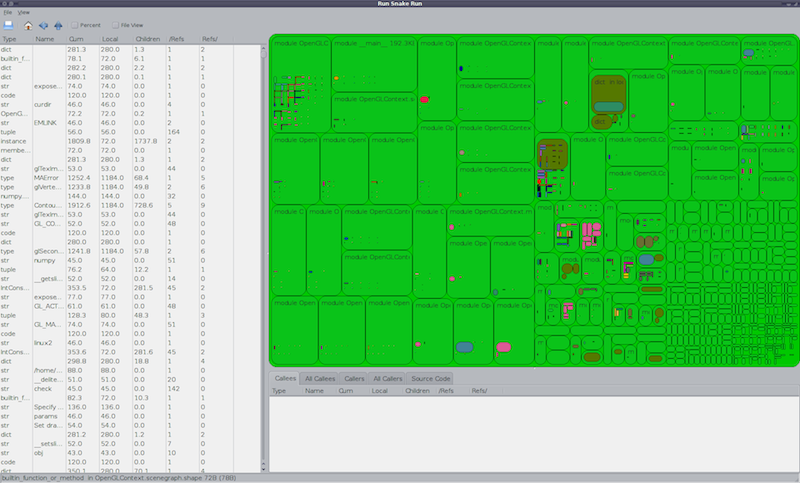
RunSnakeRun also allows you to visualize the result of profiling memory consumption using the Meliae utility:
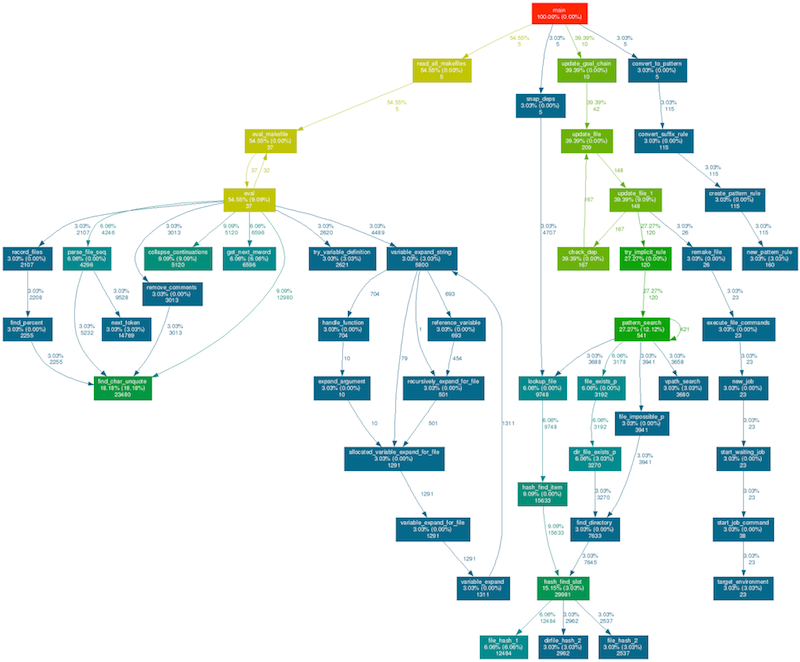
gprof2dot
The gprof2dot utility generates a picture with the function call tree and information about the time of their execution. In most cases, this is enough to find bottlenecks in the program. We set and generate a picture:
➜ brew install graphviz ➜ pip install gprof2dot ➜ gprof2dot -f pstats profile_results.prof | dot -Tpng -o profile_results.png Result:
Django Profiling
For Django profiling, it is convenient to use the django-extensions module, which, in addition to a heap of various useful things, has a useful “runprofileserver” command. Using it is easy. We put:
➜ pip install django-extensions Add application in settings.py:
INSTALLED_APPS += ('django_extensions',) Run:
➜ python manage.py runprofileserver --use-cprofile --prof-path=/tmp/prof/ In the / tmp / prof / directory, a file will be created with the profiling results for each request to the application:
➜ ls /tmp/prof/ admin.000276ms.1374075009.prof admin.account.user.000278ms.1374075014.prof admin.jsi18n.000185ms.1374075018.prof favicon.ico.000017ms.1374075001.prof root.000073ms.1374075004.prof static.admin.css.base.css.000011ms.1374075010.prof static.admin.css.forms.css.000013ms.1374075017.prof static.admin.img.icon-yes.gif.000001ms.1374075015.prof static.admin.img.sorting-icons.gif.000001ms.1374075015.prof static.admin.js.core.js.000018ms.1374075014.prof static.admin.js.jquery.js.000003ms.1374075014.prof static.css.bootstrap-2.3.2.min.css.000061ms.1374074996.prof static.img.glyphicons-halflings.png.000001ms.1374075005.prof static.js.bootstrap-2.3.2.min.js.000004ms.1374074996.prof static.js.jquery-2.0.2.min.js.000001ms.1374074996.prof user.login.000187ms.1374075001.prof Further analysis can be performed using any of the tools listed above: pstats, kcachegrind, RunSnakeRun or gprof2dot. Or any other =)
In addition to the profiler built into Python, there are also a lot of third-party programs, simple and complex, not very useful.
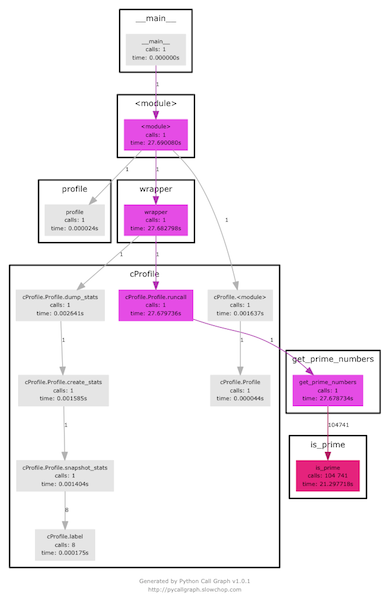
pycallgraph
pycallgraph allows you to build a Python call tree. We put:
➜ brew install graphviz ➜ pip install pycallgraph Run and see the result:
➜ pycallgraph graphviz -- euler_7.py 10001 ➜ open pycallgraph.png line_profiler
line_profiler , as its name implies, allows you to line up the necessary sections of code line by line. We put:
➜ pip install line_profiler Add the “profile” decorator to the right places (I temporarily removed the dockstrings for a more compact display of the results):
@profile def is_prime(num): for i in xrange(2, int(math.sqrt(num)) + 1): if num % i == 0: return False return True @profile def get_prime_numbers(count): prime_numbers = [2] next_number = 3 while len(prime_numbers) < count: if is_prime(next_number): prime_numbers.append(next_number) next_number += 1 return prime_numbers We start profiling:
➜ kernprof.py -v -l euler_7.py 10001 Wrote profile results to euler_7.py.lprof Timer unit: 1e-06 s File: euler_7.py Function: is_prime at line 7 Total time: 10.7963 s Line # Hits Time Per Hit % Time Line Contents ============================================================== 7 @profile 8 def is_prime(num): 9 2935963 5187211 1.8 48.0 for i in xrange(2, int(math.sqrt(num)) + 1): 10 2925963 5421919 1.9 50.2 if num % i == 0: 11 94741 169309 1.8 1.6 return False 12 10000 17904 1.8 0.2 return True File: euler_7.py Function: get_prime_numbers at line 15 Total time: 23.263 s Line # Hits Time Per Hit % Time Line Contents ============================================================== 15 @profile 16 def get_prime_numbers(count): 17 1 5 5.0 0.0 prime_numbers = [2] 18 1 3 3.0 0.0 next_number = 3 19 20 104742 208985 2.0 0.9 while len(prime_numbers) < count: 21 104741 22843717 218.1 98.2 if is_prime(next_number): 22 10000 22405 2.2 0.1 prime_numbers.append(next_number) 23 104741 187927 1.8 0.8 next_number += 1 24 25 1 2 2.0 0.0 return prime_numbers Immediately, we notice a huge overhead projector: the program has been running for more than 30 seconds, despite the fact that without a profiler, it performs faster in less than a second.
Analyzing the results we can conclude that the program spends the most time in lines 9 and 10, checking the number divisors to determine its “simplicity”. And for each subsequent number all the same checks take place. Logical optimization of the program is to check as divisors only those numbers that were previously defined as simple:
def is_prime(num, prime_numbers): """ Checks if num is prime number. >>> is_prime(2, []) True >>> is_prime(3, [2]) True >>> is_prime(4, [2, 3]) False >>> is_prime(5, [2, 3]) True >>> is_prime(41, [2, 3, 5, 7, 11, 13, 17, 19, 23, 29, 31, 37]) True >>> is_prime(42, [2, 3, 5, 7, 11, 13, 17, 19, 23, 29, 31, 37, 41]) False >>> is_prime(43, [2, 3, 5, 7, 11, 13, 17, 19, 23, 29, 31, 37, 41]) True """ limit = int(math.sqrt(num)) + 1 for i in prime_numbers: if i > limit: break if num % i == 0: return False return True def get_prime_numbers(count): """ Get 'count' prime numbers. >>> get_prime_numbers(1) [2] >>> get_prime_numbers(2) [2, 3] >>> get_prime_numbers(3) [2, 3, 5] >>> get_prime_numbers(6) [2, 3, 5, 7, 11, 13] >>> get_prime_numbers(9) [2, 3, 5, 7, 11, 13, 17, 19, 23] >>> get_prime_numbers(19) [2, 3, 5, 7, 11, 13, 17, 19, 23, 29, 31, 37, 41, 43, 47, 53, 59, 61, 67] """ prime_numbers = [2] next_number = 3 while len(prime_numbers) < count: if is_prime(next_number, prime_numbers): prime_numbers.append(next_number) next_number += 1 return prime_numbers We run the tests, we make sure that everything works out correctly, we measure the program execution time:
➜ python -m timeit -n 10 -s'import euler_7' 'euler_7.get_prime_numbers(10001)' 10 loops, best of 3: 390 msec per loop We accelerated the work almost three times, not bad. Run the profiling one more time:
➜ kernprof.py -v -l euler_7.py 10001 Wrote profile results to euler_7.py.lprof Timer unit: 1e-06 s File: euler_7.py Function: is_prime at line 7 Total time: 4.54317 s Line # Hits Time Per Hit % Time Line Contents ============================================================== 7 @profile 8 def is_prime(num, prime_numbers): 9 104741 310160 3.0 6.8 limit = int(math.sqrt(num)) + 1 10 800694 1296045 1.6 28.5 for i in prime_numbers: 11 800692 1327770 1.7 29.2 if i > limit: 12 9998 17109 1.7 0.4 break 13 790694 1409731 1.8 31.0 if num % i == 0: 14 94741 165761 1.7 3.6 return False 15 10000 16599 1.7 0.4 return True File: euler_7.py Function: get_prime_numbers at line 18 Total time: 10.5464 s Line # Hits Time Per Hit % Time Line Contents ============================================================== 18 @profile 19 def get_prime_numbers(count): 20 1 4 4.0 0.0 prime_numbers = [2] 21 1 2 2.0 0.0 next_number = 3 22 23 104742 202443 1.9 1.9 while len(prime_numbers) < count: 24 104741 10143489 96.8 96.2 if is_prime(next_number, prime_numbers): 25 10000 22374 2.2 0.2 prime_numbers.append(next_number) 26 104741 178074 1.7 1.7 next_number += 1 27 28 1 1 1.0 0.0 return prime_numbers As you can see, the program began to run much faster.
memory_profiler
For memory profiling, you can use memory_profiler . Using it is as easy as line_profiler. We put:
➜ pip install psutil memory_profiler Run:
➜ python -m memory_profiler euler_7.py 10001 Filename: euler_7.py Line # Mem usage Increment Line Contents ================================================ 18 8.441 MiB -0.531 MiB @profile 19 def get_prime_numbers(count): 20 8.445 MiB 0.004 MiB prime_numbers = [2] 21 8.445 MiB 0.000 MiB next_number = 3 22 23 8.973 MiB 0.527 MiB while len(prime_numbers) < count: 24 if is_prime(next_number, prime_numbers): 25 8.973 MiB 0.000 MiB prime_numbers.append(next_number) 26 8.973 MiB 0.000 MiB next_number += 1 27 28 8.973 MiB 0.000 MiB return prime_numbers Filename: euler_7.py Line # Mem usage Increment Line Contents ================================================ 7 8.973 MiB 0.000 MiB @profile 8 def is_prime(num, prime_numbers): 9 8.973 MiB 0.000 MiB limit = int(math.sqrt(num)) + 1 10 8.973 MiB 0.000 MiB for i in prime_numbers: 11 8.973 MiB 0.000 MiB if i > limit: 12 8.973 MiB 0.000 MiB break 13 8.973 MiB 0.000 MiB if num % i == 0: 14 8.973 MiB 0.000 MiB return False 15 8.973 MiB 0.000 MiB return True As you can see, we have no special problems with memory. Everything is within normal limits.
More tools
I will list a few more tools for profiling, unfortunately, the article turned out to be huge and it is not possible to disassemble all of them.
- Dowser is an excellent memory profiling tool.
- guppy is another memory profiling program.
- Meliae is a memory profiling tool mentioned earlier that can be used with RunSnakeRun
- muppy - memory leak detection
- memprof - again memory profiling
- objgraph - an interesting tool for the study of objects
We learned about tools for profiling Python code. A lot of them are left behind the scenes, I hope my colleagues will complement me in the comments.
In the next article, we will introduce methods and tools for debugging Python programs. Stay in touch!
Minute of statistics: in three articles about python profiling I used the word “profiling” more than a hundred times.
Source: https://habr.com/ru/post/202832/
All Articles