We ran a marathon. Continuation
In continuation of the marathon story, I will tell you how we created the visualization. Work on the project was carried out in stages: the idea, design, implementation and filling with data.
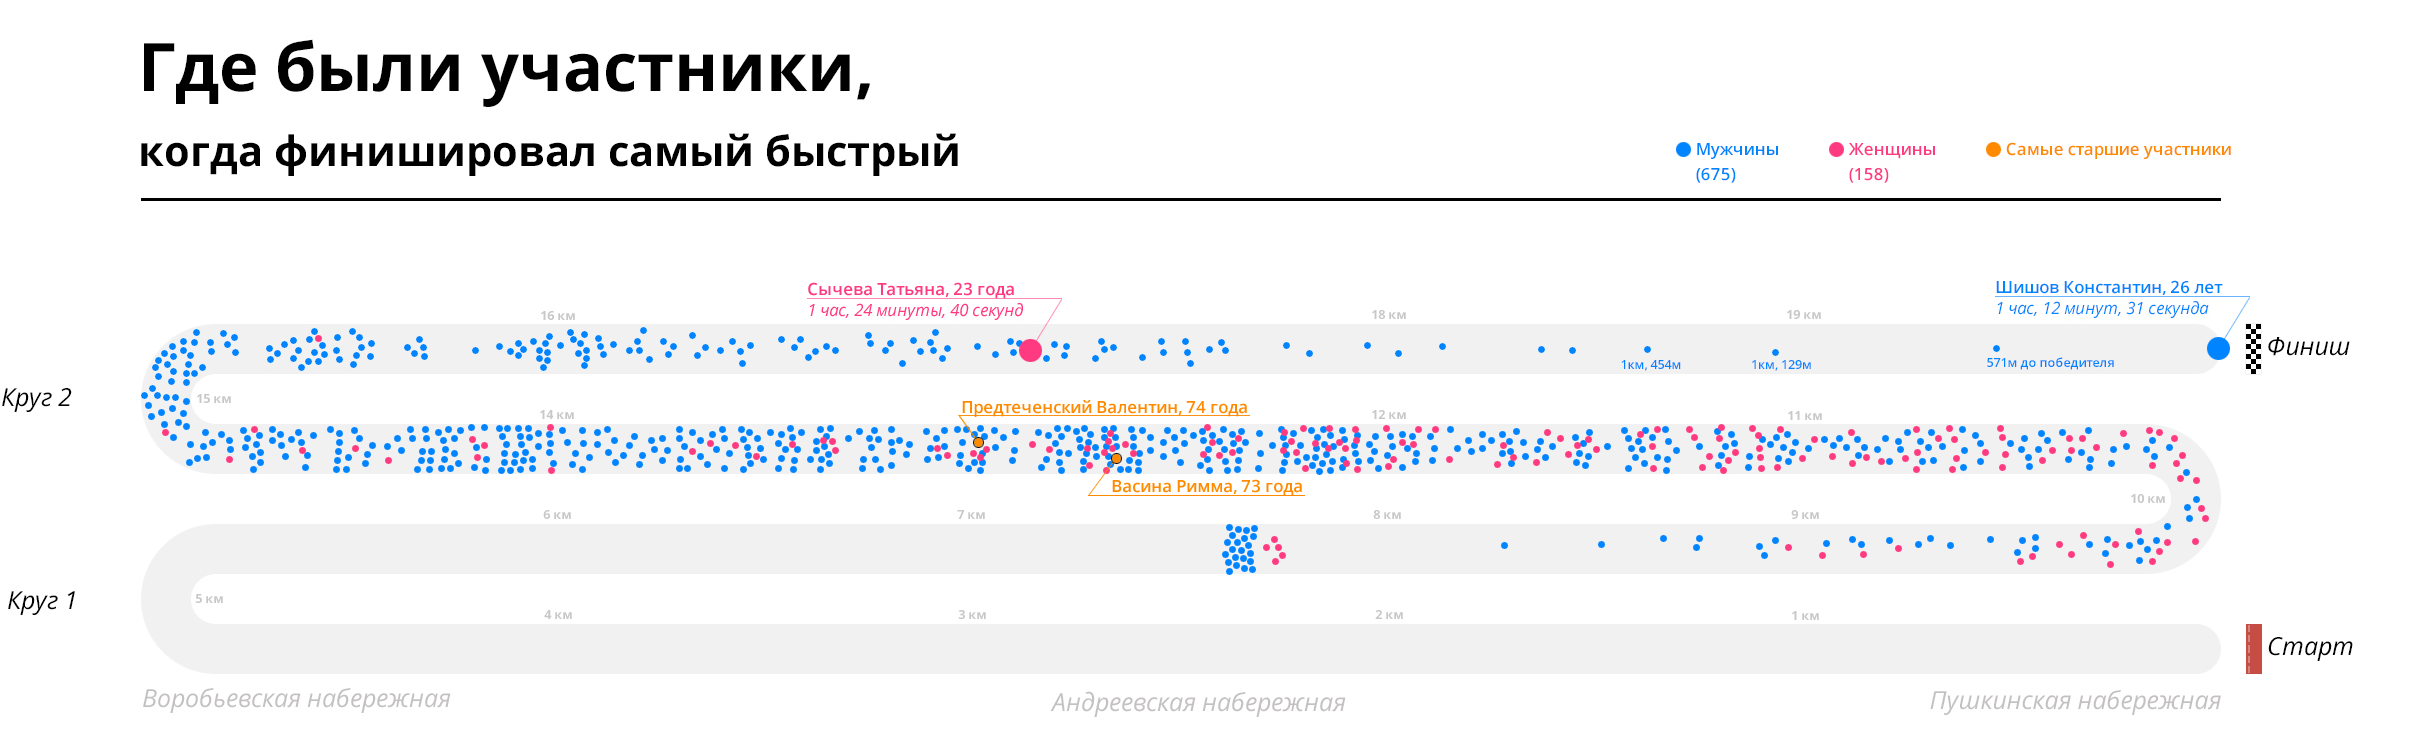
The idea to show the results of the race came to me after participating in the "Spring thunder . " The boring official tables did not reflect the mood of the race in any way, and the data were publicly available - complex and interesting. The laboratory has just opened, and as a test task for a designer's job, I chose the task of visualizing the results of Spring Thunder. Of the ten options I liked the idea of Sergey Dolinin svetosil the most - to show the distribution of participants at the time of the first finish:
')
We took this idea as the basis and revived it with a temporary slider. Visualization of the marathon became Seryozha’s first project in the laboratory.
So, we decided to show the distribution of runners on the track at each time point, the sex and age composition of the participants and their distribution at the finish, the height profile of the course, weather, photos and interesting facts, as well as a complete table of results with filters by age group, team and city . To all the data fit on one chart had to sweat. For a long time the table was located to the right of the map:

The high-altitude profile was shown by projecting it onto the fields to the left and below, as on this map of Germany, which I had dug long ago on the book collapses in Rome (now it hangs in Coworkhaf):

It turned out not too clear, but the relief is tied to the route. Leave as follows:

In the end, the slider and the table move under the map, and the route is cluttered with jokes and facts. We can see specific runners here (unfortunately, we didn’t have time to implement this functionality):

In the meantime, we are preparing a technical framework for the "snake". The chip of each athlete recorded the time of passing the intermediate lines (10, 21, 30, 35 km and the finish). Based on the assumption that the athletes were moving evenly between these points, we got the distribution of the crowd on the track.
The implementation involved Gleb Arestov arestov . He took the d3-shny streamgraph as a basis and learned how to build it along a curve. Here is what Gleb says:
"We built a chart at two points:
1) a point that is n meters away from the beginning of the path, given through geographic coordinates
2) a point located on a segment perpendicular to the tangent to the curve at the first point at the required height (height of the snake)
The tangent in this case is not calculated, and the point is calculated through a straight line (which replaces the tangent) defined by two points - the midpoints of two segments, one segment from the previous neighbor to the current anchor point and it to the next neighbor (neighbors are also anchor points). To get the coordinates, we look for the angle between the X axis and this straight line (this angle will later be used to build Bezier curves). ”
From myself I will add that the serpent is built according to geographic coordinates, but I had to put a picture onto the background, because the real maps could not be scaled properly.
First, we set up with the geometry:

Corrected:

Added division into groups:

Tied heights (here they jump much because of too much detail):

After that, a ready-made design was pulled onto the frame, it only remains to revive the picture with real data.
We tested the snake on the results of the St. Petersburg White Nights , we could only replace this data with Moscow.
At the last moment before the start, the marathon route changed (they did not have time to open the Krymskaya Embankment after the repair). But it was enough for us to replace the old piece of the route with a new one — the path of the snake and the heights were recalculated automatically.
It was not possible to agree with the organizers on providing data in a convenient form. Therefore, we simply took the summary protocols from the site, recognized, corrected manually and put in a separate file. (And this is easier said than done, in total, it took 2-3 days to work). It was easier to parse the site, you say, but the results were published there much later than the appearance of the protocols - we simply did not wait.
Here's what happened: moscowmarathon.datalaboratory.ru
Work on the project took six weeks. During this time, Seryozha and I had time to go to a running camp in Croatia, where we trained and worked together. Usually we are deprived of such an opportunity - I sit in Moscow, and Sergei in St. Petersburg. In the photo we left:

By the way, the laboratory is a complete remout . We work remotely with clients from Moscow, St. Petersburg, Minsk, Tyumen, Serbia, Melbourne. I will tell about it in more detail in the following notes :-)
UPD. On the advice of KoGor added details to the description of the technical implementation.
Idea
The idea to show the results of the race came to me after participating in the "Spring thunder . " The boring official tables did not reflect the mood of the race in any way, and the data were publicly available - complex and interesting. The laboratory has just opened, and as a test task for a designer's job, I chose the task of visualizing the results of Spring Thunder. Of the ten options I liked the idea of Sergey Dolinin svetosil the most - to show the distribution of participants at the time of the first finish:
')
We took this idea as the basis and revived it with a temporary slider. Visualization of the marathon became Seryozha’s first project in the laboratory.
Design
So, we decided to show the distribution of runners on the track at each time point, the sex and age composition of the participants and their distribution at the finish, the height profile of the course, weather, photos and interesting facts, as well as a complete table of results with filters by age group, team and city . To all the data fit on one chart had to sweat. For a long time the table was located to the right of the map:
The high-altitude profile was shown by projecting it onto the fields to the left and below, as on this map of Germany, which I had dug long ago on the book collapses in Rome (now it hangs in Coworkhaf):
It turned out not too clear, but the relief is tied to the route. Leave as follows:
In the end, the slider and the table move under the map, and the route is cluttered with jokes and facts. We can see specific runners here (unfortunately, we didn’t have time to implement this functionality):
Technical implementation
In the meantime, we are preparing a technical framework for the "snake". The chip of each athlete recorded the time of passing the intermediate lines (10, 21, 30, 35 km and the finish). Based on the assumption that the athletes were moving evenly between these points, we got the distribution of the crowd on the track.
The implementation involved Gleb Arestov arestov . He took the d3-shny streamgraph as a basis and learned how to build it along a curve. Here is what Gleb says:
"We built a chart at two points:
1) a point that is n meters away from the beginning of the path, given through geographic coordinates
2) a point located on a segment perpendicular to the tangent to the curve at the first point at the required height (height of the snake)
The tangent in this case is not calculated, and the point is calculated through a straight line (which replaces the tangent) defined by two points - the midpoints of two segments, one segment from the previous neighbor to the current anchor point and it to the next neighbor (neighbors are also anchor points). To get the coordinates, we look for the angle between the X axis and this straight line (this angle will later be used to build Bezier curves). ”
From myself I will add that the serpent is built according to geographic coordinates, but I had to put a picture onto the background, because the real maps could not be scaled properly.
First, we set up with the geometry:
Corrected:
Added division into groups:
Tied heights (here they jump much because of too much detail):
After that, a ready-made design was pulled onto the frame, it only remains to revive the picture with real data.
Filling data
We tested the snake on the results of the St. Petersburg White Nights , we could only replace this data with Moscow.
At the last moment before the start, the marathon route changed (they did not have time to open the Krymskaya Embankment after the repair). But it was enough for us to replace the old piece of the route with a new one — the path of the snake and the heights were recalculated automatically.
It was not possible to agree with the organizers on providing data in a convenient form. Therefore, we simply took the summary protocols from the site, recognized, corrected manually and put in a separate file. (And this is easier said than done, in total, it took 2-3 days to work). It was easier to parse the site, you say, but the results were published there much later than the appearance of the protocols - we simply did not wait.
Conclusion
Here's what happened: moscowmarathon.datalaboratory.ru
Work on the project took six weeks. During this time, Seryozha and I had time to go to a running camp in Croatia, where we trained and worked together. Usually we are deprived of such an opportunity - I sit in Moscow, and Sergei in St. Petersburg. In the photo we left:
By the way, the laboratory is a complete remout . We work remotely with clients from Moscow, St. Petersburg, Minsk, Tyumen, Serbia, Melbourne. I will tell about it in more detail in the following notes :-)
UPD. On the advice of KoGor added details to the description of the technical implementation.
Source: https://habr.com/ru/post/201882/
All Articles