Problems removing regular clutter on printed forms
Hi, Habr)
With this article, we begin a series of publications on optical recognition technologies (OCR, ICR) and understanding of documents developed by Cognitive Technologies. Many of these decisions have been successfully operating in different organizations for over 10 years and help optimize the processing of Pension Fund forms, foreign passport application forms, Sberbank payment orders, Gazprom shareholders voting results and dozens of other documents.
Today our story about one of the most difficult and scientifically interesting problems that has to be solved when recognizing business documents is the removal of interferences or the separation of useful information from “garbage”.
First you need to determine that we are talking about documents with handwritten filling, built on a previously known form.

Grid of cells

Individual cells

Serif string
Figure 1. Types of familiarity grids
')
but)

b)
Figure 2. An example of a filled field in the presence of serifs (a) and after removing regular noise (b)
In such cases, the location of the data entry fields in the document is known in advance and described in
document model, which includes a description of static elements (lines of graphic elements, field headers), the composition of elements, their relative position, size and other characteristics. For blanks of documents that imply filling by hand, the input fields are arranged as a special type of grid, in which there is a separate cell for each letter (familiarity).
Lattice familiarity are of various types. In practice, three main types of grids are most often used: in the form of a grid of cells, individual cells and in the form of a serif line (Figure 1). All of them have a characteristic rectangular structure (composed of horizontal and vertical lines).
Figure 2a shows an example of a completed handwritten field with a “serif line” type. From the point of view of the recognition system, the familiarity grid is essentially a structured noise superimposed on textual data, generating a large number of recognition errors. In particular, in contrast to uncorrelated “salt / pepper” noise, superimposed lattices make topological character recognition methods completely unsuitable. Thus, an attempt to remove this “artificial” interference can lead to a significant increase in the quality of recognition.
Knowledge of the exact location of the supporting elements allows you to suppress them, almost without distorting the text. In spite of the fact that theoretically this information is known (incorporated in the model of the document), in practice it is often incomplete or incorrect. In the process of printing, filling and subsequent digitization of forms, various kinds of deformations are introduced (shift, tilt, slight stretching associated with drawing in the printer and / or scanner) and noise signals (spots, shadows from bending paper, etc.). Therefore, the reference description of the grids often does not correspond to their realization: the rectangular property is lost, the periodicity between serifs and so on is broken (Figure 3).

Periodicity violation
Straightness distortion
Figure 3. Examples of deformations of familiarity grids
From the above, the following problems stem from the exact localization of the support elements:
- • Distortion of straight lines.
- • Violation of periodicity in familiarity grids.
- • The presence of extraneous static elements in close proximity to the input fields (Fig. 4).
- • The presence of filling elements, morphologically similar to straight line segments.
The first two problems can be eliminated by applying the Dynamic time warping algorithm (DTW), which is a classic example of using the dynamic programming method. To exclude lines of attention from attention, you can use additional knowledge about the structure of familiarity grids: the presence of joints of horizontal and vertical connecting lines. Such structural features are easily detected using hit-or-miss morphological filters.
Let us dwell a little more on the localization algorithm for support grids, built on the use of these two tools.
Methods of preliminary identification of documents allow you to determine the approximate area of the fill fields, as well as the angle of the document as a whole. Unfortunately, due to image deformations, this does not guarantee the exact orientation of individual fields. In addition, on the questionnaires there are so-called "overprints" - the variable parts of the questionnaire applied using a printer. For obvious reasons, overprint fields may have a slope that is different from the global slope of the document. The proposed localization algorithm expects an “directly oriented” image at the entrance, so the first step is to rotate the field image, defining its angle of inclination. For this, an algorithm based on the fast Hough transform is used. Further, based on knowledge of the number and type of joints with the vertical components of the lattice, the position of the horizontal reference lines is determined. The next step is the location of the vertical support elements. Finally, the arrangement of horizontal lines for each cell is adjusted using the dynamic programming method.
Note that the problem of determining the orientation of the image and removing the exactly found lattice are separate tasks and are not considered in this article.
Now let us consider in more detail the algorithms for searching and adjusting lines and junctions.
Search for horizontal lines with a known pattern of joints.
So, in order to highlight the reference horizontal lines of the gratings on the background of extraneous contrast lines, it is proposed to rely on information about the conjugation of the reference line with the vertical elements of the grid. We will describe the desired object with the simplest regular expression - a string containing semantic characters and a symbol of possible repetition ('*'). Let's call this description the line pattern.
As the semantic symbols, we will use symbols of the type of joint (for example, '└', '┴', '┘'), as well as symbols of the presence of a line without joints ('─') and the absence of a line ('○'). For example, the bottom reference lines of all the fields shown in Fig. 4, described by the pattern "└ ─ * ┴ ─ * ┘", and fields with a grid of the type of "single cells" - "└ ─ * ┘ ○ * └ ─ * ┘ ○ * └ ─ * ┘ ...".
Let us now consider the method of estimating the image pixel as the central pixel of the line interface. In fact, we need to evaluate how dark the central pixel is, as well as the pixels located in the directions in which we expect lines. In addition, we must check that the pixels are sufficiently bright in other directions (otherwise all detectors will react to the crosswise junction), and, moreover, diagonals should be bright (otherwise the detector will react to the angles of the black rectangles). We will consider a pattern of 9 pixels in the nodes of a regular lattice with a step L, commensurate with the expected thickness of the line. In fig. 5 shows the expected configuration for the “┴” interface. The pixel for which the calculations are made corresponds to the center of the given scheme.
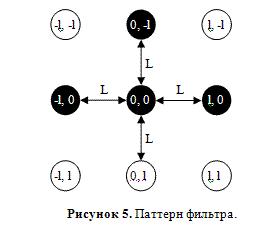
We now construct a morphological filter corresponding to the configuration in question. By pixels marked in white on the scheme, we will look for a minimum, and for black - a maximum. Then we find the difference between the obtained values, and reset it if it is less than 0. The resulting value of W will be considered as an estimate of the quality of the desired junction in a given pixel:

Detectors of all other types of joints are built in a similar way, as well as a straight line detector without joints. For the missing line detector, the construction method is slightly different:

where Wbg carries the meaning of assessing the brightness of the background in the presence of possible contaminants in any of the pixels of the pattern.
So, applying the appropriate morphological filters to the image of the field, we get in each pixel a set of estimates, telling how this pixel is similar to the central pixel of the junction, line or space (Fig. 5).
Now for each row of the image of the field we will determine how it corresponds to the desired pattern, and among all the lines we will choose the best one. It is quite obvious that the task of evaluating one line is the problem of dynamic programming. Indeed, we will create a table, each column of which corresponds to the semantic symbol of the template or a symbol, followed by an asterisk, and each row corresponds to the pixel of the image row. Each element of the table will be filled with an estimate of the pixel specified by the string, corresponding to the junction defined by the column (Table 1). Our task will be to find the path with the greatest weight in the table from the left to the right edge, provided that in the columns without an asterisk we can move only one cell to the right diagonally down, and in the columns with an asterisk - either one or one cell down. In this case, the weight of the path will be the sum of the values of the cells along which the path passes. (In Table 1, the optimal path is highlighted in blue.)
Solving this problem sequentially for each row of the image, we find the coordinates of the lower and (if this type of grid has) the upper grid reference line.
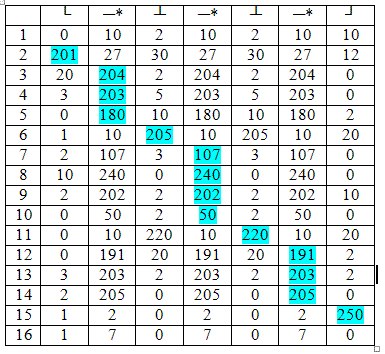
Table 1. An example of finding a pattern matching assessment using dynamic programming.
Search vertical lines
Vertical grid lines could be searched for using frequency analysis of horizontal projection. But because of the imperfect paper feeding system of printers and drawers in grids, the periodicity between serifs is often broken (Fig. 6).
a)
 b)
b) 
at)
 d)
d) 
Figure 6. The result of the detection of the joints '└', '┴' and '─' (b, c, d) on the image of the field (a).
In addition, with an emergency increase in the number of cells in the field at the design stage of the form (in case of a sudden acquaintance with the surname “Gediminayte-Berzhanskite-Klausutay”), the added cells happen to have a non-standard size. The problem is aggravated by the fact that even in the case of an ideal lattice geometry, because of symbols having pronounced vertical strokes, many false peaks are displayed on the projection.
The latter problem, however, can be partially weakened: since at this stage of the detection of the lattice we already know the location of the horizontal lines, we can consider not the projection of the entire image on the horizontal axis, but the projection of only the part that is above the lower line of the lattice, but below the upper line or serif heights in the case of lattices of the appropriate type. This ensures that the peaks formed by high letters will not exceed the peaks formed by the grid elements. In addition, it is reasonable to add the weight of “” and “┬” joints to the histogram in order to strengthen the true peaks.
Knowing the estimated period and the possible error in the distance between the vertical support elements, you can quickly calculate the various options for the location of such elements in a given area, and choose the best option. This problem is well solved by the dynamic programming method, and in this case a table is not required for the solution.
We will move along the histogram from left to right. At each step, we consider a histogram segment, where x is our current position, p is the expected period, and ∆ is the maximum deviation. Find the maximum among the histogram values over the specified segment and add to the current cell, and in the parallel array, save the maximum index. Then the global maximum of the obtained histogram will correspond to the position of the last vertical line, and the corresponding index will point to the previous element of the list of found lines. Having passed through the list, we will restore the positions of all vertical supporting elements.
Adjusting the location of horizontal lines
After finding the vertical and horizontal lines, the familiarity grid is considered formed. However, for the grid removal algorithm, pixel accuracy is required, and when pulling the paper during the printing and scanning stages, the image may undergo a fan distortion (if the sheet turns as it goes along the path). In addition, the algorithm for determining the angle of the field image can also introduce small errors. We set the task as follows: it is required to find the sequence of vertical displacements of the elements of the horizontal line from cell to cell (Fig. 3), provided that each individual displacement cannot be greater than k pixels (as a rule, k = 1).
This problem is also solved by dynamic programming.
Let us collect a vertical histogram of a size equal to the height of the field (which exceeds the size of the lattice) for each cell of the lattice and fill these tables with a histogram with a width equal to the number of cells. We will maximize the path from the left to the right border of the table, allowing at the offset to the right to move up or down by no more than k elements. The maximum path found will pass along the positions of the elements of the horizontal reference line.
With the help of these two tools, the problem of exact localization of familiarity grids was solved. The developed approach to solving the comparison problem was programmatically implemented and is currently used industrially for streaming entry of OSAGO questionnaires, loan applications, and network marketing questionnaires.
The quality of the algorithm was evaluated on a set of 395 policies of CTP, containing 12,245 fields (Table 2). For this set, the correct values of all the fields were entered manually, then the recognition system was launched in three modes: with the grid removal subsystem turned off, with the “naive” algorithm turned on (based solely on histogram analysis) and with the proposed algorithm. The quality of recognition was measured as a percentage of the correct (without a single error) of the recognized fields. At the cost of double deceleration of the system, it was possible to raise the quality of recognition from 30% to 80%. It should be noted that document recognition systems with recognition quality below 70% are usually unprofitable - filling out all fields with an operator is faster than correcting errors.
As shown by a detailed view of the processed images, the proposed algorithm provides:
- Correct work with fields that capture extraneous contrast lines of a graphic design.
- Correct processing of fields with variable cell width.
- Correct processing of grids familiarity with disturbed geometry (including fan distortion).
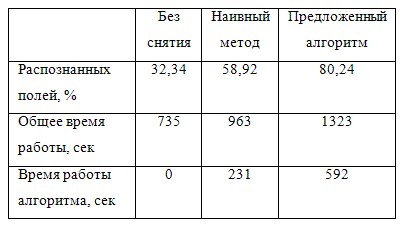
table 2
More information on this topic can be found in the article A.V. Kuroptev, D.P. Nikolaev, V.V. Postnikov. “The exact localization of the reference grids of the filling fields in the questionnaires using dynamic programming and morphological filtering”, published in the Proceedings of the Institute of Systems Analysis of the Russian Academy of Sciences (ISA RAS), 2013, V. 63, No.3, p.
Source: https://habr.com/ru/post/201856/
All Articles