Rummage in the brains of "smart" switch
A couple of years ago, I had a zabbix monitoring server. Naturally, I immediately wanted to get as much information about my equipment as possible. On ordinary computer systems, the zabbix agent provides the most extensive options for this. With network equipment everything is more complicated. The snmpwalk command prints a sheet of different values and counters, but extracting something useful from there is not so easy.

Consider managed switches. The classic example with them is to poll the status of each port, as well as the volume and composition of the past traffic. This is done by means of the zabbix itself, how exactly look here . Only I do not need monitoring of these parameters. It is much more interesting to keep track of which devices are connected to the switch. After all, it stores and updates the table of binding mac addresses to ports, you only need to get it and arrange it beautifully. Once I found on Habré how to get this table . With two snmp queries, we retrieve the lists of ports and mac addresses, and then by matching the OID values suffixes we establish a match. See the original post for details, but here it’s how to improve such monitoring.
The initial implementation has several drawbacks. First, launching an external script to poll each port creates an excessive load on the zabbix server, and if for some reason the script does not work properly or does not complete in the allotted time, the data element can quietly go to the “not supported” state, and information will cease to be updated. Secondly, it is inconvenient to identify the device by mac address, it is clearer to have its ip address or even a domain name. Thirdly, since the data is taken from the switch cache, it would be nice to preheat this cache, otherwise we will not see the equipment that has been inactive on the network lately.
To solve these problems, I wrote a small python program. This is a demon. With a specified frequency, it scans the local network, polls the switches and sends information to the zabbix server. Information on all ports of all switches is first written to a temporary file, and then for one connection is transmitted to the server by the zabbix_sender utility (using the - input-file key). The standard snmpwalk program is used to poll switches using snmp. Before this, the daemon performs an arp scan of the available local area networks with the nmap scanner. On the one hand, this “warms up” the cache, and on the other, it gives the display of mac addresses in ip. Thus obtained, the ip address of the daemon can additionally convert to domain names (works if reverse domain zones are defined).
')
This is the result on a zabbix server.
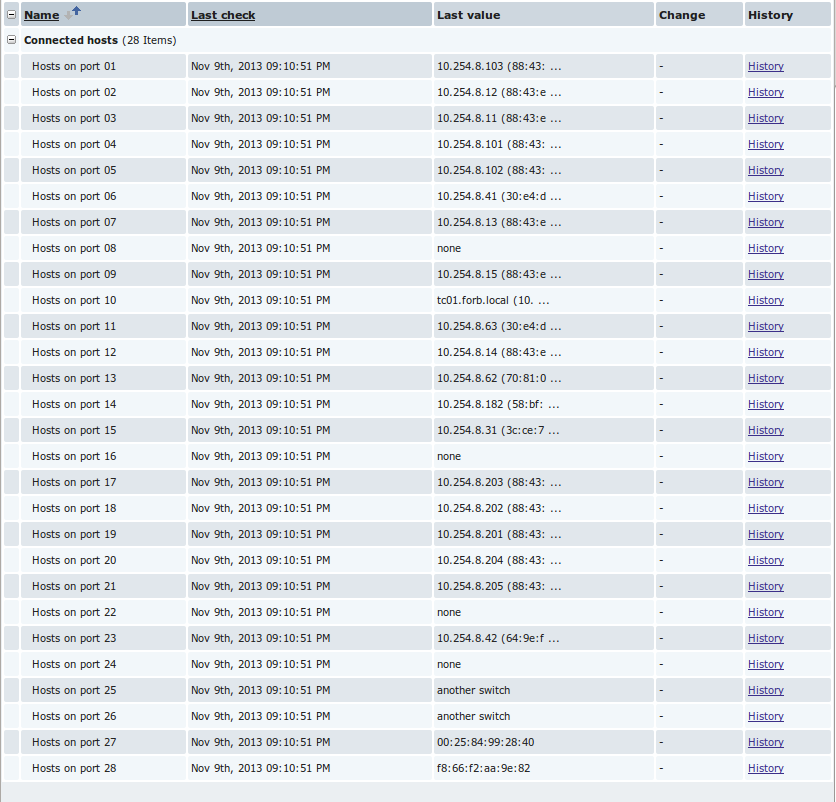
The picture shows the HP Procurve 2520 switch. With the help of vlans, seven subnets are defined on it: five are local and two are external to different Internet service providers. The two mac addresses below belong to the gateways of the providers. A machine with a demon does not look at external subnets, so the ip of the address is not defined. If there are a lot of devices on the port, for clarity, the entry “another switch” is displayed (if you prefer, it turns off).
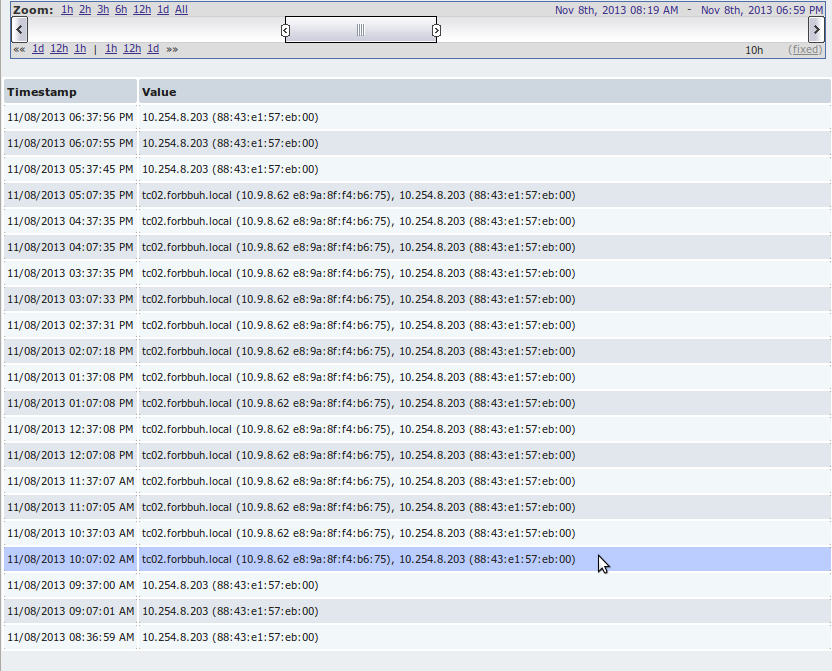
But the story of one of the ports. An ip-phone and a computer are connected to it. It can be seen how the employee turned on the computer at the beginning of the day, worked, worked ... and then left early. Friday after all.
The daemon is called smonitor and is available on github.com :
For debugging and error tracking, the daemon writes logs through the syslog service with the category daemon. In addition, it is planned to launch the program in debug mode, when demonization does not occur and all logs are output to the console. To do this, use the key - debug:
Application settings are in the Settings.py file. There is also python code, but it consists only of the definition of variables, so it’s easy to figure out. For tips on the available options, see the Settings.py.sample.rus file. Since I use mostly ubuntu, the program has been tested on this distribution, and the installation instructions are only for it. The same applies to switches - I checked the daemon on what is available: HP Procurve 2520, HP Procurve 1700 and D-Link DES-3028. Judging by this information , the program will not work with Cisco equipment without doping, because snmp queries need to be done separately for each vlan.
The demon is not tied to zabbix. To make friends with another monitoring system, it is enough to rewrite one function responsible for sending the data. In fact, you can improve a lot more. For example, to solve the inverse problem, that is, to show for the hosts, to which port of which switch they are connected. To teach the daemon to determine how the switches are interconnected. Add import of matching mac and ip addresses from a file, then you can organize full monitoring without arp scanning, including networks to which the daemon does not have a direct connection (and the cache can be heated by ping requests using the list of ip addresses). In short, there are a lot of ideas if only there is enough time and energy to fight laziness.
Consider managed switches. The classic example with them is to poll the status of each port, as well as the volume and composition of the past traffic. This is done by means of the zabbix itself, how exactly look here . Only I do not need monitoring of these parameters. It is much more interesting to keep track of which devices are connected to the switch. After all, it stores and updates the table of binding mac addresses to ports, you only need to get it and arrange it beautifully. Once I found on Habré how to get this table . With two snmp queries, we retrieve the lists of ports and mac addresses, and then by matching the OID values suffixes we establish a match. See the original post for details, but here it’s how to improve such monitoring.
The initial implementation has several drawbacks. First, launching an external script to poll each port creates an excessive load on the zabbix server, and if for some reason the script does not work properly or does not complete in the allotted time, the data element can quietly go to the “not supported” state, and information will cease to be updated. Secondly, it is inconvenient to identify the device by mac address, it is clearer to have its ip address or even a domain name. Thirdly, since the data is taken from the switch cache, it would be nice to preheat this cache, otherwise we will not see the equipment that has been inactive on the network lately.
To solve these problems, I wrote a small python program. This is a demon. With a specified frequency, it scans the local network, polls the switches and sends information to the zabbix server. Information on all ports of all switches is first written to a temporary file, and then for one connection is transmitted to the server by the zabbix_sender utility (using the - input-file key). The standard snmpwalk program is used to poll switches using snmp. Before this, the daemon performs an arp scan of the available local area networks with the nmap scanner. On the one hand, this “warms up” the cache, and on the other, it gives the display of mac addresses in ip. Thus obtained, the ip address of the daemon can additionally convert to domain names (works if reverse domain zones are defined).
')
This is the result on a zabbix server.
The picture shows the HP Procurve 2520 switch. With the help of vlans, seven subnets are defined on it: five are local and two are external to different Internet service providers. The two mac addresses below belong to the gateways of the providers. A machine with a demon does not look at external subnets, so the ip of the address is not defined. If there are a lot of devices on the port, for clarity, the entry “another switch” is displayed (if you prefer, it turns off).
But the story of one of the ports. An ip-phone and a computer are connected to it. It can be seen how the employee turned on the computer at the beginning of the day, worked, worked ... and then left early. Friday after all.
The daemon is called smonitor and is available on github.com :
git clone github.com/ifke/smonitor.gitFor debugging and error tracking, the daemon writes logs through the syslog service with the category daemon. In addition, it is planned to launch the program in debug mode, when demonization does not occur and all logs are output to the console. To do this, use the key - debug:
./smonitor.py --debugApplication settings are in the Settings.py file. There is also python code, but it consists only of the definition of variables, so it’s easy to figure out. For tips on the available options, see the Settings.py.sample.rus file. Since I use mostly ubuntu, the program has been tested on this distribution, and the installation instructions are only for it. The same applies to switches - I checked the daemon on what is available: HP Procurve 2520, HP Procurve 1700 and D-Link DES-3028. Judging by this information , the program will not work with Cisco equipment without doping, because snmp queries need to be done separately for each vlan.
The demon is not tied to zabbix. To make friends with another monitoring system, it is enough to rewrite one function responsible for sending the data. In fact, you can improve a lot more. For example, to solve the inverse problem, that is, to show for the hosts, to which port of which switch they are connected. To teach the daemon to determine how the switches are interconnected. Add import of matching mac and ip addresses from a file, then you can organize full monitoring without arp scanning, including networks to which the daemon does not have a direct connection (and the cache can be heated by ping requests using the list of ip addresses). In short, there are a lot of ideas if only there is enough time and energy to fight laziness.
Source: https://habr.com/ru/post/201812/
All Articles