Profiling and debugging Python, go to practice
In the last article, we defined the concepts of profiling and optimization, got acquainted with different approaches to profiling and types of tools. A little touched the history of profilers.
Today, I propose to move to practice and show examples of manual profiling methods (and even the “gaze method.” Tools for statistical profiling will also be considered.
What can be practice without examples and training? I have been thinking for a long time, which project should be taken as a textbook, so that it is both indicative and not very difficult. In my opinion, this is Project Euler , a collection of mathematical and computer puzzles, since for solving the proposed problems it is necessary to apply numerical algorithms and, without optimization, the search for an answer can last for years.
In general, I strongly advise you to solve puzzles from the "Project Euler." It helps to distract, meditate and relax, and at the same time keep your brain in good shape.
')
As an example for an article, take task 3 :
We write a simple solution "in the forehead":
An attentive or experienced reader will probably immediately call me a noob, call a few problems of this program and give a few recipes for its optimization, but we specifically took a simple example and pretend that we consider this code good, optimizing it in the course of action.
To check, run the program with a number, the divisors of which are known to us:
Answer 29, issued by the program is correct (it can be found in the statement of the problem). Hooray! Now we run the program with the number 600851475143 we are interested in:
And ... nothing happens. CPU utilization is 100%, program execution has not completed even after several hours of operation. We start to understand. We recall that you can only optimize the code that works correctly, but we checked the program on a small number and the answer was correct. Obviously, there is a performance problem and we need to start optimizing.
In real life, I would profile the program with an argument of 13195 (when its work time is adequate). But since we are training here and in general, just for jun, we will use the “gaze method.”
Open the code and carefully look at it. We understand (if we’re lucky, we understand quickly) that to search for divisors of the number N we don’t make sense to go through numbers from the interval sqrt (N) + 1 ... N-1 , since we already found all dividers from this range when searching numbers from interval 2 ... sqrt (N) . Slightly modify the code (see lines 9 and 18):
To check again run the program with a number, the dividers of which we know:
Subjectively, the program worked much faster, so we start it again with the number 600851475143 we are interested in:
We check the answer on the site, it turns out to be true, the problem is solved, we feel moral satisfaction.
The program was executed in an acceptable time (less than a minute), the answer is correct, there is no point in further optimization in this particular case, since We solved the task. As we remember, the most important thing in optimization is to be able to stop on time.
Yes, I am aware that the guys from Project Euler are asked not to post answers and solutions to the public. But the answer to task 3 is googling (for example, by the condition of “project euler problem 3 answer” at a time, so I think that there’s nothing wrong with the fact that I wrote the answer no.
One of the most common ways to quickly estimate "what's what." In the most elementary case, if we use the unix-utility “time” it looks like this (before optimization):
And so (after optimization):
Acceleration almost 65 times (from ~ 3.87 seconds to ~ 61 milliseconds)!
Also manual profiling may look like this:
Result:
Or using a special module " timeit ", which is designed to measure the speed of small programs. Application example:
When can manual profiling be used? First of all, this is a great way to conduct various kinds of competitions between developers (“My code is now faster than yours, so I’m a better programmer!”), And that’s good. Secondly, when it is required to “by eye” determine the program speed (20 seconds? Long!) Or get the results of the improvements achieved (accelerated the code 100 times!).
But the most important application is to collect statistics on the execution time of a code almost in real time right on production. For this, the measured time is sent to any system for collecting metrics and drawing graphs (I really like to use Graphite and StatsD as an aggregator for graphite).
To do this, you can use a simple context manager:
An example of its use:
Or a simple decorator:
An example of using a decorator:
At the output we get a timeline for the execution of the code section of interest, for example, this:

which always shows how the code feels on live servers, and whether it is time to optimize it. You can see how the code feels after the next release. If refactoring or optimization was carried out, the schedule allows you to assess the results in a timely manner and to understand whether the overall situation has improved or deteriorated.
There are drawbacks to the method, and the most important of them is the lack of dependence on the input data. Thus, for the function of determining the prime number “is_prime”, the execution time will strongly depend on the magnitude of this number, and if this function is called in the project very often, the schedule will be completely meaningless. It is important to clearly understand where what approach can be used and what we have at the output.
Of course, you can call the method of profiling through the collection of metrics in graphite "statistical", because we collect the statistics of the program. But I propose to adhere to the terminology adopted by us in the first part and by “statistical” profiling to understand precisely the collection of information (sampling) at certain intervals of time.
In the case of using graphite and an aggregating server ( StatsD ) for it, for one metric we get several graphs at once: the minimum and maximum code execution time, as well as the median and the number of recorded readings (function calls) per unit of time, which is very convenient. Let's see how easy it is to connect StatsD to Django.
We put the module:
Add settings in settings.py: application and middleware:
And that's it! At the output, we get the following graphics:

Pros and cons of StatsD:
+ easy to install and use
+ suitable for production (must-have, in general)
- little information (number / time)
- I need graphite and statsd (must-have too)
Unlike event profilers, there are few tools for statistical profiling. I will tell about three:
Perhaps the most famous statistical profiler under the python is statprof . We put:
We use, for example. So:
Or as a context manager (not in version 0.1.2 of pypi, only in the version from the repository ):
Let's try to profile our code:
We see two "hotspot" in our program. The first: lines 12 and 11 of the “is_prime” function (which is logical), their execution takes about 82% of the program’s time, and the second: line 21 of the “find_prime_factors” functions (about 17% of the time):
It is from this line that the “hottest” function of the “is_prime” program is called. Simply swapping the operands in the condition, we will significantly speed up the program, since the operation of obtaining the remainder of division (num% i) is performed faster than the “is_prime” function, and at the same time, quite often the remainder of dividing one number by another is not zero, and “not num% i” returns False. Thus, we will drastically reduce the number of calls to the is_prime function:
We start profiling:
The hottest place in our program is now line 21 of the “find_prime_factors” function, that is, the operation of obtaining the remainder of division (“num% i”). The “is_prime” function is now called much less frequently and runs only 5% of the time the program is running. The time of the program has decreased significantly and the largest prime divisor of the number 600851475143 is now just 0.25 seconds (accelerated the program almost 80 times).
Note how much the accuracy of the profiler operation fell: instead of 3575 samples (in the example before optimization) only 40 measurements were made and information was obtained about only five lines. Of course, this is not enough. Actually, this is a feature of statistical profilers: the more time we collect data, the more accurate the analysis. If we, for example, started the program ten or a hundred times, we would get much more accurate results.
The pros and cons of statprof:
+ minimal overhead projector
+ simple use
- implementation is quite raw and experimental
- Adequate analysis is needed for an adequate result.
- little output data
A separate point is worth noting django-live-profiler - profiler application Django, using statprof. For it to work, you must first install zeromq :
We put the module itself:
And run the aggregator:
Next, add the profiler in settings.py:
And in urls.py:
We start the server:
Open the profiler in the browser: 127.0.0.1 : 8000 / profiler / and enjoy life, watching the results of profiling a live project in real time:
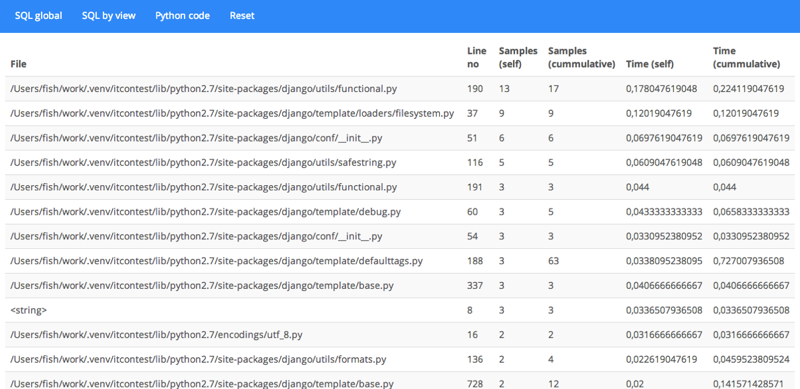
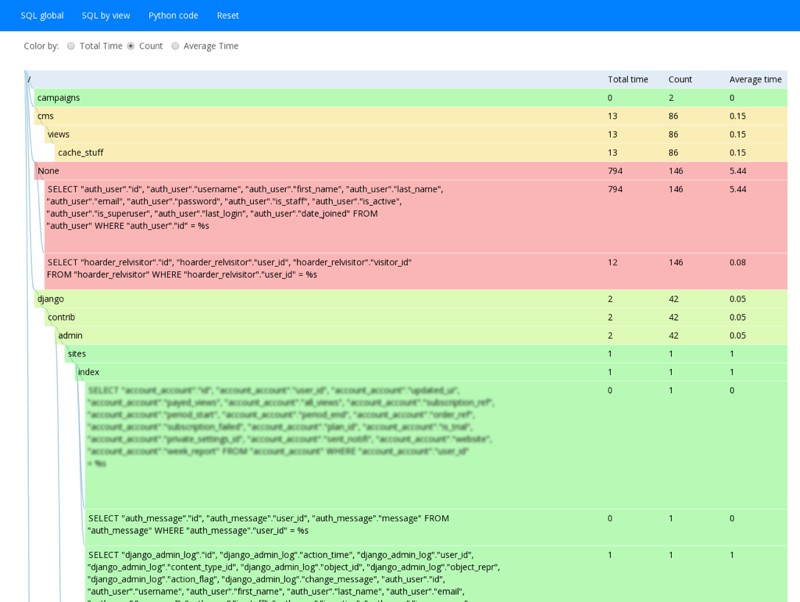
And django-live-profiler can show SQL queries:
Advantages and disadvantages of django-live-profiler:
+ small overhead
+ you can start in production (very carefully)
+ SQL query profiling
- complex installation, dependencies
- little output data
Another statistical profiler is called plop (Python Low-Overhead Profiler). The author immediately warns that the implementation of the raw and the project is under active development. Installation is trivial:
We start profiling:
Start the server to view the results:
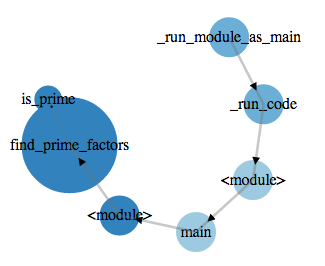
Open the page http: // localhost: 8888 / in the browser and admire the results:
Plop can be used to profile Django applications. To do this, install the django-plop package:
Add a settings.py middleware and a parameter that tells the profiler where to put the results:
In a large project, the graph will look more impressive:
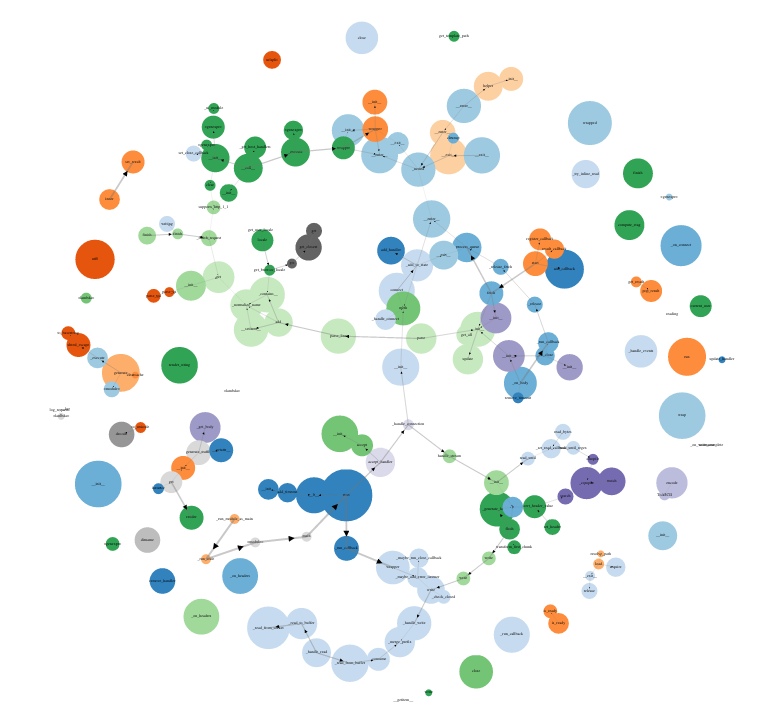
The picture is quite psychedelic, it is difficult to call it a serious profiling tool, but nevertheless we have a call graph, the hottest parts of the code can be seen, the overhead is minimal (according to the authors only 2%), and in some cases this tool is enough to detect areas code needing profiling. Dropbox uses plop right in production, and that says a lot.
Advantages and disadvantages of plop:
+ minimal overhead projector
+ can be started in production
- complex installation, dependencies
- very little output data
Speaking of statistical profilers, it is impossible not to say about the New Relic service, which is intended not only for profiling, but also for monitoring servers and web applications (as well as mobile versions). Those interested can see all the information on the company's website, as well as try the service for free. I will not talk about him because I personally have not tried working with New Relic, and I used to talk only about those things that I tried myself. You can see screenshots on the page dedicated to the profiler.
Advantages and disadvantages:
+ intended for production
+ many different functional (not only profiling)
- paid (there is a free version)
- data is sent to other servers
In the next article, we turn to the study of event profilers - the main tools for profiling Python. Stay in touch!
Today, I propose to move to practice and show examples of manual profiling methods (and even the “gaze method.” Tools for statistical profiling will also be considered.
- Introduction and theory - why do you need profiling, different approaches, tools and differences between them?
- Manual and statistical profiling - go to practice
- Event Profiling - tools and their use
- Debugging - what to do when nothing works
Train
What can be practice without examples and training? I have been thinking for a long time, which project should be taken as a textbook, so that it is both indicative and not very difficult. In my opinion, this is Project Euler , a collection of mathematical and computer puzzles, since for solving the proposed problems it is necessary to apply numerical algorithms and, without optimization, the search for an answer can last for years.
In general, I strongly advise you to solve puzzles from the "Project Euler." It helps to distract, meditate and relax, and at the same time keep your brain in good shape.
')
As an example for an article, take task 3 :
The prime divisors of 13195 are 5, 7, 13, and 29.
What is the biggest divisor of the number 600851475143, which is a prime number?
We write a simple solution "in the forehead":
"""Project Euler problem 3 solve""" from __future__ import print_function import sys def is_prime(num): """Checks if num is prime number""" for i in range(2, num): if not num % i: return False return True def find_prime_factors(num): """Find prime factors of num""" result = [] for i in range(2, num): if is_prime(i) and not num % i: result.append(i) return result if __name__ == '__main__': try: num = int(sys.argv[1]) except (TypeError, ValueError, IndexError): sys.exit("Usage: euler_3.py number") if num < 1: sys.exit("Error: number must be greater than zero") prime_factors = find_prime_factors(num) if len(prime_factors) == 0: print("Can't find prime factors of %d" % num) else: print("Answer: %d" % prime_factors[-1]) An attentive or experienced reader will probably immediately call me a noob, call a few problems of this program and give a few recipes for its optimization, but we specifically took a simple example and pretend that we consider this code good, optimizing it in the course of action.
To check, run the program with a number, the divisors of which are known to us:
rudnyh @ work : ~ / work / python-profiling (venv: python-profiling )
➜ python euler_3.py 13195
Answer: 29
Answer 29, issued by the program is correct (it can be found in the statement of the problem). Hooray! Now we run the program with the number 600851475143 we are interested in:
rudnyh @ work : ~ / work / python-profiling (venv: python-profiling )
➜ python euler_3.py 600851475143
And ... nothing happens. CPU utilization is 100%, program execution has not completed even after several hours of operation. We start to understand. We recall that you can only optimize the code that works correctly, but we checked the program on a small number and the answer was correct. Obviously, there is a performance problem and we need to start optimizing.
Gaze method
In real life, I would profile the program with an argument of 13195 (when its work time is adequate). But since we are training here and in general, just for jun, we will use the “gaze method.”
Open the code and carefully look at it. We understand (if we’re lucky, we understand quickly) that to search for divisors of the number N we don’t make sense to go through numbers from the interval sqrt (N) + 1 ... N-1 , since we already found all dividers from this range when searching numbers from interval 2 ... sqrt (N) . Slightly modify the code (see lines 9 and 18):
"""Project Euler problem 3 solve""" from __future__ import print_function import math import sys def is_prime(num): """Checks if num is prime number""" for i in range(2, int(math.sqrt(num)) + 1): if not num % i: return False return True def find_prime_factors(num): """Find prime factors of num""" result = [] for i in range(1, int(math.sqrt(num)) + 1): if is_prime(i) and not num % i: result.append(i) if is_prime(num): result.append(i) return result if __name__ == '__main__': try: num = int(sys.argv[1]) except (TypeError, ValueError, IndexError): sys.exit("Usage: euler_3.py number") if num < 1: sys.exit("Error: number must be greater than zero") prime_factors = find_prime_factors(num) if len(prime_factors) == 0: print("Can't find prime factors of %d" % num) else: print("Answer: %d" % prime_factors[-1]) To check again run the program with a number, the dividers of which we know:
rudnyh @ work : ~ / work / python-profiling (venv: python-profiling )
➜ python euler_3.py 13195
Answer: 29
Subjectively, the program worked much faster, so we start it again with the number 600851475143 we are interested in:
rudnyh @ work : ~ / work / python-profiling (venv: python-profiling )
➜ python euler_3.py 600851475143
Answer: 6857
We check the answer on the site, it turns out to be true, the problem is solved, we feel moral satisfaction.
The program was executed in an acceptable time (less than a minute), the answer is correct, there is no point in further optimization in this particular case, since We solved the task. As we remember, the most important thing in optimization is to be able to stop on time.
Yes, I am aware that the guys from Project Euler are asked not to post answers and solutions to the public. But the answer to task 3 is googling (for example, by the condition of “project euler problem 3 answer” at a time, so I think that there’s nothing wrong with the fact that I wrote the answer no.
Manual profiling
One of the most common ways to quickly estimate "what's what." In the most elementary case, if we use the unix-utility “time” it looks like this (before optimization):
rudnyh @ work : ~ / work / python-profiling (venv: python-profiling )
➜ time python euler_3.py 13195
Answer: 29
python euler_3.py 13195 3.83s user 0.03s system 99% cpu 3.877 total
And so (after optimization):
rudnyh @ work : ~ / work / python-profiling (venv: python-profiling )
➜ time python euler_3.py 13195
Answer: 29
python euler_3.py 13195 0.03s user 0.02s system 90% cpu 0.061 total
Acceleration almost 65 times (from ~ 3.87 seconds to ~ 61 milliseconds)!
Also manual profiling may look like this:
import time ... start = time.time() prime_factors = find_prime_factors(num) print("Time: %.03f s" % (time.time() - start)) Result:
rudnyh @ work : ~ / work / python-profiling (venv: python-profiling )
➜ python euler_3.py 600851475143
Answer: 6857
Time: 19.811 s
Or using a special module " timeit ", which is designed to measure the speed of small programs. Application example:
rudnyh @ work : ~ / work / python-profiling (venv: python-profiling )
➜ python -m timeit -n 10 -s'import euler_3 '' euler_3.find_prime_factors (600851475143) '
10 loops, best of 3: 21.3 sec per loop
When can manual profiling be used? First of all, this is a great way to conduct various kinds of competitions between developers (“My code is now faster than yours, so I’m a better programmer!”), And that’s good. Secondly, when it is required to “by eye” determine the program speed (20 seconds? Long!) Or get the results of the improvements achieved (accelerated the code 100 times!).
But the most important application is to collect statistics on the execution time of a code almost in real time right on production. For this, the measured time is sent to any system for collecting metrics and drawing graphs (I really like to use Graphite and StatsD as an aggregator for graphite).
To do this, you can use a simple context manager:
"""Collect profiling statistic into graphite""" import socket import time CARBON_SERVER = '127.0.0.1' CARBON_PORT = 2003 class Stats(object): """Context manager for send stats to graphite""" def __init__(self, name): self.name = name def __enter__(self): self.start = time.time() return self def __exit__(self, *args): duration = (time.time() - self.start) * 1000 # msec message = '%s %d %d\n' % (self.name, duration, time.time()) sock = socket.socket() sock.connect((CARBON_SERVER, CARBON_PORT)) sock.sendall(message) sock.close() An example of its use:
from python_profiling.context_managers import Stats ... with Stats('project.application.some_action'): do_some_action() Or a simple decorator:
"""Collect profiling statistic into graphite""" import socket import time CARBON_SERVER = '127.0.0.1' CARBON_PORT = 2003 def stats(name): """Decorator for send stats to graphite""" def _timing(func): def _wrapper(*args, **kwargs): start = time.time() result = func(*args, **kwargs) duration = (time.time() - start) * 1000 # msec message = '%s %d %d\n' % (name, duration, time.time()) sock = socket.socket() sock.connect((CARBON_SERVER, CARBON_PORT)) sock.sendall(message) sock.close() return result return _wrapper return _timing An example of using a decorator:
from python_profiling.decorators import stats ... @stats('project.application.some_action') def do_some_action(): """Doing some useful action""" At the output we get a timeline for the execution of the code section of interest, for example, this:
which always shows how the code feels on live servers, and whether it is time to optimize it. You can see how the code feels after the next release. If refactoring or optimization was carried out, the schedule allows you to assess the results in a timely manner and to understand whether the overall situation has improved or deteriorated.
There are drawbacks to the method, and the most important of them is the lack of dependence on the input data. Thus, for the function of determining the prime number “is_prime”, the execution time will strongly depend on the magnitude of this number, and if this function is called in the project very often, the schedule will be completely meaningless. It is important to clearly understand where what approach can be used and what we have at the output.
Of course, you can call the method of profiling through the collection of metrics in graphite "statistical", because we collect the statistics of the program. But I propose to adhere to the terminology adopted by us in the first part and by “statistical” profiling to understand precisely the collection of information (sampling) at certain intervals of time.
Django statsd
In the case of using graphite and an aggregating server ( StatsD ) for it, for one metric we get several graphs at once: the minimum and maximum code execution time, as well as the median and the number of recorded readings (function calls) per unit of time, which is very convenient. Let's see how easy it is to connect StatsD to Django.
We put the module:
➜ pip install django-statsd-mozilla
Add settings in settings.py: application and middleware:
INSTALLED_APPS += ('django_statsd',) MIDDLEWARE_CLASSES += ( 'django_statsd.middleware.GraphiteRequestTimingMiddleware', 'django_statsd.middleware.GraphiteMiddleware', ) # send DB timings STATSD_PATCHES = ['django_statsd.patches.db'] And that's it! At the output, we get the following graphics:
Pros and cons of StatsD:
+ easy to install and use
+ suitable for production (must-have, in general)
- little information (number / time)
- I need graphite and statsd (must-have too)
Statistical profilers
Unlike event profilers, there are few tools for statistical profiling. I will tell about three:
StatProf
Perhaps the most famous statistical profiler under the python is statprof . We put:
➜ pip install statprof
We use, for example. So:
import statprof ... statprof.start() try: do_some_action() finally: statprof.stop() statprof.display() Or as a context manager (not in version 0.1.2 of pypi, only in the version from the repository ):
import statprof ... with statprof.profile(): do_some_action() Let's try to profile our code:
rudnyh @ work : ~ / work / python-profiling (venv: python-profiling )
➜ python euler_3.py 600851475143
% cumulative self
time seconds seconds name
44.42 8.63 8.63 euler_3.py:12:is_prime
37.12 7.21 7.21 euler_3.py:11:is_prime
16.90 19.40 3.28 euler_3.py:21:find_prime_factors
0.95 0.18 0.18 euler_3.py:9:is_prime
0.48 0.09 0.09 euler_3.py:13:is_prime
0.06 0.01 0.01 euler_3.py:14:is_prime
0.06 0.01 0.01 euler_3.py:20:find_prime_factors
0.03 0.01 0.01 euler_3.py:23:find_prime_factors
0.00 19.42 0.00 euler_3.py:37: <module>
- Sample count: 3575
Total time: 19.420000 seconds
Answer: 6857
We see two "hotspot" in our program. The first: lines 12 and 11 of the “is_prime” function (which is logical), their execution takes about 82% of the program’s time, and the second: line 21 of the “find_prime_factors” functions (about 17% of the time):
if is_prime(i) and not num % i: It is from this line that the “hottest” function of the “is_prime” program is called. Simply swapping the operands in the condition, we will significantly speed up the program, since the operation of obtaining the remainder of division (num% i) is performed faster than the “is_prime” function, and at the same time, quite often the remainder of dividing one number by another is not zero, and “not num% i” returns False. Thus, we will drastically reduce the number of calls to the is_prime function:
if not num % i and is_prime(i): We start profiling:
rudnyh @ work : ~ / work / python-profiling (venv: python-profiling )
➜ python euler_3.py 600851475143
% cumulative self
time seconds seconds name
87.50 0.22 0.22 euler_3.py:21:find_prime_factors
5.00 0.01 0.01 euler_3.py:20:find_prime_factors
5.00 0.01 0.01 euler_3.py:11:is_prime
2.50 0.01 0.01 euler_3.py:23:find_prime_factors
0.00 0.25 0.00 euler_3.py:37: <module>
- Sample count: 40
Total time: 0.250000 seconds
Answer: 6857
The hottest place in our program is now line 21 of the “find_prime_factors” function, that is, the operation of obtaining the remainder of division (“num% i”). The “is_prime” function is now called much less frequently and runs only 5% of the time the program is running. The time of the program has decreased significantly and the largest prime divisor of the number 600851475143 is now just 0.25 seconds (accelerated the program almost 80 times).
Note how much the accuracy of the profiler operation fell: instead of 3575 samples (in the example before optimization) only 40 measurements were made and information was obtained about only five lines. Of course, this is not enough. Actually, this is a feature of statistical profilers: the more time we collect data, the more accurate the analysis. If we, for example, started the program ten or a hundred times, we would get much more accurate results.
Here I must make a small lyrical digression.
99% of all auxiliary utilities, such as profilers or code coverage analysis tools, work with strings as the minimum unit of information. Thus, if we try to write the code as compactly as possible, like this:
we cannot see in the profiler which function was called and which one was not. And in the coverage report, we will not see if a particular scenario is covered with tests. Despite the more familiar and seemingly convenient code, in some cases it is still better to write this:
and then we will immediately see which lines are not executed, and which lines are executed (and how often). One-liners and compactness are, of course, nice and fun, but sometimes it is better to spend more time and get code that is easier to profile, test and maintain.
result = foo() if bar else baz() we cannot see in the profiler which function was called and which one was not. And in the coverage report, we will not see if a particular scenario is covered with tests. Despite the more familiar and seemingly convenient code, in some cases it is still better to write this:
if bar: result = foo() else: result = baz() and then we will immediately see which lines are not executed, and which lines are executed (and how often). One-liners and compactness are, of course, nice and fun, but sometimes it is better to spend more time and get code that is easier to profile, test and maintain.
The pros and cons of statprof:
+ minimal overhead projector
+ simple use
- implementation is quite raw and experimental
- Adequate analysis is needed for an adequate result.
- little output data
Django-live-profiler
A separate point is worth noting django-live-profiler - profiler application Django, using statprof. For it to work, you must first install zeromq :
➜ brew install zmq
We put the module itself:
➜ pip install django-live-profiler
And run the aggregator:
➜ aggregated --host 127.0.0.1 --port 5556
Next, add the profiler in settings.py:
# application INSTALLED_APPS += ('profiler',) # middleware MIDDLEWARE_CLASSES += ( 'profiler.middleware.ProfilerMiddleware', 'profiler.middleware.StatProfMiddleware', ) And in urls.py:
url(r'^profiler/', include('profiler.urls')) We start the server:
➜ python manage.py runserver --noreload --nothreading
Open the profiler in the browser: 127.0.0.1 : 8000 / profiler / and enjoy life, watching the results of profiling a live project in real time:
And django-live-profiler can show SQL queries:
Advantages and disadvantages of django-live-profiler:
+ small overhead
+ you can start in production (very carefully)
+ SQL query profiling
- complex installation, dependencies
- little output data
Plop
Another statistical profiler is called plop (Python Low-Overhead Profiler). The author immediately warns that the implementation of the raw and the project is under active development. Installation is trivial:
➜ pip install plop tornado
We start profiling:
rudnyh @ work : ~ / work / python-profiling (venv: python-profiling )
➜ python -m plop.collector euler_3.py 600851475143
Answer: 6857
profile output saved to /tmp/plop.out
overhead was 5.89810884916e-05 per sample (0.00589810884916%)
Start the server to view the results:
➜ python -m plop.viewer --datadir = / tmp /
Open the page http: // localhost: 8888 / in the browser and admire the results:
Plop can be used to profile Django applications. To do this, install the django-plop package:
➜ pip install django-plop
Add a settings.py middleware and a parameter that tells the profiler where to put the results:
MIDDLEWARE_CLASSES += ( 'django-plop.middleware.PlopMiddleware', ) PLOP_DIR = os.path.join(PROJECT_ROOT, 'plop') In a large project, the graph will look more impressive:
The picture is quite psychedelic, it is difficult to call it a serious profiling tool, but nevertheless we have a call graph, the hottest parts of the code can be seen, the overhead is minimal (according to the authors only 2%), and in some cases this tool is enough to detect areas code needing profiling. Dropbox uses plop right in production, and that says a lot.
Advantages and disadvantages of plop:
+ minimal overhead projector
+ can be started in production
- complex installation, dependencies
- very little output data
New relic
Speaking of statistical profilers, it is impossible not to say about the New Relic service, which is intended not only for profiling, but also for monitoring servers and web applications (as well as mobile versions). Those interested can see all the information on the company's website, as well as try the service for free. I will not talk about him because I personally have not tried working with New Relic, and I used to talk only about those things that I tried myself. You can see screenshots on the page dedicated to the profiler.
Advantages and disadvantages:
+ intended for production
+ many different functional (not only profiling)
- paid (there is a free version)
- data is sent to other servers
In the next article, we turn to the study of event profilers - the main tools for profiling Python. Stay in touch!
Source: https://habr.com/ru/post/201778/
All Articles