Profiling and Debugging Python
Some time ago, I talked about " Profiling and debugging Django ." After the speech, I received a lot of questions (both personally and by email), we even went to a bar with a couple of new acquaintances to discuss important programming problems behind a glass of excellent ale, and I continue to communicate with many people until now.
Since the presentation aroused a keen interest, and conversations with colleagues allowed me to rethink some points of the presentation and correct the mistakes, I decided to issue a report and my thoughts in the form of an article. This will allow you to familiarize yourself with the topic to a much larger circle of interested persons, besides, Habr provides the ideal platform for commenting on the proposed material and communicating with interesting interlocutors.
There is a lot of material, the article turned out to be huge, so I decided to split it into several parts:
First of all, you need to understand the definitions. We read in Wikipedia:
')
Profiling - collecting the characteristics of the program in order to further optimize them.
So, for profiling, we need a working program, and working not quite the way we would like: either working too slowly, or consuming too many resources.
What are the characteristics of the program can be collected?
Of course, it does not always make sense to study the project in detail under a microscope, examining each instruction and studying everything thoroughly, but knowing what, how and where we can see is useful and necessary.
Let's define the concept of "optimization". Wikipedia tells us that:
Optimization is a modification of the system to improve its efficiency.
The concept of "efficiency" is very vague and directly depends on the goal, for example, in some cases the program should run as fast as possible, in others the speed can be neglected and it is much more important to save RAM or other resources (such as disk). As Frederick Brooks rightly said , "a silver bullet does not exist."
Obviously, the program can be optimized indefinitely: in any fairly complex project there will always be a bottleneck that can be improved, so it is important to be able to stop on time. In most cases (exceptions are extremely rare and relate rather to folklore than to real life) it makes no sense to spend, say, three days of working time for the sake of 5% gain in speed.
On the other hand, as Donald Knut used to repeat: “Premature optimization is the root of all evils.”
What article about optimization does without this quote? Many believe that its author is Donald Knut, but Donald himself claims that it was first said by Anthony Hoar. Anthony, on the other hand, unlocks and suggests that the statement should be considered “universal property”.
It is important to clearly understand what exactly does not suit us in the work of the program and what goals we want to achieve, but this does not mean that profiling and subsequent optimization should be done when everything starts to slow down. A good programmer always knows how a program written by him feels and predicts its performance in critical situations (such as habra effect).
I want to note another important point: often the optimization is accompanied by a significant deterioration in the readability of the code. If possible, try to avoid this, and if you still had to write less readable code in critical places, do not be lazy and leave a comment with a detailed description of his work. Your colleagues will thank you, and you yourself will find yourself surprisingly insightful when you return to these lines in a while.
I will no longer touch upon the question of optimization, because, as I said above, everything very much depends on the task and each case must be disassembled separately. Focus on the detection of problem areas of the program.
There are at least three approaches to profiling:
Everything is clear with the gaze method (and its related “ spear method ”). Just sit in front of a text editor, open the code and think about where the problem might be, try to fix it, look at the result, roll back. And only in rare cases ( or with the highest qualification of the developer ) is the method effective.
Advantages and disadvantages of this method:
+ does not require special knowledge and skills
- it is difficult to estimate labor costs and results
Manual profiling is convenient to use when there is a reasonable assumption about bottlenecks and it is required to confirm or deny the hypothesis. Or, if we, in contrast to the first method, need to obtain numerical indicators of the results of our optimization (for example, the function was performed for 946 milliseconds, began to work for 73 milliseconds, accelerated the code 13 times).
The essence of this method is as follows: before executing the disputed part of the program, we save the current system time (up to microseconds) into a variable, and then we re-receive the current time and subtract the value of the saved variable from it. We get (with enough error for us) the execution time of the analyzed code. For a reliable result, repeat N times and take the average value.
Advantages and disadvantages of this method:
+ very simple application
+ limited for production
- insert "alien" code in the project
- use is not always possible
- no information about the program, except the execution time of the analyzed area
- analysis of results may be difficult
Profiling with the help of tools helps when we (for one reason or another) do not know why the program does not work as it should, or when we are too lazy to use manual profiling and analyze its results. More on the tools in the next section.
I must say that regardless of the approach chosen, the main tool of the developer is his brain. No program (for now (?) ) Will say:
Hey, do you have nonsense written in line 619 of the project / app.py file! Bring the call to that function out of the loop and you will be happy. And also, if you use caching, and rewrite the calculate function on C, then the speed will increase by an average of 18 times!
There are two types of tools (in fact, there are more options for classification and terminology, but we will limit ourselves to two):
Unfortunately, I could not come up with a beautiful name in Russian for a "deterministic" profiler, so I will use the word "event". I would be grateful if someone corrected me in the comments.
Most developers are familiar only with event profilers, and a big surprise for them is the fact that the statistical profiler appeared first: in the early seventies of the last century, programmers of IBM / 360 and IBM / 370 computers set a timer interrupt, which recorded the current value of Program status word (Psw) Further analysis of the stored data made it possible to determine the problem areas of the program.
The first event profiler appeared at the end of the same seventies, it was the Unix prof OS utility, which showed the execution time of all program functions. A few years later (1982), the gprof utility appeared, which learned how to display the function call graph.
The principle of operation of the statistical profiler is simple: at specified (rather small) intervals, a pointer is taken to the current instruction being executed and saves this information (“samples”) for further study. It looks like this:
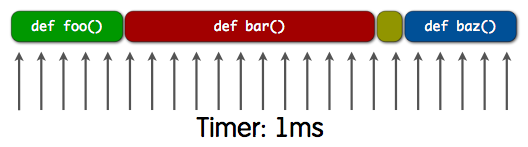
apparently, the function bar () was performed almost two and a half times longer than the functions foo () , baz () and some unnamed instruction.
One of the drawbacks of the statistical profiler is that in order to obtain adequate statistics on the program's work, it is necessary to carry out as much as possible (ideally - an infinite) number of measurements with as short an interval as possible. Otherwise, some calls may not be analyzed at all:
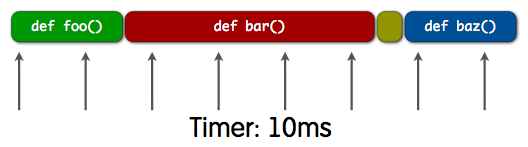
for example, the figure shows that the nameless function was not included in the sample.
It is also difficult to estimate the real time of the analyzed functions. Consider a situation where the foo () function executes fairly quickly, but is called very often:
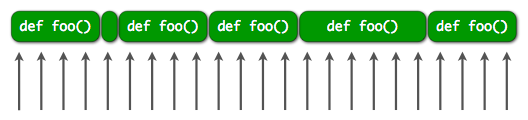
and a situation where the foo () function runs for a very long time, but is called only once:

The result of the statistical profiler will be the same in both cases.
Nevertheless, the statistical profiler copes great with the search for the most "heavy" and "hot" places of the program, and its minimal impact on the analyzed program (and, as a result, its suitability for production) negates all the drawbacks. In addition, Python allows you to get the full stacktrace for code when sampling and analyzing it allows you to get a more complete and detailed picture.
Advantages and disadvantages of the statistical profiler:
+ can be started up in production (the effect on the program being analyzed is minimal)
- we get far from all the information about the code (in fact, only “hot spots”)
- incorrect interpretation of the result is possible
- it takes a long time to collect adequate statistics
- few tools for analysis
The event profiler tracks all function calls, returns, exceptions, and measures the intervals between these events. The measured time (along with information on the relevant parts of the code and the number of calls) is saved for further analysis.

The most important drawback of such profilers directly follows from the principle of their work: since we intervene in the program being analyzed at every step , the process of its execution can (and will) be very different from the “usual” working conditions (just like in quantum mechanics). For example, in some cases, it is possible that the program will slow down two or more times. Of course, in the production of releasing this can only be in the case of despair and complete hopelessness.
Nevertheless, the pros outweigh the cons, otherwise there would not be such a huge variety of different tools. Viewing the results in a user-friendly interface with the ability to analyze the execution time and the number of calls on each line of the program cost a lot, the call graph helps to detect flaws in the algorithms used.
Advantages and disadvantages of event profilers:
+ no code change required
+ get all the information about the program
+ huge amount of tools
- in some cases the profiler changes the behavior of the program
- So slow
- practically unsuitable for production
In the next article, we will practice manual profiling and statistical profilers in practice. Stay in touch =)
Since the presentation aroused a keen interest, and conversations with colleagues allowed me to rethink some points of the presentation and correct the mistakes, I decided to issue a report and my thoughts in the form of an article. This will allow you to familiarize yourself with the topic to a much larger circle of interested persons, besides, Habr provides the ideal platform for commenting on the proposed material and communicating with interesting interlocutors.
There is a lot of material, the article turned out to be huge, so I decided to split it into several parts:
- Introduction and theory - why do you need profiling, different approaches, tools and differences between them?
- Manual and statistical profiling - go to practice
- Event Profiling - tools and their use
- Debugging - what to do when nothing works
Introduction
First of all, you need to understand the definitions. We read in Wikipedia:
')
Profiling - collecting the characteristics of the program in order to further optimize them.
So, for profiling, we need a working program, and working not quite the way we would like: either working too slowly, or consuming too many resources.
What are the characteristics of the program can be collected?
- execution time of individual lines of code (instructions)
- the number of calls and the execution time of individual functions
- function call tree
- “ Hot spots ” (code areas that account for a significant proportion of instructions executed)
- CPU load and memory consumption
- access to other computer resources (for example, file descriptors)
- etc. etc.
Of course, it does not always make sense to study the project in detail under a microscope, examining each instruction and studying everything thoroughly, but knowing what, how and where we can see is useful and necessary.
Let's define the concept of "optimization". Wikipedia tells us that:
Optimization is a modification of the system to improve its efficiency.
The concept of "efficiency" is very vague and directly depends on the goal, for example, in some cases the program should run as fast as possible, in others the speed can be neglected and it is much more important to save RAM or other resources (such as disk). As Frederick Brooks rightly said , "a silver bullet does not exist."
Obviously, the program can be optimized indefinitely: in any fairly complex project there will always be a bottleneck that can be improved, so it is important to be able to stop on time. In most cases (exceptions are extremely rare and relate rather to folklore than to real life) it makes no sense to spend, say, three days of working time for the sake of 5% gain in speed.
On the other hand, as Donald Knut used to repeat: “Premature optimization is the root of all evils.”
What article about optimization does without this quote? Many believe that its author is Donald Knut, but Donald himself claims that it was first said by Anthony Hoar. Anthony, on the other hand, unlocks and suggests that the statement should be considered “universal property”.
It is important to clearly understand what exactly does not suit us in the work of the program and what goals we want to achieve, but this does not mean that profiling and subsequent optimization should be done when everything starts to slow down. A good programmer always knows how a program written by him feels and predicts its performance in critical situations (such as habra effect).
I want to note another important point: often the optimization is accompanied by a significant deterioration in the readability of the code. If possible, try to avoid this, and if you still had to write less readable code in critical places, do not be lazy and leave a comment with a detailed description of his work. Your colleagues will thank you, and you yourself will find yourself surprisingly insightful when you return to these lines in a while.
I will no longer touch upon the question of optimization, because, as I said above, everything very much depends on the task and each case must be disassembled separately. Focus on the detection of problem areas of the program.
Approaches to profiling
There are at least three approaches to profiling:
- gaze method
- manual profiling
- using tools
Everything is clear with the gaze method (and its related “ spear method ”). Just sit in front of a text editor, open the code and think about where the problem might be, try to fix it, look at the result, roll back. And only in rare cases ( or with the highest qualification of the developer ) is the method effective.
Advantages and disadvantages of this method:
+ does not require special knowledge and skills
- it is difficult to estimate labor costs and results
Manual profiling is convenient to use when there is a reasonable assumption about bottlenecks and it is required to confirm or deny the hypothesis. Or, if we, in contrast to the first method, need to obtain numerical indicators of the results of our optimization (for example, the function was performed for 946 milliseconds, began to work for 73 milliseconds, accelerated the code 13 times).
The essence of this method is as follows: before executing the disputed part of the program, we save the current system time (up to microseconds) into a variable, and then we re-receive the current time and subtract the value of the saved variable from it. We get (with enough error for us) the execution time of the analyzed code. For a reliable result, repeat N times and take the average value.
Advantages and disadvantages of this method:
+ very simple application
+ limited for production
- insert "alien" code in the project
- use is not always possible
- no information about the program, except the execution time of the analyzed area
- analysis of results may be difficult
Profiling with the help of tools helps when we (for one reason or another) do not know why the program does not work as it should, or when we are too lazy to use manual profiling and analyze its results. More on the tools in the next section.
I must say that regardless of the approach chosen, the main tool of the developer is his brain. No program (for now (?) ) Will say:
Hey, do you have nonsense written in line 619 of the project / app.py file! Bring the call to that function out of the loop and you will be happy. And also, if you use caching, and rewrite the calculate function on C, then the speed will increase by an average of 18 times!
What are the tools
There are two types of tools (in fact, there are more options for classification and terminology, but we will limit ourselves to two):
- statistical profiler
- event (deterministic, event-based) profiler
Unfortunately, I could not come up with a beautiful name in Russian for a "deterministic" profiler, so I will use the word "event". I would be grateful if someone corrected me in the comments.
Most developers are familiar only with event profilers, and a big surprise for them is the fact that the statistical profiler appeared first: in the early seventies of the last century, programmers of IBM / 360 and IBM / 370 computers set a timer interrupt, which recorded the current value of Program status word (Psw) Further analysis of the stored data made it possible to determine the problem areas of the program.
The first event profiler appeared at the end of the same seventies, it was the Unix prof OS utility, which showed the execution time of all program functions. A few years later (1982), the gprof utility appeared, which learned how to display the function call graph.
Statistical profiler
The principle of operation of the statistical profiler is simple: at specified (rather small) intervals, a pointer is taken to the current instruction being executed and saves this information (“samples”) for further study. It looks like this:
apparently, the function bar () was performed almost two and a half times longer than the functions foo () , baz () and some unnamed instruction.
One of the drawbacks of the statistical profiler is that in order to obtain adequate statistics on the program's work, it is necessary to carry out as much as possible (ideally - an infinite) number of measurements with as short an interval as possible. Otherwise, some calls may not be analyzed at all:
for example, the figure shows that the nameless function was not included in the sample.
It is also difficult to estimate the real time of the analyzed functions. Consider a situation where the foo () function executes fairly quickly, but is called very often:
and a situation where the foo () function runs for a very long time, but is called only once:
The result of the statistical profiler will be the same in both cases.
Nevertheless, the statistical profiler copes great with the search for the most "heavy" and "hot" places of the program, and its minimal impact on the analyzed program (and, as a result, its suitability for production) negates all the drawbacks. In addition, Python allows you to get the full stacktrace for code when sampling and analyzing it allows you to get a more complete and detailed picture.
Advantages and disadvantages of the statistical profiler:
+ can be started up in production (the effect on the program being analyzed is minimal)
- we get far from all the information about the code (in fact, only “hot spots”)
- incorrect interpretation of the result is possible
- it takes a long time to collect adequate statistics
- few tools for analysis
Event Profiler
The event profiler tracks all function calls, returns, exceptions, and measures the intervals between these events. The measured time (along with information on the relevant parts of the code and the number of calls) is saved for further analysis.
The most important drawback of such profilers directly follows from the principle of their work: since we intervene in the program being analyzed at every step , the process of its execution can (and will) be very different from the “usual” working conditions (just like in quantum mechanics). For example, in some cases, it is possible that the program will slow down two or more times. Of course, in the production of releasing this can only be in the case of despair and complete hopelessness.
Nevertheless, the pros outweigh the cons, otherwise there would not be such a huge variety of different tools. Viewing the results in a user-friendly interface with the ability to analyze the execution time and the number of calls on each line of the program cost a lot, the call graph helps to detect flaws in the algorithms used.
Advantages and disadvantages of event profilers:
+ no code change required
+ get all the information about the program
+ huge amount of tools
- in some cases the profiler changes the behavior of the program
- So slow
- practically unsuitable for production
In the next article, we will practice manual profiling and statistical profilers in practice. Stay in touch =)
Source: https://habr.com/ru/post/201594/
All Articles