Zabbix 2.2 released

I am very pleased to announce that today a new version of the open monitoring system Zabbix 2.2 has been released. I want to thank our team, users and an active community of our friends. Thank you all for your work and active participation!
What is Zabbix?
Zabbix is a distributed monitoring system. Zabbix is a completely free (Open Source) solution without any paid versions or extensions.
')
Zabbix is able to monitor hundreds of thousands of devices, applications and services, collect hundreds of gigabytes of historical information per day and produce millions of availability and performance checks per minute.
Zabbix is used throughout the world in various industries, including the largest European banks and financial institutions, integrators, IT and telecommunications companies and well-known universities.
The main differences of Zabbixa from other monitoring systems are wide functionality, openness, scalable architecture, the ability to collect and analyze a huge flow of information in real time. Our priorities are quality and ease of support.
The first version of Zabbix was released in 2001, currently being developed by a team of professionals. Our head office is in Riga and there is a subsidiary in Tokyo, Japan. We develop and provide commercial services to our customers: technical support at various levels, training, development of new functionality, turnkey solutions, and more. This is how we grow and develop.
So, what's new in Zabbix 2.2?
Performance improvement
Traditionally, each new version of Zabbix improves performance and Zabbix 2.2 is no exception.
According to our modest estimates, Zabbix 2.2 is able to perform 2-5 times more availability and performance checks compared to 2.0. We expect that Zabbix 2.2 is able to perform about 3 million checks per minute and this is without using a proxy! This is sufficient, for example, to monitor 30 thousand devices with 100 checks on each device performed once a minute.

To calculate the triggers, the caching of historical data in memory is used, which significantly speeds up the processing of triggers. The more complex the triggers you use, the more significant the performance gain will be, because the information will be taken from memory without using the database.
In addition, unlike Zabbix 2.0, the new version does not immediately make changes to the database when it receives new information. This reduces the number of requests at least twice and significantly improves performance.
Built-in VMWare monitoring
Implemented VMWare monitoring including vCenter and vSphere. It supports monitoring of availability and performance (CPU / memory / swap / disk), as well as automatic detection of both hypervisor and virtual machines. This is implemented using the native VMWare API without the participation of Zabbix agents. Zabbix also understands and correctly handles the migration of virtual machines from one hypervisor to another.

Loadable module support
This is one of the steps aimed at creating a fully modular architecture at all levels and allows you to extend the functionality using loadable modules developed either by yourself or by third-party developers.

Modules can be used both for implementing new high-performance checks for the agent and for new agentless checks on the server side. Learn C or C ++, read documentation and blogs !
Web Monitoring Improvements
An important improvement is the support of templates for Web scenarios, which allows you to easily and quickly configure monitoring of tens, hundreds or thousands of similar applications. This can be useful for controlling the availability and performance of Web applications to companies providing services on ASP, SAAS and PAAS models.

Also support is provided for selecting the content of a WEB page by a regular expression (for example, to use a sessionid), a configurable number of repetitions for a WEB script, and the ability to monitor through a proxy.
Refusing to use unknown events
In version 2.2, we get rid of unknown events that were not always understood by our users. This will improve both the readability of the list of events and reduce their number.
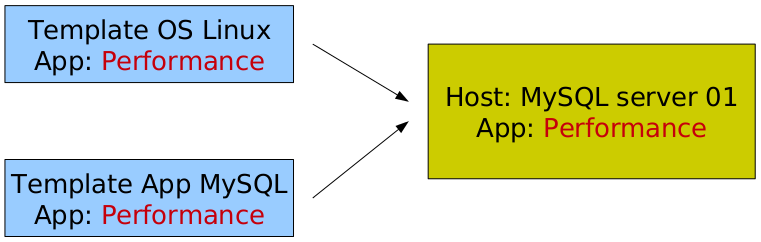
The possibility of linking templates with the same application (application)
This restriction has existed for a long time in Zabbix. Finally we got rid of him! Now it is possible to use templates with the same applications for the host.
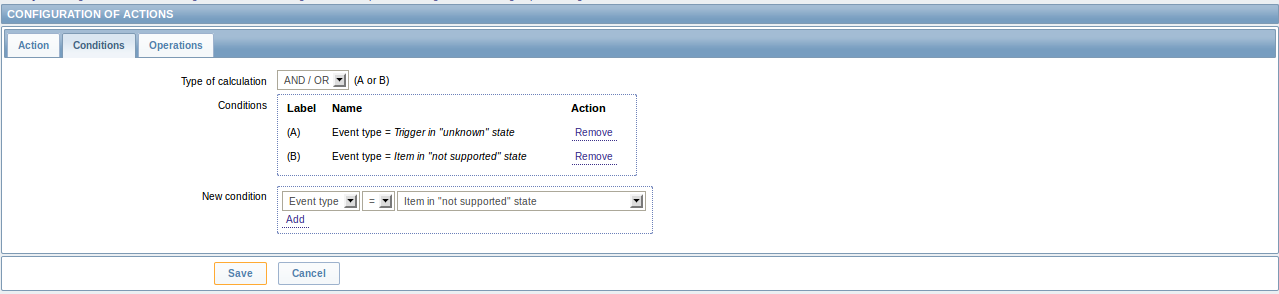
Internal events
Internal events are generated by Zabbix itself in two cases: the item has become unsupported (not supported), or the trigger has switched to an unknown state. These two events are very important for the Zabbix administrator, as they allow you to catch configuration problems at the very beginning. With the help of internal events, it is possible to respond quickly to such cases by sending a message to the user or by running an external script.
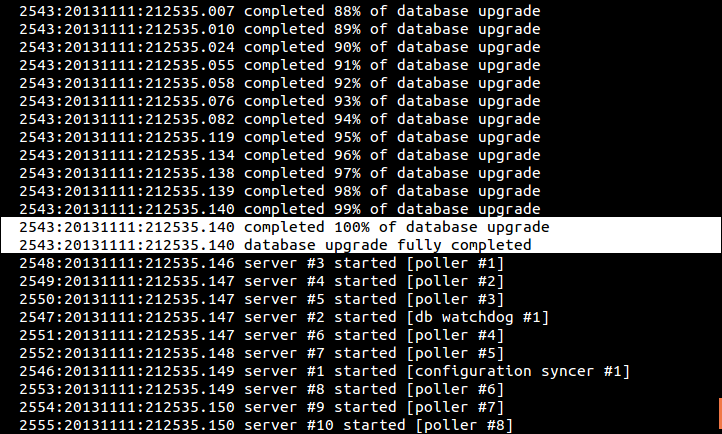
Automatic database update
When switching from one main version to another, you no longer need to manually run scripts to upgrade the database, Zabbix does everything for you. How it works? You run Zabbix server 2.2, it understands that the database is from the previous version 2.0 and begins to adjust the structure for version 2.2. After that, a normal launch occurs. The upgrade process is easy to monitor by monitoring the Zabbix server log file.
Precise control of data cleaning (housekeeping)
A housekeeping is a process that removes outdated information (history, trends, events) from a database. Zabbix 2.2 supports a simpler, but at the same time thin (fine-grained) configuration of the houskiper. For example, you can configure the global retention of history and trends by ignoring settings at the level of individual items given.

Macro processing
Support for macros in commands and text of confirmation of global scripts, comments of triggers and the list of allowed hosts for items of type trapper has been implemented. Complex macros of the form {host: key.last / min / avg / max ()} are supported in chart headers. Created new macros used in messages: {ITEM.STATE <1-9>}, {LLDRULE.ID}, {LLDRULE.NAME}, {LLDRULE.DESCRIPTION}, {LLDRULE.KEY}, {LLDRULE.STATE} and {TRIGGER .STATE}.
Also added support for low-level detection macros in the expressions and the description of the prototype of triggers and in the prototypes of the data elements. Added support for new macros for messages: {TRIGGER.NAME.ORIG}, {ITEM.NAME.ORIG}, {ITEM.KEY.ORIG}. Changed the behavior of macros {ACTION. *} And {EVENT.RECOVERY. *}; {EVENT. *}, In Zabbix 2.2, they return information about a problem event that led to sending a message.
User rights
Changed the logic for calculating user credentials; Now the right to read does not have priority over the right to write, which is more understandable and logical.
Increased the maximum number of objects
Zabbix can contain up to 2 ^ 64-1 different objects of the same type (data elements, triggers, network nodes, events, etc.) if distributed monitoring with nodes is not used.
Host prototypes
Low-level detection allows you to create network nodes. This functionality can be used to automatically detect virtual machines based on information received from the hypervisor. It opens up possibilities for creating rules for monitoring and auto-detection of Xen, KVM, VirtualBox, Linux containers and other virtual machines, as well as cloud infrastructure elements.
Zabbix API side enhancements
Zabbix API is fully documented and includes a log of all changes and a detailed description for all objects and methods.
Monitoring Zabbix processes
Zabbix is able to monitor not only what is happening outside, but also its own well-being. In version 2.2, we went further and implemented support for internal (internal) items for monitoring Zabbix proxy. This allows you to monitor the availability, performance and availability of the necessary resources for the normal functioning of the proxy.
The collected operational information can be used to notify Zabbix administrators in case of potential problems or to display the current status and status of the proxy on the cards.
In addition, detailed information on the status of individual processes has become available from the command line.
SNMP monitoring improvements
Added support for context names (context name), SHA authentication, and AES protocol support for SNMPv3 based checks. Also added support for composite dynamic SNMP indexes.
Improved IPMI monitoring
Added support for discrete sensors.
Web interface enhancements
Many changes aimed at improving the usability of the interface. The maps have added a filter by importance of problems, added support for smoothing lines when generating graphs, and support for value mapping for text data.
Zabbix agent enhancements
Added support for proc.num, net.if.in, net.if.out, net.if.total for HP-UX, system.swap.size for AIX, net.if.discovery for FreeBSD, NetBSD and OpenBSD. Added output of the Aliases and PerfCounters aliases when starting the agent using the -p option. Added support for ignoring gaps in the list of servers in the agent config and allowed hosts for trapper items. Implemented monitoring of the used swap for Windows and OSF.
Added support for monitoring Windows machines using WMI.
Triggers
The maximum length of trigger expressions is increased to 2048 characters, which allows you to create more complex descriptions of problem situations.
Detection and auto-registration
Added the ability to use meta-data with active agents for working with auto-registration. This allows, for example, to use different templates depending on the value of the meta-data.
Access to all historical data
Access to historical information of disconnected network nodes is allowed. Such a node will not disappear from the Monitoring section of the Web interface and will be available for viewing historical data that has already been accumulated.
Displaying usernames when confirming problems
Acknowledgment (acknowledgment) of problems in the interface will display both the alias and the full name of the user.
Improved discovery of network devices
The discovery will take into account the information about the proxy and the newly created host will automatically bind to the correct proxy.
Hierarchical menu for custom scripts
It became possible to create a hierarchy for better organization of user scripts.
Displaying information about network nodes and data elements on monitoring pages
Detailed information about network nodes and items is now available in the Monitoring-> Inventory and Monitoring-> Latest data Zabbix sections of the interface. Previously, this information was only available during configuration.
And also more than a hundred other improvements!
Do not forget to read Release notes and What's new in Zabbix 2.2 . We also sign up for webinars , listen and ask questions!
Source: https://habr.com/ru/post/201500/
All Articles