Manageability of complex networks - translation of the article Controllability of complex networks
This article is a translation of an article by Albert Barabashy and his co-authors, entitled "Controllability of complex networks" . The original of which in PDF format can be downloaded here .
Incidentally, some believe that the twenty-first century Einstein will also be called Albert . Namely Albert Barabashi.
For those who respect the work of others, I remind you that the translation is copyright , and any citation or mention requires a reference to the original translation. I hope that those who do not respect the work of others do not bother themselves with what will be discussed in the article.
')
In the translation, in bold will highlight the important conclusions and basic concepts presented in the article, highlighted by the author of the translation. The translation author’s comments and links to definitions and additional information on some of the concepts and methods given in the article will be in italic.
Manageability of complex networks
The proof that we fully understand the natural and man-made systems can only be our ability to manage these systems. Although control theory offers mathematical tools for managing engineering and natural systems to bring them to their desired state, there is no single infrastructure for managing complex self-organizing systems. In this article, we develop analytical tools for studying the controllability of arbitrary complex oriented networks, as well as determining a set of driver nodes with time-dependent controls that can purposefully control the dynamics of the entire system. We applied these tools to several real-world networks, finding that the number of driver nodes is mainly determined by the network's degree distribution. We will show that it is most difficult to control discharged heterogeneous networks that appear in many real complex systems, and dense and homogeneous networks can be controlled with just a few driver nodes. Paradoxically, we found that, as in the model, and in real systems, driver nodes, as a rule, do not have a high degree of nodes (degree nodes, number of input or output links ).
According to the principles of control theory, a dynamic system is controllable, if with a certain set of input variables, it can be transferred from any initial state to any desired state in a finite time of 1-3 . This definition is consistent with our intuitive understanding of control, being able to bring the system to the desired state through appropriate manipulations of several input variables, just as the driver, by manipulating the pedals and steering wheel, causes the car to move at the desired speed and in a given direction. Despite the fact that control theory is a mathematically highly developed branch of technology with applications for electrical circuits, production processes, communication systems 4-6 , aircraft manufacturing, spacecraft and robots 2-3 , fundamental issues related to the controllability of complex systems arising in nature and technology have difficulty resolving. The difficulty is that it is necessary to control two independent factors, each with its own level of uncertainty:
(1) system architecture represented by a network that encapsulates which components interact with each other,
(2) dynamic rules that capture time-dependent interactions between components.
Thus, progress can only be possible in systems in which both layers are well delineated , such as managing synchronized networks 7-10 , small biological chains, and speed control for communication networks 4-6 . Recent achievements in the direction of reducing the qualitative topological characteristics of complex networks to quantitative 12-16 shed light on the factor (1), pointing out that some networks are easier to control than others, and how the network topology affects the manageability of the system. Despite some conceptually innovative work 17–23 (see Section II of the Additional Information ), we still lack main answers to these questions for large weighted and directed networks that most often arise in complex systems.
Network manageability
The majority of real systems are based on nonlinear processes, but the controllability of nonlinear systems is in many respects structurally similar to the controllability of linear systems 3 , which prompted us to start research using the equations of canonical linear dynamics invariant in time
 (one)
(one)
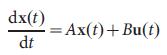
where the vector X (t) = (X1 (t), ..., Xn (t)) fixes the state of the system consisting of N nodes at the time t. For example, X (t) may denote the amount of traffic that passes through node i in the communication network 24 or the concentration of the transcription factor in the gene regulation network 25 . The NxN matrix A matrix describes the system connection scheme and the interaction forces between the components, for example, traffic on separate communication lines or the interaction interaction strength. Finally, B is an input matrix of dimension MxN (M <= N), which identifies the nodes that are controlled by an external controller. The system is controlled by the input vector U (t) = (U1 (t), ..., Um (t)) depending on time t, entered using the controller (Fig. 1a), where, generally speaking, the same signal Ui (t) can manage multiple nodes.
Figure 1 | simple network management. a. A small network can be controlled by the input vector. (left), which allows us to move the network from its original state to some desired final state in the state space (right). Equation (2) provides the controllability of the matrix (C), which in this case has full rank, indicating that the system is controllable. b, Simple network model: oriented trajectory. c, the maximum matching oriented trajectory. Saturated links are shown in purple, saturated nodes are green, and loose links are white. The unique maximum matching of nodes includes all links, such that none of them are either starting or end nodes. Only the top node is free, so control over it gives full control over the oriented trajectory (
  = 1). d, In the directed trajectory shown in Figure b, all links are critical, that is, their removal will deprive us of the ability to control the network. e, Small network model: a directional star. f , Maximum matching in a directed star. Only one link can be part of a maximum matching that gives three free nodes ( = 3). Three different maximum matchings show that three different node configurations can exercise complete control. g, In a star oriented, all communications are normal, that is, their deletion can deprive some control configurations, but the network can be managed in their absence with the same number of driver nodes . h, Example of a small network. i, Only two links can be part of the maximum matching for the network h, which gives four free nodes ( = 4). There are a total of four different maximum matchings for this network. j, The network has one critical link, one redundant link (which can be removed without losing any control configuration), and four regular links.
If we want to manage the system, then first of all we need to determine the set of nodes, controlling which by means of various signals, we will be able to provide complete control over the network. We will call these nodes drivers. It is particularly interesting to determine the minimum number of drivers, control over which will be enough to fully control the dynamics of the system. We denote it by Nd.
The system described by equation (1) is called controlled if it can be brought from any initial state to any desired final state in a finite time, which is possible if and only if the matrix (2) of dimension N x NM, has full rank
  (3)
(3)
This equation is a mathematical condition for the controllability of the system, and is called the Kalman controllability criterion for rank 1.2 (Fig. 1a). In a practical sense, manageability can also be considered as follows, determine such a minimum number of driver nodes such that equation (3) will be satisfied. So, for example, the equation (3) says that the control over the node x1 in fig. 1b using the input signal u1 provides full control over the system, since the states of the nodes x1, x2, x3 and x4 are uniquely determined by the signal u1 (t) (Fig. 1c). At the same time, on the contrary, the impact on the upper node in Fig. 1e will not be enough for full control, as the difference (where aij are elements of the matrix A) cannot be uniquely determined using u1 (t) (see Fig. 1f and Section III.A of the Additional Information ). To gain complete control, we must simultaneously control the node x1 and any two other nodes among {x2, x3, x4} (see Fig. 1h, i for a more complex example).
In order to apply equations (2) and (3) to an arbitrary network, it is necessary to know the weight of each connection (that is, aij), which for most real networks are either unknown (for example, regulation networks) or are only known approximately and depend on time (for example Internet traffic). Even if all weights are known, a brute force search requires that we calculate the rank of the C matrix for different combinations, which is a computationally overly complex task for large networks. To circumvent the need to measure reference weight, we note that the system (A, B) is “structurally controlled” 26 if it is possible to choose nonzero weights in A and B so that the system satisfies equation (3) . A structurally controlled system can be controlled for almost all combinations of weighting factors, with the exception of some pathological cases with zero measure, which occur when the parameters of the system satisfy certain random constraints 26, 27 . Thus, structural manageability helps us to essentially overcome our incomplete knowledge of link weights in A. In addition, since structural manageability implies control over the continuum of linearized systems 28 , our results can also provide a sufficient controllability condition for most nonlinear systems 3 (section III.A Additional Information ).
To avoid searching for driver nodes using brute force, we proved that the minimum number of inputs or driver nodes needed to maintain full control over a network is determined by the “maximum matching” on the network, that is, by the maximum set of links that do not include starting or ending nodes (Fig. 1 c, f, i). A node is called saturated if the link points to the point of maximum matching, otherwise it is free. As we showed in Supplementary Information , the problem of structural manageability corresponds to an equivalent geometric problem in the network: we can get full control over the oriented network, if and only when we directly control each free node, and there are directional paths from the input signals for all saturated nodes 29 . Ability to determine using this mapping is our first main result. Since the maximum matching in oriented networks can be numerically determined in a number of steps not more than  30 , where L denotes the number of connections, the mapping offers an efficient method for determining driver nodes for an arbitrary oriented network.
Real Network Manageability
We used the tools developed earlier to study the manageability of several real networks. Networks were chosen because of their diversity: for example, the purpose of a gene regulation network is to control the dynamics of cellular processes, so it was expected that the result would be a structure that is effective from a control point of view and theoretically should have a small number of driver nodes (i.e. small ). On the contrary, for the manageability of the world wide web or citation networks, this is not to be expected, which makes this question difficult even for
  . Finally, one could argue that social networks, given their perception neutrality (or even resilience) for management, should have high , because they need to control the majority of people separately to control the entire system. We used mapping to maximum matching in order to determine the minimum set of driver nodes. for networks from Table 1. The obtained data contradicts our expectations: as a group, gene regulation networks exhibit high (0.8), indicating to us that it is necessary to independently control about 80% of the nodes to control them in full. On the contrary, some social networks are characterized by minimal values. , which suggests that several people, in principle, can control the entire system.
Table 1 | Characteristics of real networks analyzed in this article
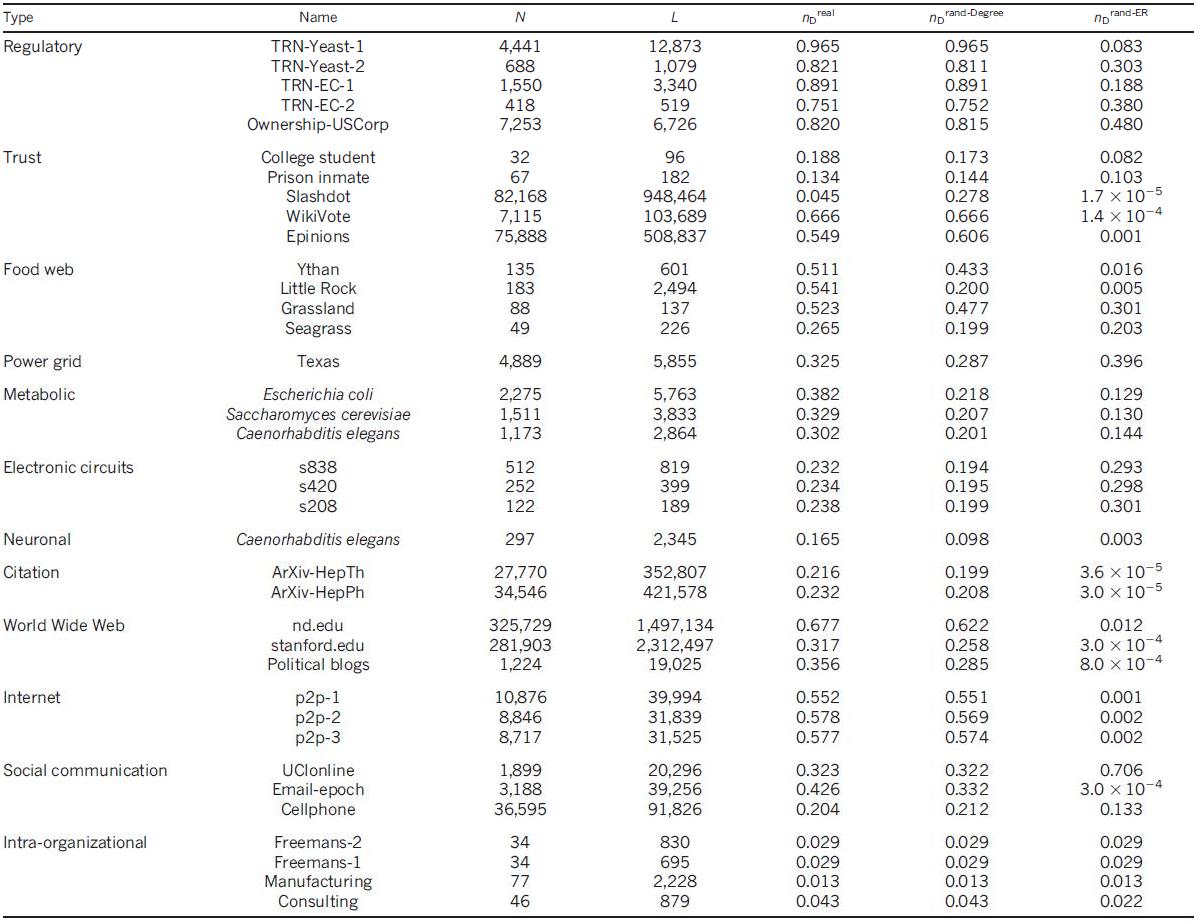
For each network, its type and name are indicated; the number of nodes (N) and connections (L); density of driver nodes calculated in a real network after randomization with retention of degrees
  and after complete randomization
  . For access to data sources and links, see Section VI for Additional Information .
Considering that hubs (nodes with a high degree) have an important role in maintaining the structural integrity of the network from disruptions and external influences 31,32 in propagation phenomena 32,33 and in synchronization 8,34 , it would be natural to assume that control over the hubs is necessary for control the entire network. To test the correctness of this hypothesis, we divided the nodes into three groups of equal size depending on their degree, k (low, medium and high). As the figure shows. 2a, b for two canonical network models (Erdos-Renyi 35.36 and scaleless 15.37-39 ), the share of driver nodes is significantly higher among nodes with a low degree than among hubs . In fig. 2c is a graph of the average degree of driver nodes, from a moderate degree
  , for each network from Table 1, for several network models. In all cases significantly less than similar , indicating that, in real and simulated systems, driver nodes are usually not hubs.
To determine the topological features that define network controllability, we chose the random state of each real network using the full randomization procedure (RAND-ER), which turns the network into an ErdoS-Renyi oriented random network with N and L constants. For several networks there is no correlation between source network and its randomized state (Fig. 2d), thus, with full randomization by the method of elimination, we conclude that topological characteristics do not affect controllability . We also applied randomization with retention of degrees 40.41 (RAND-degree), which preserves the input degree,  and output degree
  , each node is unchanged, but randomly selects nodes that are connected to each other. We believe that despite the observed differences of six orders of magnitude this procedure does not change substantially. Thus, the controllability of the system largely depends on the distribution of the degrees of network nodes.
  that is our second and most significant conclusion. He says that is mainly determined by the number of incoming and outgoing connections of each node and does not depend on where the links are pointing.
Analytical approach to manageability
The importance of the distribution of degrees, allows analytically determine for network with arbitrary . Using the saddle point method 42-44 , we obtained a set of self-consistent equations (Section IV, Supplementary Information ), whose input is the distribution of powers, and whose solution for the average (or ) for all network implementations is compatible with what is our third key result. As the figure shows. 2 f, analytically calculated fully consistent with  (and therefore must be in good agreement with the exact value
  ), which provides us with an effective analytical tool for studying the effect of various network parameters on . Although the saddle point method does not offer an analytical solution, we can get from key network parameters in the thermodynamic limit
  . For example, we found that for the ErdoS-Renyi oriented network at large fair
  (four). For scale-free networks in the limit, for large 38 , with exponent
  we have the equation
 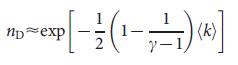 (5), which is in the limit
  has the same dependence on as equation (4). From equation (5) it follows that
  is a critical indicator for the controllability of infinite scale-free networks, and only for
  we can control the entire system through a finite number of nodes (i.e.
  ). For
  In the thermodynamic limit, absolutely all nodes must be controlled (i.e., = 1). Note that
  differs from
  , which is a critical indicator for a number of network phenomena, from resistance to viral spread 31-33,45 , due to discrepancies
  . To check the analytical calculations for networks such as ErdoS-Renyi and scale-free networks, we have determined the numerical dependence from which confirms asymptotic exponential dependence from , as predicted by equations (4) and (5). In addition, the predicted value agrees well with the numerical results for
  (Fig. 3 d, e). However, in the neighborhood
  , , as predicted by the saddle point method, deviates from the exact value due to the correlation of degrees that are significant for , and can be eliminated by introducing a truncated degree in the construction of scale- free networks 39.46 (Section IV. In Additional Information ). Equation (5) also shows that decreases with increasing
  (with fixed ), pointing out that depends on the degree of heterogeneity, representing the difference between less connected and more connected nodes. We defined the heterogeneity of the degree as
  where
where  is the average absolute difference of degrees for all pairs of nodes (i and j) taken from the distribution of degree
  . The degree of non-uniformity is zero (H = 0) for networks in which all nodes have the same degree, for example, random regular oriented graphs (Fig. 3 a) in which the input and output degrees of the nodes are given to / 2, but nodes are randomly connected. For > = 2, this graph always has a perfect match of 47 (a match containing all the vertices of the graph), which means that a single driver node can control the entire system (section IV.B1 of the Additional Information ).
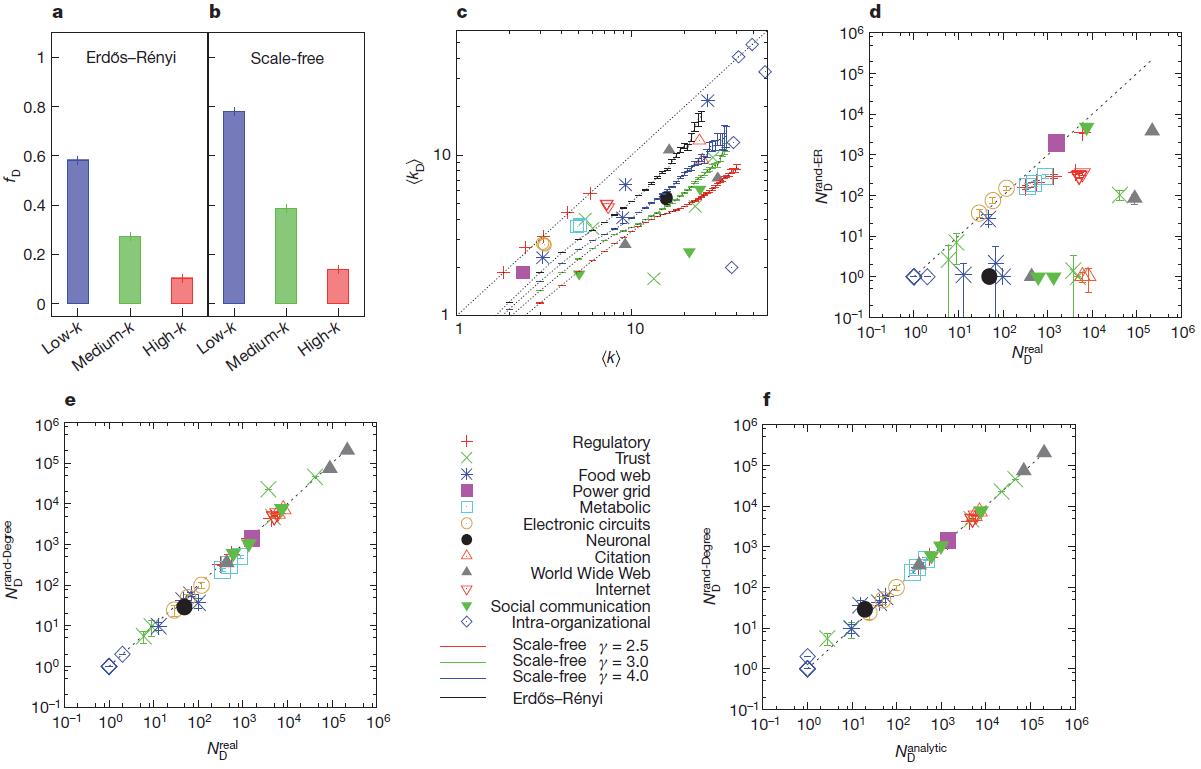
Figure 2 | Characteristics and prediction of the behavior of driver nodes ( ).
a, b, the role of hubs in the network model. The bars show the percentage of driver nodes , among nodes with low, medium and high degree nodes for two network models, Erdos-Re'nyi (a) and scale-free (b), with N = 10 4 = 3 ( ), indicating to us that the driver nodes, as a rule, are not hubs. ErdoS-Re'nyi and scale-free networks are generated from static model 38 and the results are averaged over 100 implementations. The error bars (above the main bars), as shown in the figure, are smaller than the values themselves. c, the average degree of driver nodes as compared to the average degree of all nodes in real and model networks, indicates that in real systems, hubs are not driver nodes. d, Number of driver nodes
  obtained for fully randomized versions of the networks listed in Table 1, compared with the exact value, . e, Number of driver nodes obtained with a degree for randomized versions of the networks shown in Table 1, compared with . f, Analytically calculated
  obtained using the saddle point method, compared to . In df, the data and error points (SEM) were determined from 1000 implementations of randomized networks.
The degree of heterogeneity increases as we move from a random regular directed graph to a network of the ErdoS-Renyi type (Fig. 3 b), and ultimately with a decrease in to scale-free networks (Fig. 3 c). In general, the share of driver nodes, , monotonically increases with H, while maintaining constant (fig. 3 f) or (Fig. 3 g).
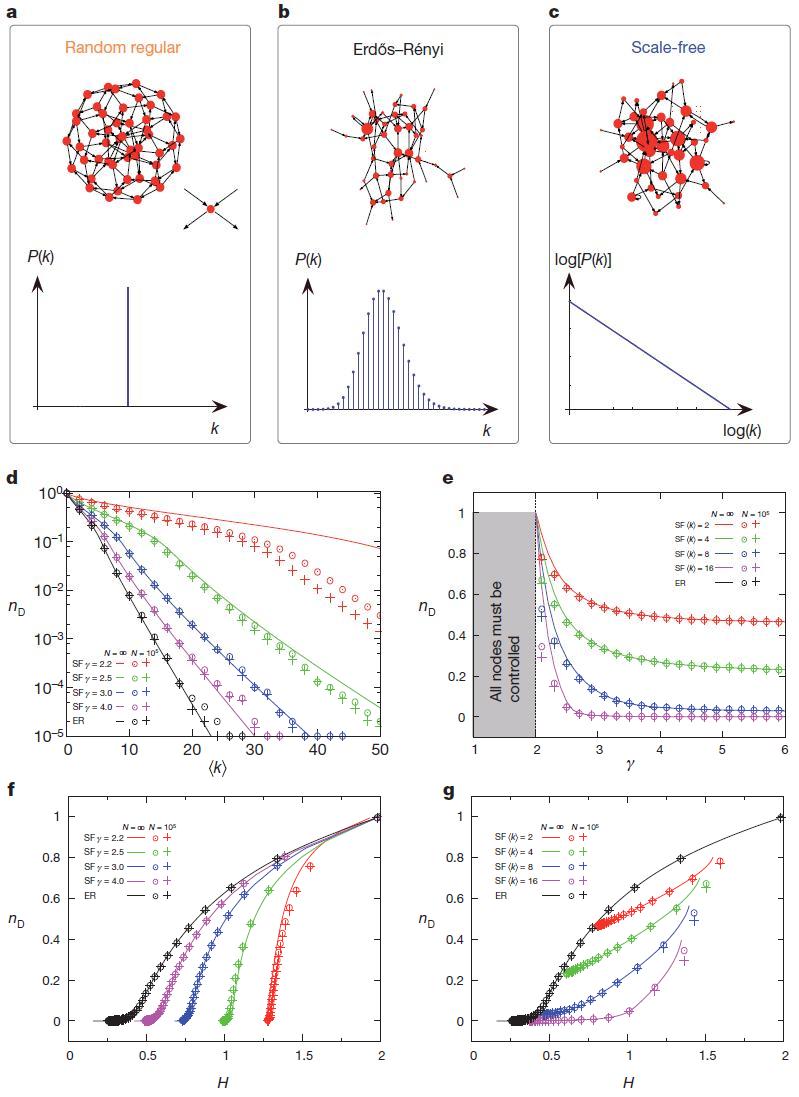
Figure 3 | The influence of the network structure on the number of driver nodes. a – c,
Characteristics of the studied network models. Randomly-oriented graph ( a ), shown here for = 4 is the network with the most uniform distribution of powers, because = = / 2 for all nodes. Erdos – Renyi networks ( b ) have Poisson distribution of degrees, and the degree of heterogeneity for them is determined by . The scale-free networks ( c ) have a power dependence of the distribution of powers, which leads to a huge degree of heterogeneity. d , density of driver nodes, as a function of for Erdo – Renyi (ER) and scale-free (SF) networks with different values . Both scaleless and Erdos – Renyi networks are generated from static model 38 with N = 10 5 . The lines are analytical results and are calculated using the saddle point method using the expected limit. degree distributions.
The symbols are calculated for the constructed discrete network: the circles indicate the exact results of the calculation using the maximum matching method, and the crosses indicate the analytical results obtained by the saddle point method using the exact sequence of degrees of the constructed network. For large , approaching the bottom page, N -1 , that is, the only driver node = 1 on the network of size N. e , as a function of for scale-free networks with fixed . For endless scale-free networks -> 1 because -> = 2, that is, it is necessary to control almost all nodes in order to control the entire network. For finite scale-free networks, -> 1 since -> , that is, it is necessary to control almost all nodes in order to control the entire network. For finite scale-free networks reaches its maximum since approaching ( Additional Information ). f, as a function of the degree of heterogeneity, H, for Erdos – Renyi networks and scale-free networks with fixed and changing . g, nD as a function of H for Erdos – Renyi networks and scale-free networks for fixed and changing . With increasing , the curves converge to the result of networks ErdoS-Renyi (black color) with the corresponding value .
Taking these results into account together, we find that the denser the network, the fewer driver nodes are needed to control it, and that small changes in the average cause changes. order scales. In addition, the greater the difference between the degree of nodes, the greater the number of driver nodes needed to control the system.In general, networks that are sparse and heterogeneous, namely, these characteristics are often observed in complex systems such as cellular networks or the Internet, 13–16 require more driver nodes, emphasizing that such systems are difficult to control.
Management Resilience
To see how reliable our ability to manage a network is in situations where some of the links in the network disappear, which inevitably arise, we classify each link into one of three categories (Fig. 1, D, G, J):
“critical”, if in case of its disappearance we need to increase the number of driver nodes to maintain full controllability;
“Redundant” if it can be removed without affecting the current set of driver nodes, or
“Ordinary” if it is neither critical nor superfluous. Figure 4 shows the densities of critical , redundant,
  and regular
  connections for each real network, and it shows that most networks have few or no critical connections. Most connections are normal, which means that they play a role in some management configurations, but these networks can be managed in their absence. Figure 4 | Reference categories in the context of sustainability management.
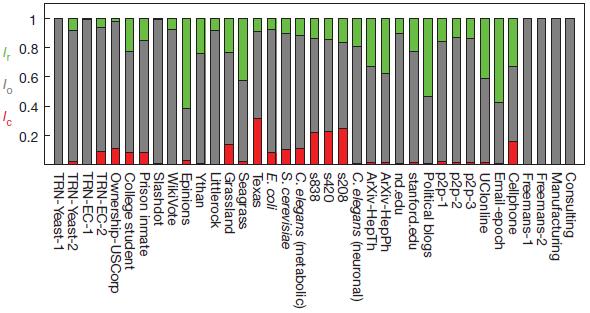
The proportion of critical (red, LC), redundant (green, LR) and normal (gray, LO) links for real networks indicated in Table 1. In order to make the management resistant to link loss, it is enough to double only the critical links, formally making each of these links are redundant, and thus make sure that there are no critical links in the system.
In order to realize the factors that determine ,
,  and in fig. 5 A, C, F we show their dependence for model systems. Behavior easy to understand: for small ones , all connections are important for managing
 .As it increases, network redundancy increases with decreasing .Increasing redundancy suggests that the density of redundant bonds ,, should always increase with , but this is not so: it reaches a maximum at a critical value. ,
  after which he falls. This non-monotonic behavior is the result of the competition of two topologically different segments of the network, the core and the leaves 43 . The core is a compact cluster of nodes remaining in the network after applying the “protruding” leaf removal 48 , and the leaves are nodes with = 1 or = 1 before or during leaf removal. The nucleus exits through the transition leakage (Fig. 5, B, D): for K < ,
 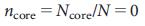 , so that the system consists only of leaves (Fig. 5 E). With = , there is a small nucleus, reducing the number of leaves. For networks ErdoS-Renyi networks, we assume that = 2e = 5.436564, which is consistent with the numerical results (Fig. 5 a, b), a value that matches
with Where reaches a maximum. Really, starts to subside at because for > the number of different maximum matches grows exponentially (Section IV.C of Supplementary Information ) and, as a result, the likelihood that a link does not participate in any management configuration decreases. For scale-free networks, we observe the same behavior, with the proviso that decreases with (Fig. 5, c, d).
Discussion and conclusions
Management is one of the central issues in the most complex systems, but due to the lack of a general theory for studying these issues using quantitative methods, we know little about how we can control weighted, oriented networks (configurations that are most often found in real systems). Indeed, the application of the rank condition of Kalman controllability (Eq. (3)) for large networks is excessively computationally, limiting the application of previous work to networks with a number of nodes no more than a few dozen 17-19 . Here we have developed tools for solving a network management problem with arbitrary topology and size. Our main conclusion is that determined mainly by the distribution of degrees, allows us to use the tools of statistical physics to analytically predict the dependence from by proposing a general formalism to study the effect of network topology on manageability. Figure 5 | Stability management. a, Dependence of the share of critical (red, LC), redundant (green, LR) and normal (gray, LO) connections from Erdos – Renyi: lr networks reaches a maximum at
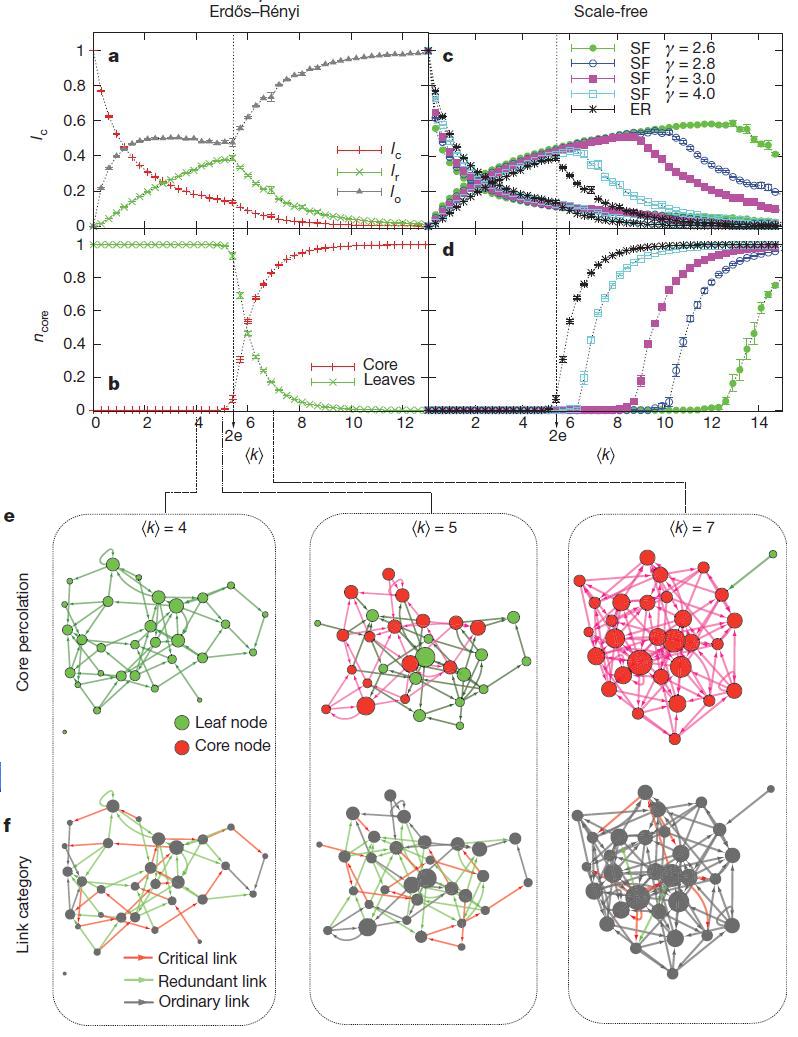
= = 2e, and the derivative LC breaks at = . b, Kernel leakage for Erdos – Renyi networks occurs when = = 2e, which explains peak LR. c, d, Same as a and b, but for scale-free networks. The Erdos – Renyi networks and 38 non-scale networks have N = 10 4 and the results are averaged for ten implementations with an error value defined as sem Dotted lines are only conditionally indicated. e, Core (red) and leaves (green) for small Erdos – Renyi networks (N = 30) with different values ( = 4, 5, 7). The size of the node is proportional to the degree of the node. f, Critical (red), redundant (green) and normal (gray) links over Erdos – Renyi networks with corresponding values .
The approach presented here raises a number of questions, the answers to which could further deepen our understanding of the task of managing in difficult conditions. For example, despite the fact that our analytical work focuses on uncorrelated networks, the algorithmic methods that we developed can determinefor arbitrary networks, providing a systematic basis for the question of the role of correlations 40, 49, 50 . Taken together, our results show that when combining the tools of the science of networks and control theory, many aspects of controllability can be studied in an exact analytical way for arbitrary networks, opening up new ways to deepen our understanding of complex systems.
Additional Information on the article “Manageability of Complex Networks”available on Nature magazine website.
Links to additional information provided by the author of the translation
1. Concentration of the transcription factor in the gene regulation network
2. Matching theory
3. Kalman's controllability criterion by rank
4. Search by brute force method
5. Saddle point method
Translated by Rabchevsky Eugene .
1. Kalman, RE Mathematical description of linear dynamical systems. J. Soc. Indus. Appl. Math Ser.A 1, 152–192 (1963).
2. Luenberger, DG Introduction to Dynamic Systems: Theory, Models, & Applications (Wiley, 1979).
3. Slotine, J.-J. & Li, W. Applied Nonlinear Control (Prentice-Hall, 1991).
4. Kelly, FP, Maulloo, AK & Tan, DKH Rate control for communication networks: shadow prices, proportional fairness and stability. J. Oper. Res. Soc.49, 237–252 (1998).
5. Srikant, R. The Mathematics of Internet Congestion Control (Birkha¨user, 2004).
6. Chiang, M., Low, SH, Calderbank, AR & Doyle, JC Layering as optimization decomposition: a mathematical theory of network architectures. Proc.IEEE 95, 255–312 (2007).
7. Wang, XF & Chen, G. Pinning control of scale-free dynamical networks. Physica A 310, 521–531 (2002).
8. Wang, W. & Slotine, J.-JE. On partial contraction analysis for coupled nonlinear oscillators. Biol.Cybern. 92, 38–53 (2005).
9. Sorrentino, F., di Bernardo, M., Garofalo, F. & Chen, G. Controllability of complex networks via pinning. Phys. Rev.E 75, 046103 (2007).
10. Yu, W., Chen, G. & Lu¨, J. On pinning synchronization of complex dynamical networks. Automatica 45, 429–435 (2009).
11. Marucci, L. et al. How to switch to a synthetic circuit tunable oscillator, or a bistable switch. PLoS ONE 4, e8083 (2009).
12. Strogatz, SH Exploring complex networks. Nature 410, 268-276 (2001).
13. Dorogovtsev, SN & Mendes, JFF, Evolution of Networks: From the Internet to the Internet and the World Wide Web (Oxford Univ. Press, 2003).
14. Newman, M., Baraba´si, A.-L. & Watts, DJ The Structure and Dynamics of Networks (Princeton Univ. Press, 2006).
15. Caldarelli, G. Scale-Free Networks: Complex Webs in Nature and Technology (Oxford Univ. Press, 2007).
16. Albert, R. & Baraba´si, A.-L. Statistical mechanics of complex networks. Rev. Mod. Phys.74, 47–97 (2002).
17. Tanner, HG in Proc. 43rd IEEE Conf. Decision Contr. Vol.3, 2467–2472 (2004).
18. Lombardi, A. & H¨rnquist, M. Controllability analysis of networks. Phys. Rev.E 75, 56110 (2007).
19. Liu, B., Chu, T., Wang, L., & Xie, G. Controllability of a leader – follower dynamic network with switching topology. IEEE Trans. Automat. Contr. 53, 1009-1013 (2008).
20. Rahmani, A., Ji, M., Mesbahi, M. & Egerstedt, M. Controllability of Multi-Agent Systems from a graph-theoretic perspective. SIAM J. Contr. Optim. 48, 162-186 (2009).
21. Kim, D.-H. & Motter, AE Slave nodes and the controllability ofmetabolic networks. NJ Phys. 11, 113047 (2009).
22. Mesbahi, M. & Egerstedt, M. Graph Theoretic Methods in Multiagent Networks (Princeton Univ. Press, 2010).
23. Motter, AE, Gulbahce, N., Almaas, E. & Baraba´si, A.-L. Predicting synthetic rescues in metabolic networks. Mol. Syst. Biol.4, 168 (2008).
24. Pastor-Satorras, R. & Vespignani, A. Evolution and Structure of the Internet: A Statistical Physics Approach (Cambridge Univ. Press, 2004).
25. Lezon, TR, Banavar, JR, Cieplak, M., Maritan, A. & Fedoroff, NV. Proc. Natl Acad. Sci.USA 103, 19033–19038 (2006).
26. Lin, C.-T. Structural controllability. IEEE Trans. Automat. Contr.19, 201–208 (1974).
27. Shields, RW & Pearson, JB Structural controllability of multi-input linear systems. IEEE Trans. Automat. Contr. 21, 203–212 (1976).
28. Lohmiller, W. & Slotine, J.-JE On contraction analysis for nonlinear systems. Automatica 34, 683–696 (1998).
29. Yu, W., Chen, G., Cao, M., & Kurths, J. Non-linearar dynamics. IEEE Trans. Syst.Man Cybern. B 40, 881–891 (2010).
30. Hopcroft, JE & Karp, RM An n5 / 2 algorithmfor maximummatchings in bipartite graphs. SIAM J. Comput. 2, 225–231 (1973).
31. Albert, R., Jeong, H. & Baraba´si, A.-L. Error and attack tolerance of complex
networks. Nature 406, 378–382 (2000).
32. Cohen, R., Erez, K., Ben-Avraham, D., & Havlin, S. Resilience to Internet Breakdowns. Phys. Rev.Lett. 85, 4626–4628 (2000).
33. Pastor-Satorras, R. & Vespignani, A. Epidemic spreading in scale-free networks. Phys. Rev.Lett. 86, 3200–3203 (2001).
34. Nishikawa, T., Motter, AE, Lai, Y.-C. & Hoppensteadt, FC Heterogeneity in oscillator networks: are they smaller worlds easier to synchronize? Phys. Rev.Lett. 91, 014101 (2003).
35. Erdo˝s, P. & Re´nyi, A. On the evolution of random graphs. Publ. MathInst. Hung. Acad. Sci.5, 17–60 (1960).
36. Bolloba´s, B. Random Graphs (Cambridge Univ. Press, 2001).
37. Baraba´si, A.-L. & Albert, R.Emergence of scaling in randomnetworks. Science 286, 509-512 (1999).
38. Goh, K.-I., Kahng, B., & Kim, D. Phys. Rev.Lett. 87, 278701 (2001).
39. Chung, F. & Lu, L. Connected component in random graphs with given expected degree sequences. Ann. Combin. 6, 125–145 (2002).
40. Maslov, S. & Sneppen, K. Specificity and stability in topology of protein networks. Science 296, 910–913 (2002).
41. Milo, R. et al. Network motifs: simple building blocks of complex networks. Science 298, 824–827 (2002).
42. Me´zard, M. & Parisi, G. The Bethe lattice spin glass revisited. Eur. Phys.J. B 20, 217-233 (2001).
43. Zdeborova´, L. & Me´zard, M. The number of match graphs in random graphs. J. Stat. Mech. 05, 05003 (2006).
44. Zhou, H. & Ou-Yang, Z.-c. Maximum matching on random graphs. Preprint at http://arxiv.org/abs/cond-mat/0309348æ (2003).
45. Callaway, DS, Newman, MEJ, Strogatz, SH & Watts, DJ Network robustness and fragility: percolation on random graphs. Phys. Rev.Lett. 85, 5468–5471 (2000).
46. Bogun˜a´, M., Pastor-Satorras, R. & Vespignani, A. c. Eur. Phys.J. B 38, 205–209 (2004).
47. Lova´sz, L. & Plummer, MD Matching Theory (American Mathematical Society, 2009).
48. Bauer, M. & Golinelli, O. Core percolation in random graphs: a critical phenomena analysis. Eur. Phys.J. B 24, 339–352 (2001).
49. Newman, MEJAssortativemixinginnetworks.Phys.Rev.Lett.89,208701 (2002).
50. Pastor-Satorras, R., Va´zquez, A. & Vespignani, A. Dynamic and correlation properties of the Internet. Phys. Rev.Lett. 87, 258701 (2001).
Incidentally, some believe that the twenty-first century Einstein will also be called Albert . Namely Albert Barabashi.
For those who respect the work of others, I remind you that the translation is copyright , and any citation or mention requires a reference to the original translation. I hope that those who do not respect the work of others do not bother themselves with what will be discussed in the article.
')
In the translation, in bold will highlight the important conclusions and basic concepts presented in the article, highlighted by the author of the translation. The translation author’s comments and links to definitions and additional information on some of the concepts and methods given in the article will be in italic.
Manageability of complex networks
The proof that we fully understand the natural and man-made systems can only be our ability to manage these systems. Although control theory offers mathematical tools for managing engineering and natural systems to bring them to their desired state, there is no single infrastructure for managing complex self-organizing systems. In this article, we develop analytical tools for studying the controllability of arbitrary complex oriented networks, as well as determining a set of driver nodes with time-dependent controls that can purposefully control the dynamics of the entire system. We applied these tools to several real-world networks, finding that the number of driver nodes is mainly determined by the network's degree distribution. We will show that it is most difficult to control discharged heterogeneous networks that appear in many real complex systems, and dense and homogeneous networks can be controlled with just a few driver nodes. Paradoxically, we found that, as in the model, and in real systems, driver nodes, as a rule, do not have a high degree of nodes (degree nodes, number of input or output links ).
According to the principles of control theory, a dynamic system is controllable, if with a certain set of input variables, it can be transferred from any initial state to any desired state in a finite time of 1-3 . This definition is consistent with our intuitive understanding of control, being able to bring the system to the desired state through appropriate manipulations of several input variables, just as the driver, by manipulating the pedals and steering wheel, causes the car to move at the desired speed and in a given direction. Despite the fact that control theory is a mathematically highly developed branch of technology with applications for electrical circuits, production processes, communication systems 4-6 , aircraft manufacturing, spacecraft and robots 2-3 , fundamental issues related to the controllability of complex systems arising in nature and technology have difficulty resolving. The difficulty is that it is necessary to control two independent factors, each with its own level of uncertainty:
(1) system architecture represented by a network that encapsulates which components interact with each other,
(2) dynamic rules that capture time-dependent interactions between components.
Thus, progress can only be possible in systems in which both layers are well delineated , such as managing synchronized networks 7-10 , small biological chains, and speed control for communication networks 4-6 . Recent achievements in the direction of reducing the qualitative topological characteristics of complex networks to quantitative 12-16 shed light on the factor (1), pointing out that some networks are easier to control than others, and how the network topology affects the manageability of the system. Despite some conceptually innovative work 17–23 (see Section II of the Additional Information ), we still lack main answers to these questions for large weighted and directed networks that most often arise in complex systems.
Network manageability
The majority of real systems are based on nonlinear processes, but the controllability of nonlinear systems is in many respects structurally similar to the controllability of linear systems 3 , which prompted us to start research using the equations of canonical linear dynamics invariant in time
(one)where the vector X (t) = (X1 (t), ..., Xn (t)) fixes the state of the system consisting of N nodes at the time t. For example, X (t) may denote the amount of traffic that passes through node i in the communication network 24 or the concentration of the transcription factor in the gene regulation network 25 . The NxN matrix A matrix describes the system connection scheme and the interaction forces between the components, for example, traffic on separate communication lines or the interaction interaction strength. Finally, B is an input matrix of dimension MxN (M <= N), which identifies the nodes that are controlled by an external controller. The system is controlled by the input vector U (t) = (U1 (t), ..., Um (t)) depending on time t, entered using the controller (Fig. 1a), where, generally speaking, the same signal Ui (t) can manage multiple nodes.
Figure 1 | simple network management. a. A small network can be controlled by the input vector.
(left), which allows us to move the network from its original state to some desired final state in the state space (right). Equation (2) provides the controllability of the matrix (C), which in this case has full rank, indicating that the system is controllable. b, Simple network model: oriented trajectory. c, the maximum matching oriented trajectory. Saturated links are shown in purple, saturated nodes are green, and loose links are white. The unique maximum matching of nodes includes all links, such that none of them are either starting or end nodes. Only the top node is free, so control over it gives full control over the oriented trajectory ( = 1). d, In the directed trajectory shown in Figure b, all links are critical, that is, their removal will deprive us of the ability to control the network. e, Small network model: a directional star. f , Maximum matching in a directed star. Only one link can be part of a maximum matching that gives three free nodes ( = 3). Three different maximum matchings show that three different node configurations can exercise complete control. g, In a star oriented, all communications are normal, that is, their deletion can deprive some control configurations, but the network can be managed in their absence with the same number of driver nodes . h, Example of a small network. i, Only two links can be part of the maximum matching for the network h, which gives four free nodes ( = 4). There are a total of four different maximum matchings for this network. j, The network has one critical link, one redundant link (which can be removed without losing any control configuration), and four regular links.If we want to manage the system, then first of all we need to determine the set of nodes, controlling which by means of various signals, we will be able to provide complete control over the network. We will call these nodes drivers. It is particularly interesting to determine the minimum number of drivers, control over which will be enough to fully control the dynamics of the system. We denote it by Nd.
The system described by equation (1) is called controlled if it can be brought from any initial state to any desired final state in a finite time, which is possible if and only if the matrix
(2) of dimension N x NM, has full rank (3)This equation is a mathematical condition for the controllability of the system, and is called the Kalman controllability criterion for rank 1.2 (Fig. 1a). In a practical sense, manageability can also be considered as follows, determine such a minimum number of driver nodes such that equation (3) will be satisfied. So, for example, the equation (3) says that the control over the node x1 in fig. 1b using the input signal u1 provides full control over the system, since the states of the nodes x1, x2, x3 and x4 are uniquely determined by the signal u1 (t) (Fig. 1c). At the same time, on the contrary, the impact on the upper node in Fig. 1e will not be enough for full control, as the difference
(where aij are elements of the matrix A) cannot be uniquely determined using u1 (t) (see Fig. 1f and Section III.A of the Additional Information ). To gain complete control, we must simultaneously control the node x1 and any two other nodes among {x2, x3, x4} (see Fig. 1h, i for a more complex example).In order to apply equations (2) and (3) to an arbitrary network, it is necessary to know the weight of each connection (that is, aij), which for most real networks are either unknown (for example, regulation networks) or are only known approximately and depend on time (for example Internet traffic). Even if all weights are known, a brute force search requires that we calculate the rank of the C matrix for
different combinations, which is a computationally overly complex task for large networks. To circumvent the need to measure reference weight, we note that the system (A, B) is “structurally controlled” 26 if it is possible to choose nonzero weights in A and B so that the system satisfies equation (3) . A structurally controlled system can be controlled for almost all combinations of weighting factors, with the exception of some pathological cases with zero measure, which occur when the parameters of the system satisfy certain random constraints 26, 27 . Thus, structural manageability helps us to essentially overcome our incomplete knowledge of link weights in A. In addition, since structural manageability implies control over the continuum of linearized systems 28 , our results can also provide a sufficient controllability condition for most nonlinear systems 3 (section III.A Additional Information ).To avoid searching for driver nodes using brute force, we proved that the minimum number of inputs or driver nodes needed to maintain full control over a network is determined by the “maximum matching” on the network, that is, by the maximum set of links that do not include starting or ending nodes (Fig. 1 c, f, i). A node is called saturated if the link points to the point of maximum matching, otherwise it is free. As we showed in Supplementary Information , the problem of structural manageability corresponds to an equivalent geometric problem in the network: we can get full control over the oriented network, if and only when we directly control each free node, and there are directional paths from the input signals for all saturated nodes 29 . Ability to determine
using this mapping is our first main result. Since the maximum matching in oriented networks can be numerically determined in a number of steps not more than 30 , where L denotes the number of connections, the mapping offers an efficient method for determining driver nodes for an arbitrary oriented network.Real Network Manageability
We used the tools developed earlier to study the manageability of several real networks. Networks were chosen because of their diversity: for example, the purpose of a gene regulation network is to control the dynamics of cellular processes, so it was expected that the result would be a structure that is effective from a control point of view and theoretically should have a small number of driver nodes (i.e. small
). On the contrary, for the manageability of the world wide web or citation networks, this is not to be expected, which makes this question difficult even for . Finally, one could argue that social networks, given their perception neutrality (or even resilience) for management, should have high , because they need to control the majority of people separately to control the entire system. We used mapping to maximum matching in order to determine the minimum set of driver nodes. for networks from Table 1. The obtained data contradicts our expectations: as a group, gene regulation networks exhibit high (0.8), indicating to us that it is necessary to independently control about 80% of the nodes to control them in full. On the contrary, some social networks are characterized by minimal values. , which suggests that several people, in principle, can control the entire system.Table 1 | Characteristics of real networks analyzed in this article
For each network, its type and name are indicated; the number of nodes (N) and connections (L); density of driver nodes calculated in a real network
after randomization with retention of degrees and after complete randomization . For access to data sources and links, see Section VI for Additional Information .Considering that hubs (nodes with a high degree) have an important role in maintaining the structural integrity of the network from disruptions and external influences 31,32 in propagation phenomena 32,33 and in synchronization 8,34 , it would be natural to assume that control over the hubs is necessary for control the entire network. To test the correctness of this hypothesis, we divided the nodes into three groups of equal size depending on their degree, k (low, medium and high). As the figure shows. 2a, b for two canonical network models (Erdos-Renyi 35.36 and scaleless 15.37-39 ), the share of driver nodes is significantly higher among nodes with a low degree than among hubs . In fig. 2c is a graph of the average degree of driver nodes,
from a moderate degree , for each network from Table 1, for several network models. In all cases significantly less than similar , indicating that, in real and simulated systems, driver nodes are usually not hubs.To determine the topological features that define network controllability, we chose the random state of each real network using the full randomization procedure (RAND-ER), which turns the network into an ErdoS-Renyi oriented random network with N and L constants. For several networks there is no correlation between
source network and its randomized state (Fig. 2d), thus, with full randomization by the method of elimination, we conclude that topological characteristics do not affect controllability . We also applied randomization with retention of degrees 40.41 (RAND-degree), which preserves the input degree, and output degree , each node is unchanged, but randomly selects nodes that are connected to each other. We believe that despite the observed differences of six orders of magnitude this procedure does not change substantially. Thus, the controllability of the system largely depends on the distribution of the degrees of network nodes. that is our second and most significant conclusion. He says that is mainly determined by the number of incoming and outgoing connections of each node and does not depend on where the links are pointing.Analytical approach to manageability
The importance of the distribution of degrees, allows analytically determine
for network with arbitrary . Using the saddle point method 42-44 , we obtained a set of self-consistent equations (Section IV, Supplementary Information ), whose input is the distribution of powers, and whose solution for the average (or ) for all network implementations is compatible with what is our third key result. As the figure shows. 2 f, analytically calculated fully consistent with (and therefore must be in good agreement with the exact value ), which provides us with an effective analytical tool for studying the effect of various network parameters on . Although the saddle point method does not offer an analytical solution, we can get from key network parameters in the thermodynamic limit . For example, we found that for the ErdoS-Renyi oriented network at large fair (four). For scale-free networks in the limit, for large 38 , with exponent we have the equation (5), which is in the limit has the same dependence on as equation (4). From equation (5) it follows that is a critical indicator for the controllability of infinite scale-free networks, and only for we can control the entire system through a finite number of nodes (i.e. ). For In the thermodynamic limit, absolutely all nodes must be controlled (i.e., = 1). Note that differs from , which is a critical indicator for a number of network phenomena, from resistance to viral spread 31-33,45 , due to discrepancies . To check the analytical calculations for networks such as ErdoS-Renyi and scale-free networks, we have determined the numerical dependence from which confirms asymptotic exponential dependence from , as predicted by equations (4) and (5). In addition, the predicted value agrees well with the numerical results for (Fig. 3 d, e). However, in the neighborhood , , as predicted by the saddle point method, deviates from the exact value due to the correlation of degrees that are significant for , and can be eliminated by introducing a truncated degree in the construction of scale- free networks 39.46 (Section IV. In Additional Information ). Equation (5) also shows that decreases with increasing (with fixed ), pointing out that depends on the degree of heterogeneity, representing the difference between less connected and more connected nodes. We defined the heterogeneity of the degree as where is the average absolute difference of degrees for all pairs of nodes (i and j) taken from the distribution of degree . The degree of non-uniformity is zero (H = 0) for networks in which all nodes have the same degree, for example, random regular oriented graphs (Fig. 3 a) in which the input and output degrees of the nodes are given to / 2, but nodes are randomly connected. For > = 2, this graph always has a perfect match of 47 (a match containing all the vertices of the graph), which means that a single driver node can control the entire system (section IV.B1 of the Additional Information ).Figure 2 | Characteristics and prediction of the behavior of driver nodes (
).a, b, the role of hubs in the network model. The bars show the percentage of driver nodes
, among nodes with low, medium and high degree nodes for two network models, Erdos-Re'nyi (a) and scale-free (b), with N = 10 4 = 3 ( ), indicating to us that the driver nodes, as a rule, are not hubs. ErdoS-Re'nyi and scale-free networks are generated from static model 38 and the results are averaged over 100 implementations. The error bars (above the main bars), as shown in the figure, are smaller than the values themselves. c, the average degree of driver nodes as compared to the average degree of all nodes in real and model networks, indicates that in real systems, hubs are not driver nodes. d, Number of driver nodes obtained for fully randomized versions of the networks listed in Table 1, compared with the exact value, . e, Number of driver nodes obtained with a degree for randomized versions of the networks shown in Table 1, compared with . f, Analytically calculated obtained using the saddle point method, compared to . In df, the data and error points (SEM) were determined from 1000 implementations of randomized networks.The degree of heterogeneity increases as we move from a random regular directed graph to a network of the ErdoS-Renyi type (Fig. 3 b), and ultimately with a decrease in
to scale-free networks (Fig. 3 c). In general, the share of driver nodes, , monotonically increases with H, while maintaining constant (fig. 3 f) or (Fig. 3 g).Figure 3 | The influence of the network structure on the number of driver nodes. a – c,
Characteristics of the studied network models. Randomly-oriented graph ( a ), shown here for
= 4 is the network with the most uniform distribution of powers, because = = / 2 for all nodes. Erdos – Renyi networks ( b ) have Poisson distribution of degrees, and the degree of heterogeneity for them is determined by . The scale-free networks ( c ) have a power dependence of the distribution of powers, which leads to a huge degree of heterogeneity. d , density of driver nodes, as a function of for Erdo – Renyi (ER) and scale-free (SF) networks with different values . Both scaleless and Erdos – Renyi networks are generated from static model 38 with N = 10 5 . The lines are analytical results and are calculated using the saddle point method using the expected limit. degree distributions.The symbols are calculated for the constructed discrete network: the circles indicate the exact results of the calculation using the maximum matching method, and the crosses indicate the analytical results obtained by the saddle point method using the exact sequence of degrees of the constructed network. For large
, approaching the bottom page, N -1 , that is, the only driver node = 1 on the network of size N. e , as a function of for scale-free networks with fixed . For endless scale-free networks -> 1 because -> = 2, that is, it is necessary to control almost all nodes in order to control the entire network. For finite scale-free networks, -> 1 since -> , that is, it is necessary to control almost all nodes in order to control the entire network. For finite scale-free networks reaches its maximum since approaching ( Additional Information ). f, as a function of the degree of heterogeneity, H, for Erdos – Renyi networks and scale-free networks with fixed and changing . g, nD as a function of H for Erdos – Renyi networks and scale-free networks for fixed and changing . With increasing , the curves converge to the result of networks ErdoS-Renyi (black color) with the corresponding value .Taking these results into account together, we find that the denser the network, the fewer driver nodes are needed to control it, and that small changes in the average cause changes.
order scales. In addition, the greater the difference between the degree of nodes, the greater the number of driver nodes needed to control the system.In general, networks that are sparse and heterogeneous, namely, these characteristics are often observed in complex systems such as cellular networks or the Internet, 13–16 require more driver nodes, emphasizing that such systems are difficult to control.Management Resilience
To see how reliable our ability to manage a network is in situations where some of the links in the network disappear, which inevitably arise, we classify each link into one of three categories (Fig. 1, D, G, J):
“critical”, if in case of its disappearance we need to increase the number of driver nodes to maintain full controllability;
“Redundant” if it can be removed without affecting the current set of driver nodes, or
“Ordinary” if it is neither critical nor superfluous. Figure 4 shows the densities of critical
, redundant, and regular connections for each real network, and it shows that most networks have few or no critical connections. Most connections are normal, which means that they play a role in some management configurations, but these networks can be managed in their absence. Figure 4 | Reference categories in the context of sustainability management.The proportion of critical (red, LC), redundant (green, LR) and normal (gray, LO) links for real networks indicated in Table 1. In order to make the management resistant to link loss, it is enough to double only the critical links, formally making each of these links are redundant, and thus make sure that there are no critical links in the system.
In order to realize the factors that determine
, and in fig. 5 A, C, F we show their dependence for model systems. Behavior easy to understand: for small ones , all connections are important for managing .As it increases, network redundancy increases with decreasing .Increasing redundancy suggests that the density of redundant bonds ,, should always increase with , but this is not so: it reaches a maximum at a critical value. , after which he falls. This non-monotonic behavior is the result of the competition of two topologically different segments of the network, the core and the leaves 43 . The core is a compact cluster of nodes remaining in the network after applying the “protruding” leaf removal 48 , and the leaves are nodes with = 1 or = 1 before or during leaf removal. The nucleus exits through the transition leakage (Fig. 5, B, D): for K < , , so that the system consists only of leaves (Fig. 5 E). With = , there is a small nucleus, reducing the number of leaves. For networks ErdoS-Renyi networks, we assume that = 2e = 5.436564, which is consistent with the numerical results (Fig. 5 a, b), a value that matcheswith
Where reaches a maximum. Really, starts to subside at because for > the number of different maximum matches grows exponentially (Section IV.C of Supplementary Information ) and, as a result, the likelihood that a link does not participate in any management configuration decreases. For scale-free networks, we observe the same behavior, with the proviso that decreases with (Fig. 5, c, d).Discussion and conclusions
Management is one of the central issues in the most complex systems, but due to the lack of a general theory for studying these issues using quantitative methods, we know little about how we can control weighted, oriented networks (configurations that are most often found in real systems). Indeed, the application of the rank condition of Kalman controllability (Eq. (3)) for large networks is excessively computationally, limiting the application of previous work to networks with a number of nodes no more than a few dozen 17-19 . Here we have developed tools for solving a network management problem with arbitrary topology and size. Our main conclusion is that
determined mainly by the distribution of degrees, allows us to use the tools of statistical physics to analytically predict the dependence from by proposing a general formalism to study the effect of network topology on manageability. Figure 5 | Stability management. a, Dependence of the share of critical (red, LC), redundant (green, LR) and normal (gray, LO) connections from Erdos – Renyi: lr networks reaches a maximum at = = 2e, and the derivative LC breaks at = . b, Kernel leakage for Erdos – Renyi networks occurs when = = 2e, which explains peak LR. c, d, Same as a and b, but for scale-free networks. The Erdos – Renyi networks and 38 non-scale networks have N = 10 4 and the results are averaged for ten implementations with an error value defined as sem Dotted lines are only conditionally indicated. e, Core (red) and leaves (green) for small Erdos – Renyi networks (N = 30) with different values ( = 4, 5, 7). The size of the node is proportional to the degree of the node. f, Critical (red), redundant (green) and normal (gray) links over Erdos – Renyi networks with corresponding values .The approach presented here raises a number of questions, the answers to which could further deepen our understanding of the task of managing in difficult conditions. For example, despite the fact that our analytical work focuses on uncorrelated networks, the algorithmic methods that we developed can determine
for arbitrary networks, providing a systematic basis for the question of the role of correlations 40, 49, 50 . Taken together, our results show that when combining the tools of the science of networks and control theory, many aspects of controllability can be studied in an exact analytical way for arbitrary networks, opening up new ways to deepen our understanding of complex systems.Additional Information on the article “Manageability of Complex Networks”available on Nature magazine website.
Links to additional information provided by the author of the translation
1. Concentration of the transcription factor in the gene regulation network
2. Matching theory
3. Kalman's controllability criterion by rank
4. Search by brute force method
5. Saddle point method
Translated by Rabchevsky Eugene .
1. Kalman, RE Mathematical description of linear dynamical systems. J. Soc. Indus. Appl. Math Ser.A 1, 152–192 (1963).
2. Luenberger, DG Introduction to Dynamic Systems: Theory, Models, & Applications (Wiley, 1979).
3. Slotine, J.-J. & Li, W. Applied Nonlinear Control (Prentice-Hall, 1991).
4. Kelly, FP, Maulloo, AK & Tan, DKH Rate control for communication networks: shadow prices, proportional fairness and stability. J. Oper. Res. Soc.49, 237–252 (1998).
5. Srikant, R. The Mathematics of Internet Congestion Control (Birkha¨user, 2004).
6. Chiang, M., Low, SH, Calderbank, AR & Doyle, JC Layering as optimization decomposition: a mathematical theory of network architectures. Proc.IEEE 95, 255–312 (2007).
7. Wang, XF & Chen, G. Pinning control of scale-free dynamical networks. Physica A 310, 521–531 (2002).
8. Wang, W. & Slotine, J.-JE. On partial contraction analysis for coupled nonlinear oscillators. Biol.Cybern. 92, 38–53 (2005).
9. Sorrentino, F., di Bernardo, M., Garofalo, F. & Chen, G. Controllability of complex networks via pinning. Phys. Rev.E 75, 046103 (2007).
10. Yu, W., Chen, G. & Lu¨, J. On pinning synchronization of complex dynamical networks. Automatica 45, 429–435 (2009).
11. Marucci, L. et al. How to switch to a synthetic circuit tunable oscillator, or a bistable switch. PLoS ONE 4, e8083 (2009).
12. Strogatz, SH Exploring complex networks. Nature 410, 268-276 (2001).
13. Dorogovtsev, SN & Mendes, JFF, Evolution of Networks: From the Internet to the Internet and the World Wide Web (Oxford Univ. Press, 2003).
14. Newman, M., Baraba´si, A.-L. & Watts, DJ The Structure and Dynamics of Networks (Princeton Univ. Press, 2006).
15. Caldarelli, G. Scale-Free Networks: Complex Webs in Nature and Technology (Oxford Univ. Press, 2007).
16. Albert, R. & Baraba´si, A.-L. Statistical mechanics of complex networks. Rev. Mod. Phys.74, 47–97 (2002).
17. Tanner, HG in Proc. 43rd IEEE Conf. Decision Contr. Vol.3, 2467–2472 (2004).
18. Lombardi, A. & H¨rnquist, M. Controllability analysis of networks. Phys. Rev.E 75, 56110 (2007).
19. Liu, B., Chu, T., Wang, L., & Xie, G. Controllability of a leader – follower dynamic network with switching topology. IEEE Trans. Automat. Contr. 53, 1009-1013 (2008).
20. Rahmani, A., Ji, M., Mesbahi, M. & Egerstedt, M. Controllability of Multi-Agent Systems from a graph-theoretic perspective. SIAM J. Contr. Optim. 48, 162-186 (2009).
21. Kim, D.-H. & Motter, AE Slave nodes and the controllability ofmetabolic networks. NJ Phys. 11, 113047 (2009).
22. Mesbahi, M. & Egerstedt, M. Graph Theoretic Methods in Multiagent Networks (Princeton Univ. Press, 2010).
23. Motter, AE, Gulbahce, N., Almaas, E. & Baraba´si, A.-L. Predicting synthetic rescues in metabolic networks. Mol. Syst. Biol.4, 168 (2008).
24. Pastor-Satorras, R. & Vespignani, A. Evolution and Structure of the Internet: A Statistical Physics Approach (Cambridge Univ. Press, 2004).
25. Lezon, TR, Banavar, JR, Cieplak, M., Maritan, A. & Fedoroff, NV. Proc. Natl Acad. Sci.USA 103, 19033–19038 (2006).
26. Lin, C.-T. Structural controllability. IEEE Trans. Automat. Contr.19, 201–208 (1974).
27. Shields, RW & Pearson, JB Structural controllability of multi-input linear systems. IEEE Trans. Automat. Contr. 21, 203–212 (1976).
28. Lohmiller, W. & Slotine, J.-JE On contraction analysis for nonlinear systems. Automatica 34, 683–696 (1998).
29. Yu, W., Chen, G., Cao, M., & Kurths, J. Non-linearar dynamics. IEEE Trans. Syst.Man Cybern. B 40, 881–891 (2010).
30. Hopcroft, JE & Karp, RM An n5 / 2 algorithmfor maximummatchings in bipartite graphs. SIAM J. Comput. 2, 225–231 (1973).
31. Albert, R., Jeong, H. & Baraba´si, A.-L. Error and attack tolerance of complex
networks. Nature 406, 378–382 (2000).
32. Cohen, R., Erez, K., Ben-Avraham, D., & Havlin, S. Resilience to Internet Breakdowns. Phys. Rev.Lett. 85, 4626–4628 (2000).
33. Pastor-Satorras, R. & Vespignani, A. Epidemic spreading in scale-free networks. Phys. Rev.Lett. 86, 3200–3203 (2001).
34. Nishikawa, T., Motter, AE, Lai, Y.-C. & Hoppensteadt, FC Heterogeneity in oscillator networks: are they smaller worlds easier to synchronize? Phys. Rev.Lett. 91, 014101 (2003).
35. Erdo˝s, P. & Re´nyi, A. On the evolution of random graphs. Publ. MathInst. Hung. Acad. Sci.5, 17–60 (1960).
36. Bolloba´s, B. Random Graphs (Cambridge Univ. Press, 2001).
37. Baraba´si, A.-L. & Albert, R.Emergence of scaling in randomnetworks. Science 286, 509-512 (1999).
38. Goh, K.-I., Kahng, B., & Kim, D. Phys. Rev.Lett. 87, 278701 (2001).
39. Chung, F. & Lu, L. Connected component in random graphs with given expected degree sequences. Ann. Combin. 6, 125–145 (2002).
40. Maslov, S. & Sneppen, K. Specificity and stability in topology of protein networks. Science 296, 910–913 (2002).
41. Milo, R. et al. Network motifs: simple building blocks of complex networks. Science 298, 824–827 (2002).
42. Me´zard, M. & Parisi, G. The Bethe lattice spin glass revisited. Eur. Phys.J. B 20, 217-233 (2001).
43. Zdeborova´, L. & Me´zard, M. The number of match graphs in random graphs. J. Stat. Mech. 05, 05003 (2006).
44. Zhou, H. & Ou-Yang, Z.-c. Maximum matching on random graphs. Preprint at http://arxiv.org/abs/cond-mat/0309348æ (2003).
45. Callaway, DS, Newman, MEJ, Strogatz, SH & Watts, DJ Network robustness and fragility: percolation on random graphs. Phys. Rev.Lett. 85, 5468–5471 (2000).
46. Bogun˜a´, M., Pastor-Satorras, R. & Vespignani, A. c. Eur. Phys.J. B 38, 205–209 (2004).
47. Lova´sz, L. & Plummer, MD Matching Theory (American Mathematical Society, 2009).
48. Bauer, M. & Golinelli, O. Core percolation in random graphs: a critical phenomena analysis. Eur. Phys.J. B 24, 339–352 (2001).
49. Newman, MEJAssortativemixinginnetworks.Phys.Rev.Lett.89,208701 (2002).
50. Pastor-Satorras, R., Va´zquez, A. & Vespignani, A. Dynamic and correlation properties of the Internet. Phys. Rev.Lett. 87, 258701 (2001).
Source: https://habr.com/ru/post/201284/
All Articles