Mail.Ru rating: news from the field
Enough time has passed since our last news rating digest . Since then, we have not been idle and have made a number of innovations in the rating service. Let me introduce you to them in bulk.

Solution of the demographic problem
In our Mail, 60-70% of the Runet are active, and we have long used information from the completed mail questionnaires to populate the Rating database. But 60% is still not 100% and the time has come to take the next step. Now, for the remaining 30-40%, we additionally analyze data from their profiles on Odnoklassniki. Naturally, this made it possible to increase the accuracy of statistics and now we operate on data from 75% of runet users. At the same time, the degree of coverage increases to 88%, if judged not by unique users, but by views. As before, demographic data can be used as a filter in other reports.
Time matters
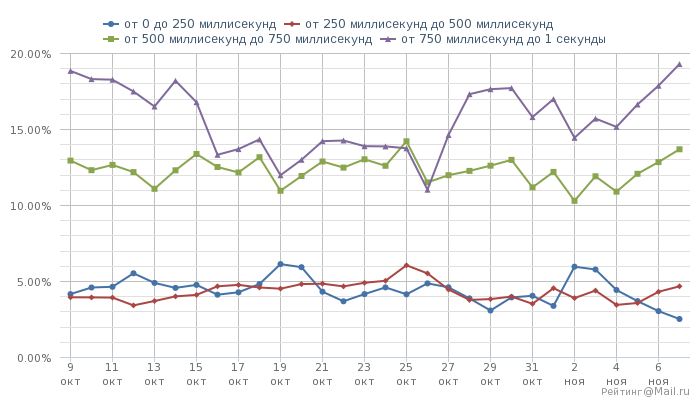
At the end of August, the Rating got a new report, Page load time .
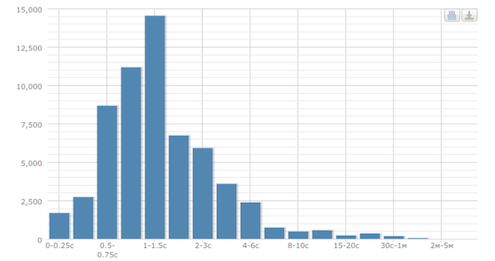
The reason for the creation of this report were the results of a number of studies, according to which an increase in page load time leads to huge losses. For example, according to Amazon, every extra second of loading gives lost profits of up to $ 1.6 billion a year. Akami claims that if the page loads for 3 seconds, then 40% of users lose their patience and go. As you understand, such visitors are unlikely to return.
We found that despite the abundance of all sorts of tools to optimize page load time, none of them can tell how much time it eventually loads. Many factors affect loading time: page cache, bandwidth, computer power, software used. As a result, a “heavy” page can completely bury all the costs of SEO and UX optimization.
A little about technology .
In the report, Screens now presents data on the user screens used, including touch screens, and the Flash report contains data on the prevalence of this remarkable technology and its versions. Unfortunately, all these reports require a new counter code and show the real picture only on those sites that last updated the code no earlier than May of this year.
')
Where does the visitor'schildhood go?
We think it is no secret to anyone that the inconvenient and confusing design of the page is unlikely to make visitors want to continue traveling through your site. But how to understand if the interface you created is successful? Indirectly, this can tell the behavior of users on your site, for example, where did they go after getting to the page: to other pages of the site or gone completely?
When creating a new report “Pages and Transitions” in the Rating, we tried to make such a presentation of information that would be equally visual for sites of any workload.
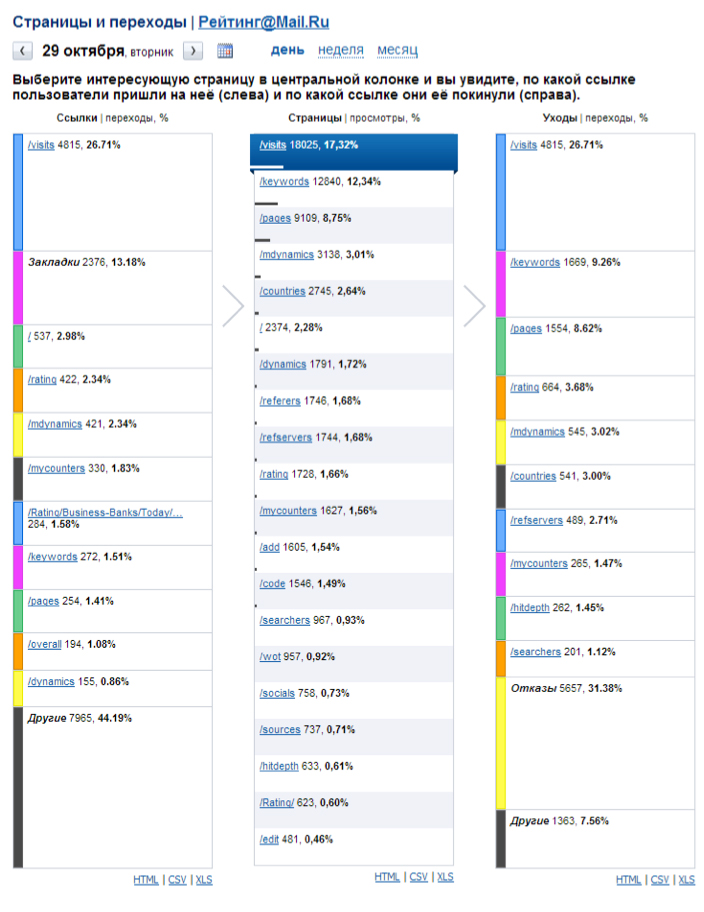
When you select a page in the center column, you immediately see where the user came from and where they went. “Waivers” means going to other sites.
Thanks to a custom list of "mirrors" you can distinguish external transitions from internal ones (they are displayed without specifying a domain).
We hope for the New Year we will please you with new features of our service!
Solution of the demographic problem
In our Mail, 60-70% of the Runet are active, and we have long used information from the completed mail questionnaires to populate the Rating database. But 60% is still not 100% and the time has come to take the next step. Now, for the remaining 30-40%, we additionally analyze data from their profiles on Odnoklassniki. Naturally, this made it possible to increase the accuracy of statistics and now we operate on data from 75% of runet users. At the same time, the degree of coverage increases to 88%, if judged not by unique users, but by views. As before, demographic data can be used as a filter in other reports.
Time matters
At the end of August, the Rating got a new report, Page load time .
The reason for the creation of this report were the results of a number of studies, according to which an increase in page load time leads to huge losses. For example, according to Amazon, every extra second of loading gives lost profits of up to $ 1.6 billion a year. Akami claims that if the page loads for 3 seconds, then 40% of users lose their patience and go. As you understand, such visitors are unlikely to return.
We found that despite the abundance of all sorts of tools to optimize page load time, none of them can tell how much time it eventually loads. Many factors affect loading time: page cache, bandwidth, computer power, software used. As a result, a “heavy” page can completely bury all the costs of SEO and UX optimization.
A little about technology .
In the report, Screens now presents data on the user screens used, including touch screens, and the Flash report contains data on the prevalence of this remarkable technology and its versions. Unfortunately, all these reports require a new counter code and show the real picture only on those sites that last updated the code no earlier than May of this year.
')
Where does the visitor's
We think it is no secret to anyone that the inconvenient and confusing design of the page is unlikely to make visitors want to continue traveling through your site. But how to understand if the interface you created is successful? Indirectly, this can tell the behavior of users on your site, for example, where did they go after getting to the page: to other pages of the site or gone completely?
When creating a new report “Pages and Transitions” in the Rating, we tried to make such a presentation of information that would be equally visual for sites of any workload.
When you select a page in the center column, you immediately see where the user came from and where they went. “Waivers” means going to other sites.
Thanks to a custom list of "mirrors" you can distinguish external transitions from internal ones (they are displayed without specifying a domain).
We hope for the New Year we will please you with new features of our service!
Source: https://habr.com/ru/post/201244/
All Articles