A simple way to assess the importance of search queries for the site
Prologue
Today, dozens of articles have been written on how to assemble a complete and qualitatively semantic core, but almost nothing is said about how to use this information for analytics.
One of the most frequent problems of my clients is budget constraints. In this case, it is important to accurately prioritize each request. In the material, I will show one of the easiest and fastest, but effective ways to determine the importance of requests for your site. And it is not just “important, not important, very important”, but quite specific numbers that can be compared and analyzed. For example, I will use real, but simplified data.
Also, I will give an example of using this data to analyze an advertising campaign in Yandex.Direct.
The internet marketing god sent us a ready-made semantic core, and now we have a list of requests with the number of hits per month. In the beginning it was a much larger list, but we weed out of it uninteresting to us (for various reasons). I will show all tables with screenshots, tried HTML, but it looks worse and unreadable.
')
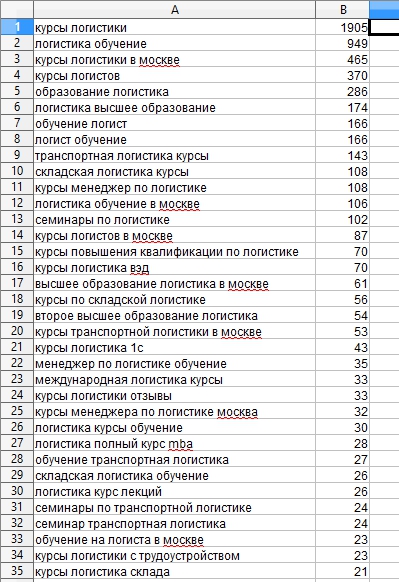
What can we say looking at this table? It is clear that “logistics courses” with almost 2000 shows per month definitely deserve a larger percentage of the budget and attention than “warehouse logistics courses” with 21 shows. But how to be like, for example, with these two requests? Which one is more important to you?
And we have neither the time nor the money to conduct test companies, to get statistics, and we need analytics now (and more often yesterday).
To get the measure of these requests, we add to our calculations two indicators: “Relevance of the request” and “Benefit for business”.
The relevance of the request - measured from 0 to 1, shows how much our service is able to solve the problem of the visitor.
Benefit for business - measured from 0 to 1, shows how much benefit we will get by solving the client’s problem. In this case, the benefit is money. In rare cases, it happens, something else.
Expose Relevance
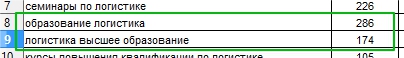
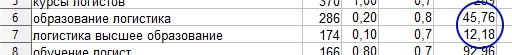
"Education logistics" - most likely, people here are almost always looking for higher and secondary educational institutions. We set the relevance at - 0.2.
“Logistics higher education” is definitely a very far from us service, at the same time, we consider ourselves to be an education, because we have state accreditation. We put 0.1.
Determine business benefits
We will not become professionals in all sectors of modern society, and if we can try to set the previous parameter on our own, having familiarized ourselves with the content of the site, then here I recommend that you only do this together with a client. In an ideal world, it is better to put both parameters in the direct communication mode between you and the client, since you do not understand the intricacies of his business, better than him. By discussing together, asking each other questions, you will quickly find the truth, and the work process itself will become more transparent for the client. Two heads are always better, provided both are adequate.
Together with the client, we put down such factors.
"Education logistics" - 0.8
"Logistics higher education" - 0.7
Yes, indeed, the indicators are definite, approximately, and counted by intuition and flair, but still, to varying degrees, characterize and associate virtual queries with the real world.
All these three parameters are directly proportional to the significance of the request for our project. Simply put, the more each of them, the better. Direct proportionality is represented by multiplication. Multiplying all the parameters, we obtain the coefficient reflecting the synergy of the three indicators.
This factor helps us determine the importance and quality of each request for us at the moment. And it’s great to show that you can influence it in two ways - either add and change services in order to solve the client’s problem as accurately as possible, or learn to squeeze more benefits from the client. But this is not for me, but for the guys from Price Waterhouse.
Let's add data from Yandex.Direct to our table - the approximate number of clicks to the site and the average cost of a click with so many clicks.
The approximate number of conversions is calculated using the formula for the number of impressions / 100 x CTR.
The approximate number of transitions is still directly proportional (the more, the better), but the average price is not, here is an inversely proportional relationship.
Final formula
(Number of impressions x number of conversions x relevance x benefit) / average cost per click
Great, now we were able to determine this factor for using queries in Yandex.Direct. This is in itself an interesting factor by which it is convenient to rank queries.
The sum of all the coefficients is the total weight of this company, according to it you can perfectly rank the lists of companies. But now, we need to calculate the value of 1%.
1% = (sum of coefficients of all requests) / 100
Usage example 1%
Take the query weight of the semantic core "logistics courses" 18565.68 and divide by the amount of one percent, it will turn out about 65%. It is this time that you need to devote time to work on this request, the means and the attention from the possible, it is on so much that the success of the company depends on this request.
But, the importance of this request was visible even without this magic with OpenOffice Calc, what does this value about two other requests show us?
education logistics 1.27%
logistics higher education 0.48%
In the concrete example, there was a rather modest budget and the absolute values of course differed little. But on a larger scale, this approach allows you to more accurately focus the budget and get more benefits.
PS
I would like to note that I told you about the simplest method. To more accurately determine the importance of adding other important parameters, such as competitiveness, the price of promotion and the price of one click from SEO promotion.
It would be interesting to hear questions and your opinion.
Source: https://habr.com/ru/post/200918/
All Articles