Diagnostics of incidents on the fly
It can be assumed that most of the incidents recorded in the Service Desk are typical. In this case, it is both possible and useful to automate the process of not only registering, but also diagnosing incidents, so that the Support Service would receive not only diagnostic information, but also the most likely diagnosis, which would only need to be confirmed (or rejected if the system made a mistake). ).
This concept - on-the-fly diagnostics of incidents - we invite you to discuss.

')
To diagnose incidents on the fly you need:
Diagnostic Knowledge Base is a database containing information on the root causes of incidents.
The presence of the Diagnostic Knowledge Base will significantly improve the efficiency of the Service Desk, regardless of whether the incident is diagnosed on the fly or as usual. Many companies in one form or another already have a knowledge base, so the Diagnostic Knowledge Base can be an addition to what is already there. In most cases, no significant alteration of the existing knowledge base is required.
Two basic (principal) differences between the Diagnostic Knowledge Base and the knowledge bases, which are usually used by technical support services, should be distinguished:
Both tasks can be solved, including the implementation of the Red Button solution.
On the user side, a formal description of the incident is created (Incident Snapshot). You can do this manually (using a properly designed web form) or automatically using the Red Button. The second, of course, is better, because it allows you to get data more complete and more accurate (for example, the exact time of the incident). The composition of the Incident Image in an abbreviated form is shown in the figure (see below).

Composition of the Picture of the Incident in abbreviated form
A snapshot of the Incident is taken by the Information Aggregator and its contents are recorded in a consolidated database located there.
On the Information Aggregator, an expert system is running, which uses special tests (Expertise) to analyze the contents of the consolidated database in real time. Having discovered the appearance of a new Snapshot of the Incident, the Expertise forms a Request for assessing the quality of IT Infrastructure, which is sent to the Monitoring System.
Request parameters:

Figure 3. Assessing the quality of IT infrastructure.
The quality assessment of an IT infrastructure component is a synthesized indicator that is obtained by combining the assessments of all significant metrics that characterize the performance of the assessed IT infrastructure component.
Metric evaluation is a comparison of its values with threshold values.
When using the Monitoring System that supports the service and resource model, it will not be difficult to obtain Quality Assessments of the IT Infrastructure. If the service-resource model is not supported, then the problem is solved by adding the corresponding directory to the Information Aggregator. In any case, the Monitoring System and the Information Aggregator should be integrated with each other.
In ProLAN products, the Quality Assessments of the components of the IT Infrastructure have five meanings: good, acceptable, needs attention, on the verge, bad .
Having received Quality Assessments, the Expertise forms a request to the Diagnostic Knowledge Base. In a simplified form, the diagnostic Knowledge Base can be presented in the form of a table shown below.

The key elements are the elements of the directory “What happened” (included in the Snapshot of the Incident). As significant parameters determining the probable diagnosis, firstly, the parameters of the user's environment (included in the Incident Image) are used, and secondly, the Quality Assessments obtained from the Monitoring System.
The more fully defined the list of significant parameters, and the more precisely the range of their values is determined, the higher the probability of obtaining a single, correct diagnosis.
Having obtained a probable diagnosis (or diagnoses) from the Diagnostic Knowledge Base, the Expertise includes it in the Aggregated Incident Snapshot, which is automatically sent to the Service Desk. (In addition to the diagnosis, the values of the relevant important parameters and the images of the incidents that initiated its appearance are included in the Aggregated Incident Image.)
Such is the concept. I would like to hear your criticism, suggestions, objections, indications of possible applications, etc. -?
This concept - on-the-fly diagnostics of incidents - we invite you to discuss.
Architecture

')
To diagnose incidents on the fly you need:
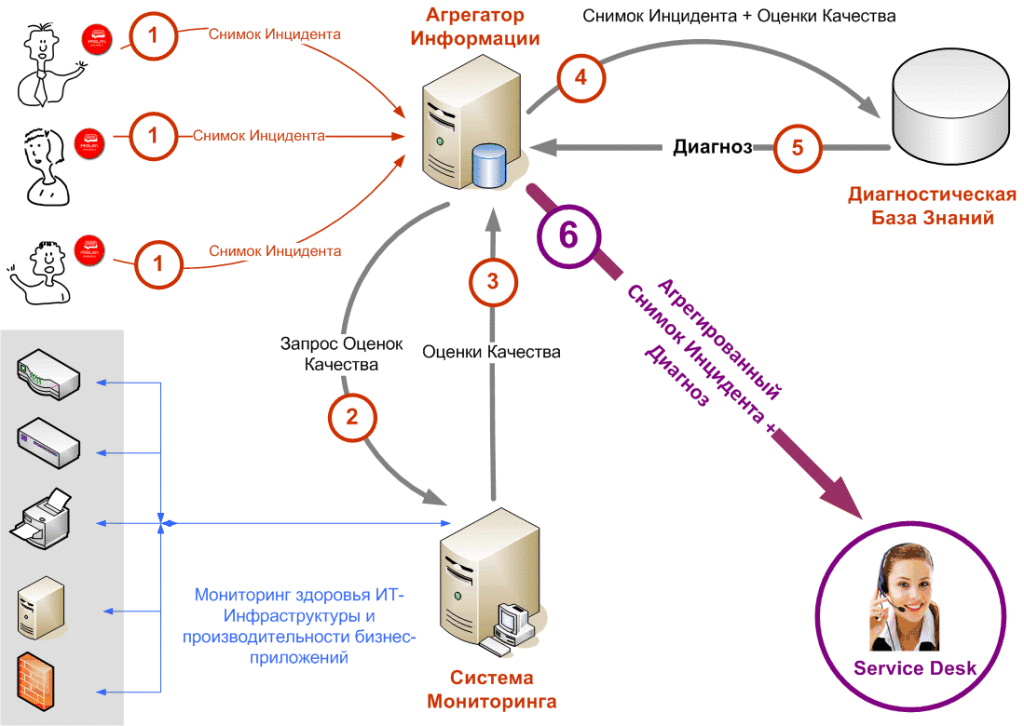
- Formal description of the incident by the user (Snapshot of the Incident). The Incident Snapshot is assumed to be formed by the Red ProLAN Button.
- Monitoring system. It is assumed to use the ProLAN monitoring system.
- Aggregator Information. The Information Aggregator should be able to take Incident Snapshots, save them in a database, process the contents of the database in real time and interact with the Monitoring System, Diagnostic Knowledge Base and Service Desk.
- Diagnostic knowledge base.
- Service Desk - system.
Diagnostic Knowledge Base
Diagnostic Knowledge Base is a database containing information on the root causes of incidents.
The presence of the Diagnostic Knowledge Base will significantly improve the efficiency of the Service Desk, regardless of whether the incident is diagnosed on the fly or as usual. Many companies in one form or another already have a knowledge base, so the Diagnostic Knowledge Base can be an addition to what is already there. In most cases, no significant alteration of the existing knowledge base is required.
Two basic (principal) differences between the Diagnostic Knowledge Base and the knowledge bases, which are usually used by technical support services, should be distinguished:
- Key elements for determining the diagnosis are the descriptions of incidents "the eyes of users." Therefore, the task number 1 is to systematize incidents, as they see users of IT Services.
- The relevant parameters are the Quality Assessments of the components of the IT infrastructure. Therefore, task 2 is to correctly determine the threshold values of the health metrics of the IT infrastructure, which are necessary for obtaining Quality Assessments.
Both tasks can be solved, including the implementation of the Red Button solution.
Algorithm for diagnosing incidents "on the fly"
Step 1
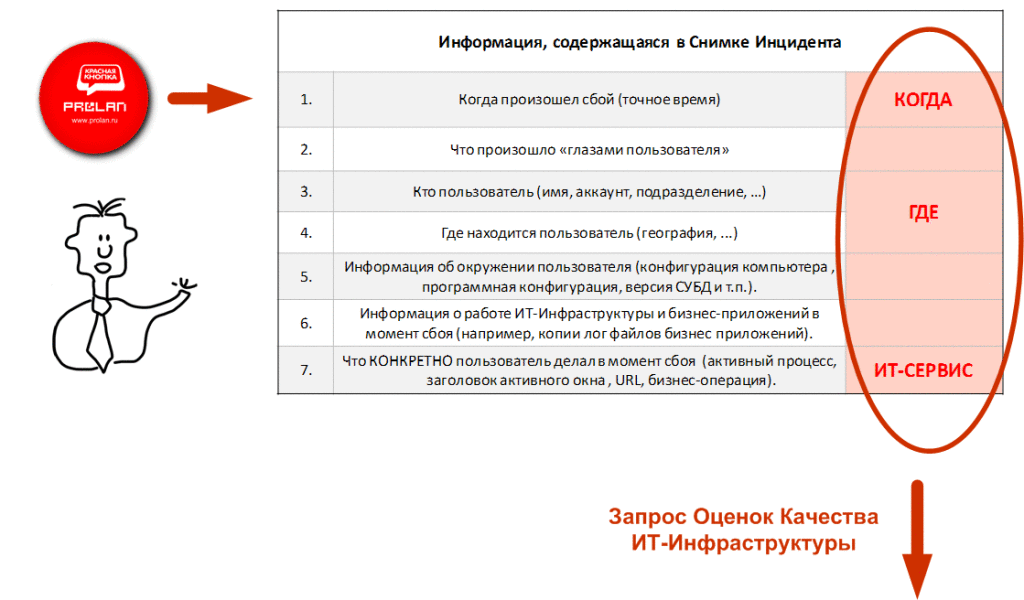
On the user side, a formal description of the incident is created (Incident Snapshot). You can do this manually (using a properly designed web form) or automatically using the Red Button. The second, of course, is better, because it allows you to get data more complete and more accurate (for example, the exact time of the incident). The composition of the Incident Image in an abbreviated form is shown in the figure (see below).

Composition of the Picture of the Incident in abbreviated form
A snapshot of the Incident is taken by the Information Aggregator and its contents are recorded in a consolidated database located there.
Steps 2-3
On the Information Aggregator, an expert system is running, which uses special tests (Expertise) to analyze the contents of the consolidated database in real time. Having discovered the appearance of a new Snapshot of the Incident, the Expertise forms a Request for assessing the quality of IT Infrastructure, which is sent to the Monitoring System.
Request parameters:
- The Where and IT Service parameters determine the Quality Assessments of which components of the IT Infrastructure must be obtained from the Monitoring System (see figure below). For example, if the Incident Snapshot was received from a SAP CRM user located in St. Petersburg, then it is necessary to obtain: Peter-Moscow communication channel quality assessment, SAP CRM application server quality assessment, SAP CRM database quality assessment.
- The When parameter determines for which point in time it is necessary to obtain Quality Assessments of the components of the IT infrastructure.

Figure 3. Assessing the quality of IT infrastructure.
The quality assessment of an IT infrastructure component is a synthesized indicator that is obtained by combining the assessments of all significant metrics that characterize the performance of the assessed IT infrastructure component.
Metric evaluation is a comparison of its values with threshold values.
When using the Monitoring System that supports the service and resource model, it will not be difficult to obtain Quality Assessments of the IT Infrastructure. If the service-resource model is not supported, then the problem is solved by adding the corresponding directory to the Information Aggregator. In any case, the Monitoring System and the Information Aggregator should be integrated with each other.
In ProLAN products, the Quality Assessments of the components of the IT Infrastructure have five meanings: good, acceptable, needs attention, on the verge, bad .
Steps 4-5
Having received Quality Assessments, the Expertise forms a request to the Diagnostic Knowledge Base. In a simplified form, the diagnostic Knowledge Base can be presented in the form of a table shown below.

The key elements are the elements of the directory “What happened” (included in the Snapshot of the Incident). As significant parameters determining the probable diagnosis, firstly, the parameters of the user's environment (included in the Incident Image) are used, and secondly, the Quality Assessments obtained from the Monitoring System.
The more fully defined the list of significant parameters, and the more precisely the range of their values is determined, the higher the probability of obtaining a single, correct diagnosis.
Step 6
Having obtained a probable diagnosis (or diagnoses) from the Diagnostic Knowledge Base, the Expertise includes it in the Aggregated Incident Snapshot, which is automatically sent to the Service Desk. (In addition to the diagnosis, the values of the relevant important parameters and the images of the incidents that initiated its appearance are included in the Aggregated Incident Image.)
Attention question
Such is the concept. I would like to hear your criticism, suggestions, objections, indications of possible applications, etc. -?
Source: https://habr.com/ru/post/200544/
All Articles