Spread of epidemics: Social media analysis VS. Google Flu Query Analysis
Have you heard of Google Flu? Using analysis of search queries, Google builds a graph of the dynamics of "incidence" in time. We decided to check the data of Google, comparing them with the number of references to various cold symptoms in social media in Russia: when and where outbreaks of epidemics were recorded, who often gets sick and what does he complain about? Answers under the cut.

Period: 09/01/13 - 10/31/13
Analyzed messages on social networks VKontakte, Twitter, Facebook, LJ, and others from Russia using the Brand Analytics system.
Messages with words and phrases “cough”, “sore throat”, “fever”, “body ache” acted as indicators of colds.
In total, over 220 thousand such messages from Russia from 165 thousand authors were recorded during this period.
')
During the “normal” period, Russian authors, on average, write 2,500–3,000 messages a day containing references to symptoms of colds. The sharp increase in the number of such messages is observed from September 7 to September 22 , which indicates a period of seasonal colds. Its peak falls on September 12 - 7,844 messages .

The sharp onset of autumn this year played its role, and, quite expectedly, provoked an outbreak of morbidity.
The results of our study, first, correlate with the data of Google Flu: the period of the maximum number of requests falls on September 8-22 of this year.
Secondly, social media data is more accurate in time - pay attention to the correlation between the complaints about the well-being in social networks and search queries:
To test our assumption (we firmly believe in it, but the prognostic is not a fortune teller and requires facts), we will follow the monitoring and promise to immediately share the result of observations and inform in advance when it is better to save ourselves and loved ones from the next epidemic of influenza and ARD.

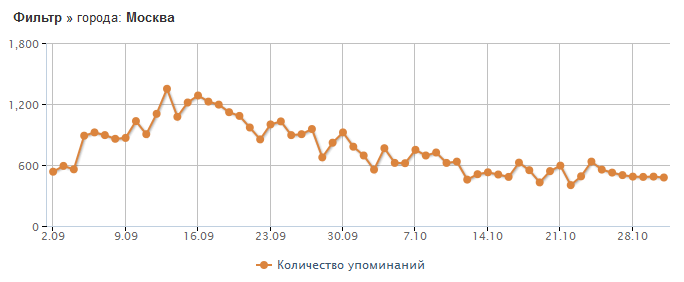
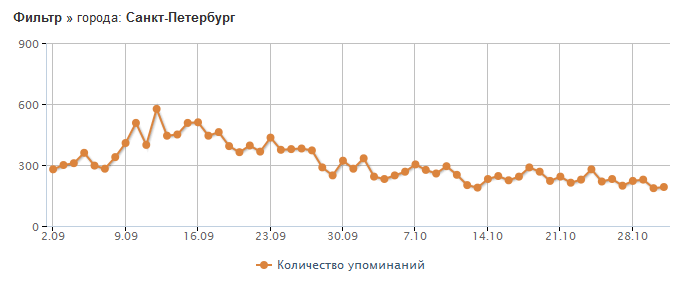
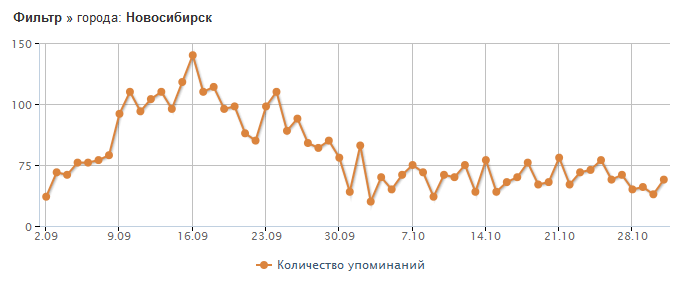
It is interesting to analyze the features of the spread of diseases on the map of Russia. We investigated the periods of seasonal diseases in different cities of our country and came to two main conclusions: a) the peak of the disease was observed in all cities, but of varying strength and b) everywhere the period of seasonal diseases coincides in time.
For example, the peak of diseases in Moscow is pronounced and falls on September 12, and the period of seasonal diseases completely coincides with the period of diseases in Russia.

In St. Petersburg, an increase in diseases is seen from September 7, but in comparison with Moscow, this increase is not so sharp and significant. Although the peak of the disease could also be observed on the 2nd week of September.

And finally, the city with the most pronounced period of seasonal colds - Novosibirsk. The graph shows an increase in cases from 8 to 30 September, the peak of the disease (September 16), which has the greatest strength in comparison with Moscow and St. Petersburg.

This year, during the period of seasonal diseases (September), social media authors often complained about the following aspects of their health:

Be healthy!

Period: 09/01/13 - 10/31/13
Analyzed messages on social networks VKontakte, Twitter, Facebook, LJ, and others from Russia using the Brand Analytics system.
Messages with words and phrases “cough”, “sore throat”, “fever”, “body ache” acted as indicators of colds.
In total, over 220 thousand such messages from Russia from 165 thousand authors were recorded during this period.
')
During the “normal” period, Russian authors, on average, write 2,500–3,000 messages a day containing references to symptoms of colds. The sharp increase in the number of such messages is observed from September 7 to September 22 , which indicates a period of seasonal colds. Its peak falls on September 12 - 7,844 messages .

The sharp onset of autumn this year played its role, and, quite expectedly, provoked an outbreak of morbidity.
Comparison with Google Flu results
The results of our study, first, correlate with the data of Google Flu: the period of the maximum number of requests falls on September 8-22 of this year.
Secondly, social media data is more accurate in time - pay attention to the correlation between the complaints about the well-being in social networks and search queries:
- September 12, we fix the peak of social media messages about painful symptoms,
- September 15 (that is, 3 days later), exhausted influenza, are trying to find a cure in Google.
To test our assumption (we firmly believe in it, but the prognostic is not a fortune teller and requires facts), we will follow the monitoring and promise to immediately share the result of observations and inform in advance when it is better to save ourselves and loved ones from the next epidemic of influenza and ARD.

Geography
It is interesting to analyze the features of the spread of diseases on the map of Russia. We investigated the periods of seasonal diseases in different cities of our country and came to two main conclusions: a) the peak of the disease was observed in all cities, but of varying strength and b) everywhere the period of seasonal diseases coincides in time.
For example, the peak of diseases in Moscow is pronounced and falls on September 12, and the period of seasonal diseases completely coincides with the period of diseases in Russia.

In St. Petersburg, an increase in diseases is seen from September 7, but in comparison with Moscow, this increase is not so sharp and significant. Although the peak of the disease could also be observed on the 2nd week of September.

And finally, the city with the most pronounced period of seasonal colds - Novosibirsk. The graph shows an increase in cases from 8 to 30 September, the peak of the disease (September 16), which has the greatest strength in comparison with Moscow and St. Petersburg.

The most common complaints
This year, during the period of seasonal diseases (September), social media authors often complained about the following aspects of their health:
- Sore throat - 16.65% of the total number of messages
- Heat and fever - 8.52% of the total number of messages
- Headache - 2.43% of the total number of messages
- Cough - 2.38% of the total number of messages
- Breaks the body - 1.55% of the total number of messages
- Droppings - 1.14% of the total number of messages

Be healthy!
Source: https://habr.com/ru/post/200540/
All Articles