PVS-Studio for Visual C ++
A long time ago, all our articles began to be devoted to anything, but not only to the PVS-Studio tool itself. We talk about proven projects, about the intricacies of the C ++ language, about creating plugins in C #, about launching PVS-Studio from the command line. But after all, first of all, PVS-Studio is focused on developers using Visual Studio. We have done a lot to make it convenient to use our tool. But just this often happens behind the scenes. I decided to correct this situation and tell you about the PVS-Studio plugin from scratch. If you are using Visual C ++, this article is for you.
What is static code analysis and why is it needed?
Static code analysis is the process of identifying errors and shortcomings in the source code of programs. Static analysis can be viewed as an automated code review process. Joint code review , great methodology. But it has a significant drawback - the high cost. It is necessary to regularly assemble several programmers to review a new code or re-review a code after making recommendations.
On the one hand, I want to regularly review the code. On the other hand, it is too expensive. A compromise solution is static code analysis tools. They tirelessly process the source code of the programs and give the programmer recommendations to pay special attention to certain parts of the code. Of course, the program will not replace a full review of the code performed by a team of programmers. However, the benefit / price ratio makes using static analysis a very useful practice used by many companies.
There are a large number of commercial and free static code analyzers. A large list of static analyzers is available on Wikipedia: List of tools for static code analysis . The list of languages for which static code analyzers exist is also quite large (C, C ++, C #, Java, Ada, Fortran, Perl, Ruby, ...). Naturally, we will tell you about the PVS-Studio analyzer.
')
The main advantage of static analysis is the possibility of significantly reducing the cost of eliminating defects in the program. The earlier the error is detected, the lower the cost of fixing it. So, according to the data given in McConnell's “Perfect Code”, the correction of an error at the testing stage is ten times more expensive than at the design stage (writing code):
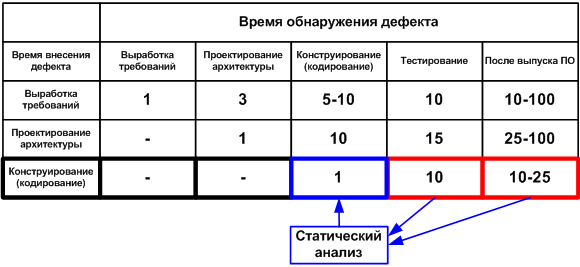
Figure 1. The average cost of correcting defects depending on the time of their introduction and detection (data for the table are taken from S. McConnell's “Perfect Code”). Click on the picture to enlarge it.
Static analysis tools allow you to identify a large number of errors in the design phase, which significantly reduces the development cost of the entire project. For example, the PVS-Studio static code analyzer can run in the background immediately after compilation and, in case a potential error is found, notify the programmer. More about this mode will be described below.
The topic of code review and static analysis is described in more detail in the articles, the links to which are given at the end of the article [ 1 , 2 , 3 ].
PVS-Studio static code analyzer
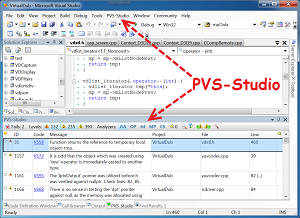
PVS-Studio is a static analyzer that detects errors in the source code of C, C ++, C ++ 11, C ++ / CX applications. First of all, it is focused on Visual Studio users (on support for other environments, see the product page ). The analyzer perfectly integrates into VS2005 - VS2012. Soon we will add support for VS2013. As a result, users receive an additional item “PVS-Studio” in the main menu and a window for working with diagnostic messages (see Figure 2).
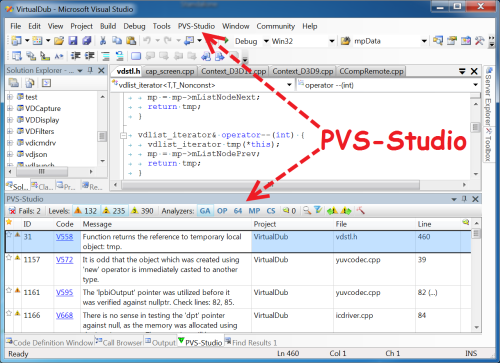
Figure 2. Main elements added by the PVS-Studio analyzer when integrated into Visual Studio. Click on the picture to enlarge it.
Initial settings
The analyzer is ready for operation immediately after installation. In most cases, you do not need to configure anything to make the first launch. The only setting you might need at the beginning is to exclude third-party libraries. You still will not edit anything in the source files of the jpeg library. Therefore, there is no need to check it. In addition, excluding folders from analysis will shorten the analysis time. Excluded from the analysis directories are set here: Options-> Dont't Check Files-> PathMasks (see Figure 3).

Figure 3. Editing the list of directories that the analyzer will not check. Click on the picture to enlarge it.
If there is one of the specified names in the full file path, the analysis will not be performed. By default, the list already includes the names of some directories. However, in your project the folder with the ZLib library may not be called “zlib”, but, for example, “zip_lib”. Therefore, you should edit this list. To start editing, click the button with three dots.
Examples of valid masks for the PathMasks list:
- c: \ Libs \ - all project files located in this folder and its subfolders will be excluded.
- \ Libs \ or * \ Libs \ * - all files located in directories, the path to which contains the “Libs” subfolder, will be excluded. If the characters "*" are not specified, they will still be automatically added, so both recording options are the same.
- Libs or * Libs * - all files to which the path contains a subfolder that has 'Libs' as a name or a fragment of a name will be excluded. Also in this case, files containing Libs in the name will be excluded, for example, c: \ project \ mylibs.cpp. To avoid confusion, we recommend always using slashes.
Project Verification
Upon completion of the initial settings, you can proceed to check the project. Most likely, you can immediately try to check the entire solution. To do this, select the menu item PVS-Studio-> Check-> Solution (see Figure 4).
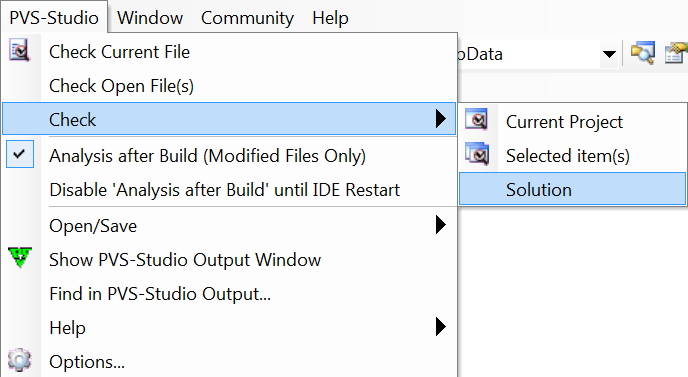
Figure 4. Solution check using the PVS-Studio analyzer.
If there are any difficulties with the verification, we recommend that you refer to the section “ Can not verify? ” On our website. This is not a stupid recommendation in the spirit of "check that the plug is plugged in." The section describes typical situations that users have approached us with and suggested options for action.
Work with a list of diagnostic messages
After verification, all diagnostic messages will be displayed in a special window. The window has many controls. All of them serve to show exactly those diagnostic messages that are interesting to the user. However, at first the window may seem complicated. Let's look at all the controls (see Figure 5).
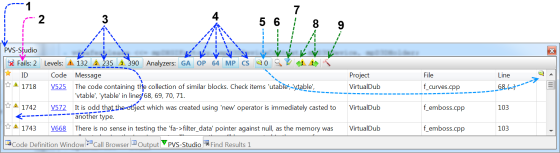
Figure 5. Window with diagnostic messages. Click on the picture to enlarge it.
- The PVS-Studio window itself.
- The button includes the message "something went wrong." For example, it is not possible to preprocess one of the files.
- Buttons that include warnings of different levels. Now all three levels of diagnostics are included. In this case, the window displays 132 warnings of the first level, 235 warnings of the second level and 390 warnings of the third level. The message level is shown in one of the columns as a triangle with a number.
- Active sets of diagnostic rules. GA - general diagnostics, OP - micro-optimizations, 64 - 64-bit diagnostics, MP - errors related to OpenMP, CS - user diagnostics. Now the window displays warnings related to GA and MP.
- Enable / disable the display of messages marked as false. Showing false warnings now. You can read more about this functionality in the documentation: Suppressing false warnings .
- Search among diagnostic messages.
- Quick filters. You can, for example, leave in the list only messages with the code V501 and that are in the project XYZ.
- Go to previous / next post. This opens the corresponding file, and the cursor is placed on the line with a potential error. Also, you can always select diagnostics from the list by double-clicking the mouse.
- Open the settings window.
- Asterisk She has no specific purpose. The user can interpret it at his discretion. For example, he may mark the most interesting warnings for further careful analysis. Analogy - mark with asterisks of letters in mail program like Thunderbird or Outlook.
- Level The level to which the alert applies. Level 1 - the most suspicious places. Level 3 - most likely a false positive or a minor inaccuracy in the code.
- ID . Unique message number. It can be useful when working with a large list. For example, you can go to the message with a specific number (see “Navigate to ID ...” in the context menu ).
- Code . The message code. If you click on it with a mouse, the page with the description of the warning will open.
- Message . The text of the diagnostic message.
- Project . Project name (you can disable this column using the context menu).
- File . File name.
- Line . Line number Important! Notice that after some lines, a semicolon is constructed. Example: “123 (...)”. By clicking on this number, you will receive a list of all the lines of code that relate to this message. At the same time, it is possible to go to each of the lines in the list.
- Mark "False Alarm" . Mark that the warning is false. Note that false warnings are present in the code only if the N 5 button is pressed (see Figure 5).
Context menu
So, by double-clicking on the message you move to the desired text fragment. By pressing the right mouse button opens the context menu.
The menu is quite simple, and you should not overload the article with a description of each of the items. If something is not clear, you can peep in the documentation:
However, I want to dwell on one very useful feature.
Remember that in the settings you can add folders / files to exclude (see Figure 2). So, adding something is much easier than it seems!
Pay attention to the item “Don't check files and hide all messages from ...”. Clicking on it will drop a list of paths that can be added to the exception (see Figure 6).
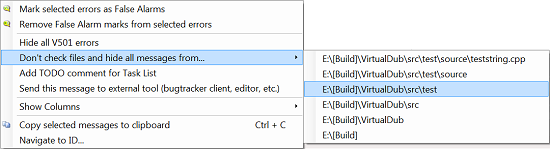
Figure 6. Excluding files from scanning. Click on the picture to enlarge it.
You can select a separate file or one of the directories. The figure shows that the folder “E: \ [Build] \ VirualDub \ src \ test” is selected. This means that all files in this folder and all subfolders will be excluded from the analysis. Moreover, all messages related to these files will immediately disappear from the list. Very comfortably. You do not need to restart the analysis to remove all messages related to the tests (the “test” folder).
Incremental analysis mode
An introduction to PVS-Studio will be incomplete if you don’t talk about one of the most important features - incremental code analysis.
The earlier the error is found, the cheaper its elimination. It is ideal to immediately emphasize errors in the edited text of the program. However, it is technically difficult and resource intensive. Therefore, PVS-Studio runs in the background at the moment when the corrected code is successfully compiled. Thus, errors in just changed code are looked for. The fact that an analysis is taking place can be judged by the system tray icon.
When an error is found, a pop-up warning window appears (see Figure 7).
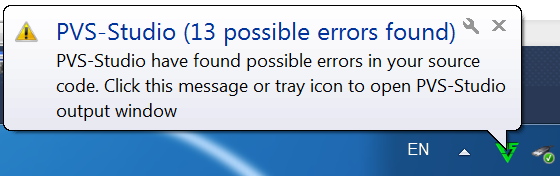
Figure 7. A pop-up message stating that suspicious places were found in the edited files.
If you click on this pop-up message, the PVS-Studio window will open (see Figure 2), and you can examine the suspicious code fragments.
In fact, than to describe this mode, it is easier to try to work with it. You write the code as before. And if necessary, the analyzer will disturb you. Try it!
We ourselves constantly use this mode. Yes, we also sometimes make mistakes when coding. And the ability to immediately fix them significantly reduces the time to detect a defect and try to understand why the program does not behave as planned. It’s a shame to spend 15-20 minutes debugging to find a typo in the index. Here is one of the latest cases when PVS-Studio found an error in PVS-Studio immediately after it appeared in the code:
if (in[0] == '\\' && in[1] == '.' && in[1] == '\\') { in += 2; continue; } But this, of course, flowers. PVS-Studio analyzer can sometimes be much more useful. Here is one of the reviews about our analyzer: " An example of using a static analyzer ." The text makes you think.
I summarize. Incremental analysis is something you should definitely try. You will love it as soon as you find a couple of blunders in the fresh code.
PVS-Studio features
We will be short. It is impossible to concisely describe all the diagnostics that are available in PVS-Studio. A complete list of diagnostics and their detailed description can be found in the documentation: Description of the errors to be diagnosed . We confine ourselves to a table in which diagnostics are grouped by type. Some diagnostics are included in more than one group. The point is that the division is very conditional. For example, a typo can lead to the use of uninitialized memory. Some errors, on the contrary, did not find a place in the table, they are too specific. However, the table as a whole gives an idea of the functionality of the static code analyzer (see Figure 8).
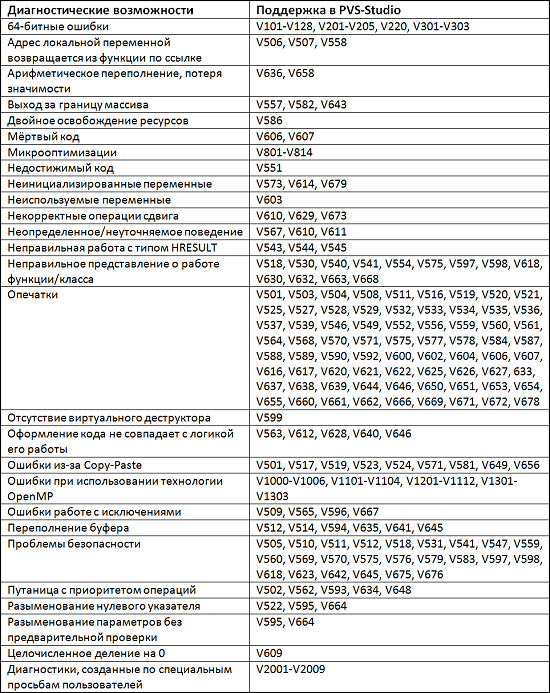
Figure 8. PVS-Studio features. Click on the picture to enlarge it.
As you can see, the analyzer maximally manifests itself in such areas as the search for errors caused by typos, Copy-Paste. Well diagnoses problems that are related to code security.
How all this works in practice, you can find out by looking into the database of errors . We collect in this database all the errors that are found by checking various Open-Source projects.
Conclusion
Of course, here we told not everything about the instrument. If you tell everything, the article will turn into documentation. The goal was to show how easy it is to work with a tool within the Visual Studio environment. About other environments and modes of operation can be read in the documentation and other articles located on our website . There, by the way, a lot of interesting things for programmers. Come to wander.
I wish you a reckless code and I hope that you will enjoy PVS-Studio. If you have any questions, we will always help and advise. Write to us .
Additional resources:
- Code review .
- Static code analysis .
- Static code analysis tools .
- Myths about static analysis. The second myth - professional developers do not make stupid mistakes .
- Download PVS-Studio and try it out.
- Why do I find few bugs? Leo Tolstoy and static code analysis .
- Discuss the price of the PVS-Studio analyzer for your team and how to acquire it: buy PVS-Studio .
- Answers to questions that are often asked after reading our articles.
UPDATE
Updated article version: PVS-Studio for Visual C ++ .
Source: https://habr.com/ru/post/199346/
All Articles