Breaking the iOS application! Part 2
In the first part, we examined some of the issues of data storage and transmission security . Now go to the protection of executable code . We will modify the functionality of the iOS application at runtime and do reverse-engineering. And again, remember! Our goal is not to become an ugly hacker, but to protect your application and users from malicious actions. To do this, you need to understand what a hacker can do.
To successfully complete this lesson, you must understand what an assembler is. The author advises to go through the tutorial on ARM (in English).
')
In fact, in order to understand the meaning of the lesson, the level of necessary knowledge is a few minutes to google along the way. Well, you are closer to the end of the article, decide whether you need to learn assembler or not. :) - Approx. per.
We will need:
I hope you learn a lot about these tools!
In the previous series, we modified the .plist files to change the balance in your account. Now let's see how to manipulate variables and methods right during the execution of the application (what is called runtime). For this we use the debagger LLDB.
Open the folder of the main bundle (
We take the original position: the simulator is running, the application is installed, but not running.
In the terminal type:
Debagger launched, great. On the next line we see an invitation from him:
Recruit team for debugger:
I will not write characters
The
So, the debugger is waiting. Let us go to the iOS Simulator and perform the traditional (according to the last part of the lesson) deleting the application from multitasking, and then restarting (run it from the simulator, not from the IDE) - we will call it “restart”.
If everything is done correctly, LLDB will beginto walk along merrily with the process in the simulator. The debugger will connect to the process, suspend its execution and say:
And an invitation to enter a new command:
Let's add a breakpoint before displaying each ViewController. This is the place where a lot of interesting things usually happen. Often, a significant part of the application logic is defined there. For example, let's add a breakpoint on every call to the
Run in terminal:
Method names are case-sensitive, so the
By this we set breakpoints on all methods called
So LLDB informs us that it has found 15 suitable places for breakpoints:
Fine. Let's see where he put them. Enter the command:
(This is short for
Well, here they are:
In fact, it is clear that we need to leave only one breakpoint:
Let's return to the launch of our application! Enter the command:
which in the full version looks like
“And now tep-e-er ... it's time for us to have some fun: otherwise I do not play!”

We stopped the process on the frame of the
Yes, singletons. If you carefully studied this point in the first part , you might have noticed an “interesting” class called
Type in our
We called the method! The debugger will display the result of the execution:
If we saw the answer
And LLDB repeats the previous command by pressing Enter. Therefore, press Enter several times to robMikhalkov a little more:
Buyingfree content has never been easier! Now enter the command a couple of times.
... so that all the breakpoints we’ve completed are over and evaluate the result in the simulator:
Not bad, huh? Well, let's see what we can do about it.
To pause the execution of the application and return to the command line again, switch to the terminal and press Ctrl + C there. The LLDB debugger is again ready to execute our commands.
Let's finish the debug session for now: enter the
We return to the side of the developer. Is it possible to outsmart those who want to manipulate your application through a debugger?
Fortunately, there is a way to find out if the debugger is connected to our code! But there is one problem. This check determines whether the debugger is connected at a particular time. A hacker (cracker, cheater, ...) can connect to the application after this check, when the application is no longer aware of the danger. This problem can be solved in at least two ways:
The first option is usually undesirable. Its price is a waste of precious processor timeto heat the device . Let's go the second way.
One elegant solution is to test for debugger activity in
Well, finally, let's work with the code! Open our project (in your favorite IDE or in Xcode) and go to the MoneyManager.m file. This is what we will do: we will add a preprocessor macro that will check in which configuration our application is assembled, and if it is Release, then it will check if the debugger is running. If running, returns
Add 3 lines to the top of the
Now the method should look like this:
Note: this macro is available only in the Release configuration. If you followed us in part one, you should have already switched to release.
Now start our application from the IDE (remember to choose the Release configuration?)
Xcode: Run (⌘R)
AppCode: Debug (Ctrl + D)
Xcode automatically turns on the LLDB debugger when you select the Run command. Result: the balance on the account is not displayed! Indeed, somewhere
And in AppCode, there are two different commands: the Run command does not enable the debugger, and the Debug command connects. Conveniently.
To finally make sure that our protection works, check: can you buy something now?
Stop the application by clicking the Stop button (with a square) in IDE. Also stop debugger LLDB. Switch to the simulator and start the application from there. The application displays the currency, because The debugger is not connected.
As we have said, you can connect the debugger to the process not only at startup, but generally at an arbitrary point in time. Run in terminal:
The output of this command will contain a list of all processes whose name contains the phrase “Meme Collector”:
You can see that the second line corresponds to the application folder in the simulator. Note the number of this process (second column). In my case, this number is 2001.
From the terminal, run LLDB with the
For example, I need to type "lldb -p 2001".
LLDB will start and report a successful connection to the process:
When LLDB is running, try
An attempt to “buy” a currency now returns
And we will try to print the description of the
And what about this description?
What was required to achieve! Our singleton does not return at least some intelligible result, and also does not show an error message during the purchase process. Simple and incomprehensible hacker
We continue the application with the command:
Try to legally replenish your account by clicking on the “Purchase Currency” button. Nothing will come out! After all, LLDB is still connected to the process.

Disable the debugger from the process: press Ctrl + C and then enter the command q . The “Purchase Currency” button is working again.
In addition to checking for the presence of a debugger, a tougher approach can be applied. Theto resist connecting GDB / LLDB to your application possible .
To do this, go back to the IDE and open main.m. Add one header file:
And three lines at the beginning of the
The
Now we will start application from IDE.
Xcode : the application does not seem to start. What's happening? We see for a moment a black screen, which immediately disappears - this application is loaded into memory and begins to run. At the same time, Xcode wants to connect LLDB to it, but iOS does not allow and terminate the debugger process. “Once the debugger is complete,” Xcode thinks, “the application has ended, so I’ll stop its execution.” The last phrase sounds crazy, but it works that way. - Approx. per.
AppCode : after the Run (⌘R) command, the application starts normally, and when the Debug command (Ctrl + D) “drops” like Xcode.
And from the simulator runs correctly. Try connecting the debugger to it now, as discussed above:
The result is predictable:
This is a good tool to stop young children who have been reading Habra from playing with your application. But this will not stop the bearded hackers. They will stop your process when you call the

In general, do not feel too comfortable. Hackers like to use Cycript - a scripting language (reminiscent of JavaScript) - precisely for manipulating ObjC applications at runtime. The debugger protection we did will not protect you from Cycript. Remember where we started the conversation in the previous article:
Before proceeding with the modification of binary files, let's find out how to disassemble it into pieces, and what's what.
I will periodically refer to specific addresses in a binary to illustrate certain concepts. If you do not have a version of the compiler like mine (for example, that comes with a newer Xcode), or you compile the Debug configuration instead of Release, or you made changes to the project yourself - the addresses may be different. Don't let that bother you - just watch the presentation to get an idea.
The format of executable files in OS X and iOS is called Mach-O . As a rule, a binary begins with a header (header) containing all the information about where and what data is in the binary. This information is followed by load commands that will tell you about marking a file by segment. In addition, these commands define special flags: for example, whether binary data is encrypted in the file.
In each segment (segment) there is one or more sections (sections). Two types of sections worth noting:
And Apple has an excellent reference for the Mach-O format in English. - Approx. per.
Now we will explore the
This command will print the header of the executable binary file “Meme Collector”. Something like this:
Note: the file has 25 download commands (
(Before this, you can clear the terminal window by pressing ⌘K. It will be more convenient to scroll through. - Note. Trans. )
You will get many, many lines. From these lines (even without preliminary preparation) you can see a lot of interesting things about the order of loading segments and sections into memory. But this study is beyond the scope of this tutorial, let us leave it to the most curious readers for independent study.
And we continue our lesson. Find ( ⌘F ) a section called
Here the section shift
Go to the terminal. Open a new terminal window ( ⌘N ) and from the same folder “Meme Collector.app” execute:
The
Well, what is our address 159942? Class names! (Highlighted in red.) Logically, we searched for the
Directly above this section we see the
Where method names end, class names immediately begin. The
So, we see how load commands allow us to arrange the chaos that is represented by the Mach-O binary file. With this knowledge, we proceed ... tadaaam! to modify the code section.
Are you ready to use serious guns? Finally, we will learn how to modify the application binary file!
Probably, you often hear in your life the phrase: the application is “hacked”. This means that someone modified the application so that it works ... mmm ... otherwise than the developer intended. For example, do not ask to register. Therefore, we (the author and translator) sincerely hope that our work will serve you for good. Only to protect your applications.
Download IDA Demo and some HEX editor, for example, Hex Fiend . IDA is a tool that hackers turn to most often when they study binaries. This is an incredibly powerful disassembler, debugger and decompiler. And the full version is not that expensive.
But if you are not ready to buy the program, which you heard about 15 seconds ago, IDA offers a demo version with limited functionality. The demo version has limited types of assembler files that can be studied in it. And also the ability to modify the code is disabled.
But it has our x86 assembly type. And all the modifications we will do manually in another program - Hex Fiend.
Install and run IDA. We are greeted by Ada Lovelace - the world's first programmer:
Click the Go button . In the terminal, we (yes-yes) are still in the bundle folder (
Do not forget the point at the end. The dot symbol here means "current folder".
Then in the Finder window that opens, right-click> Show package contents :
(OS Mavericks calls bundle a “package” in Russian translation, but this name seems to me uninformative. - Note lane )
Inside the bundle you will find the executable file

Indeed, IDA determined that this binary file is an executable file of the i386 architecture.
Your settings should correspond to those shown above (I think you don’t have to change anything) - and click"Go!"OK The disassembler will parse the file into small pieces and make its mapping - what we did above, but ... how to say ... more professionally. :)
If asked “Objective-C 2.0 structures detected. Do you want to parse them and rename methods? ”- answer Yes. If you ask for something about proximity view, answer No.
When IDA finishes processing a binary file, you will ofcourse be shocked to see the main screen. If the IDA window is not very similar to the one below, then in the left pane find the name of the function
(In my case, it was not enough one space, I had to press Enter once or twice. Well, you quickly figure out what's what. - Note lane. )
And open the project in Xcode or AppCode. In order to shorten the presentation, we’ll look at the code a little bit.
Open upMoneyManager.m and take a look at the method
Learn the algorithm, it's pretty simple. If the variable of the eclamption
If this test was bypassed (“jump over”, in terms of assembler), one could buy anything, then the value
Now we will find the same code in the disassembler. Go back to IDA, click on any function in the Functions panel (just to activate this panel) and then press ctrl + F(or from the menu: Edit> Quick Filter ). An input field will appear to search for our function. We need to find

Aha, found, double click on the name of the method. IDA will show the disassembler window, which perfectly demonstrates the conditional operator and code branching:
Even if you do not know anything fromthe assembler school course , from the comparison with the source code
I will load you a little with the assembler. Let's look at the conditional operator (“jump”), the lowest one in the upper block, from which there are two arrows - red and green. it
To replace the instruction, you need to find it. Double click the operand
Here is the same information, but in a linear form. Find the line number with the command
In my case the address was 0x00018D88. Let me remind you that you can have any other address.
The operand code "
Download (if you have not downloaded yet) Hex Fiend . Install it, for example, by copying to a folder
A window will open with our binary. Beautiful, is not it? Here they are - our friends:

Now type in the terminal:
As we saw earlier, it
Here we see the starting address of the section (
Fine!Time to do arithmetic: you need to recalculate the instruction offset
In order not to distract us too much, I prepared for you a formula:
{absolute position of a command in a binary file} =
{command address} - {starting address of the text section} + {shift of the text section}
In my case:
Team address
Text section start address = 0x2970 (from
Text section shift = decimal 6512 (from
Take the calculator, switch from the menu: View> For programmer ...(do not forget to switch to the desired number system when entering decimal and hexadecimal numbers).
I got:
0x18D88 - 0x2970 + 6512 = 0x17D88
If your calculations were correct, this will be the address of the instruction
Hmm, line numbers for some reason in decimal form. Well, let's recalculate: 0x17D88 = 97672, i.e. from position 97664 you need to count another 8 bytes to the right. 8 bytes = 16 hexadecimal digits = two 4-byte words. You see, Hex Fiend groups a binary "text" by the words: We
skip the first two words, and at the beginning of the third word - here it is - our opcode
Correct
Yes, we really threw out the check of the condition "does the user have money?" And a small bonus: unsigned value
How do we protect ourselves? Remember, I said: "Nothing is safe." This statement works here. Reverse engineering can be very difficult, but you can't stop a burglar if he is serious. Your only hope is to confuse the intruders so much that they will give up and start breaking other applications.
One way is to change the names of important classes and methods through the preprocessor. Open the project in the IDE and find the file “Meme Collector-Prefix.pch” in it. Add a line to it:
This code will replace all occurrences of "
This approach should be applied with great care so as not to break anything. You need to make sure 100% that the selected new name is not found anywhere else in your application. Otherwise, you will confuse yourself; unexplainable things will start happening with the application.
Typically, an executable file has a symbol table that stores the mapping of addresses to the readable names of functions and methods. And now, another way to confuse the code is to delete the symbol table after building the project. This is more suitable for hiding C and C ++ functions, because Objective C messages are processed by a single function
Open MoneyManager.m again and add the following C function to the beginning:
Then compile the application again. Check the existence of this function in the symbol table. From the terminal:
The command
An easy way to remove a symbol table from an iOS application is to find two options in the project settings: Deployment Postprocessing and Strip Linked Product, and set them to Yes:
Then you need to “clean” the project (Xcode: Product> Clean or in AppCode: Run> Clean ) and re-compile. Then go to the terminal and run the same command:
Excellent!We have successfully deleted the character that referred to
We made sure that the attacker can:
When creating an application, it is important to remember these things. Think about how much effort you are willing to make to make the application more secure. What is safety? It is always a balance between your resources (time), the level of problems for your users, and the likelihood of hacking.
The security of an iOS application is a serious topic. You can still learn a lot. So far we have barely scratched the surface. The whole range of features of the debugger and other analysis tools is much deeper. If you are interested in this topic, I advise you to think about jailbreaking the test device. The file system will provide rich research food.
If you have no problems with English, be sure to check out the book Hacking and Securing iOS Applications(author Jonathan Zdziarski). Although it is slightly outdated (you’ll have to google it for changes in the encryption mechanism of Apple applications), but the author of the article is one of the favorite books on iOS and security.
A couple of books:
Hacking: of The Art of Exploitation, 2nd Edition by of Jon Erickson
the Mac OS the X and iOS Internals: the To the Core Apple's's by of Jonathan Levin
Forums:
http://www.woodmann.com
http://www.reddit.com/r/ReverseEngineering
Article on code injection:
http://blog.timac.org/?p=761 The
author can be written in the comments , and on the translation write on mail dev
To successfully complete this lesson, you must understand what an assembler is. The author advises to go through the tutorial on ARM (in English).
')
In fact, in order to understand the meaning of the lesson, the level of necessary knowledge is a few minutes to google along the way. Well, you are closer to the end of the article, decide whether you need to learn assembler or not. :) - Approx. per.
Let's start
We will need:
- Test project Meme Collector from the previous part.
- Utility class-dump-z .
- Open source HEX editor for OS X: Hex Fiend .
- The demo version of IDA is a well-known multiprocessor disassembler and debugger. The demo version has limitations that are not essential for this lesson.
I hope you learn a lot about these tools!
Manipulation of the runtime environment (runtime)
In the previous series, we modified the .plist files to change the balance in your account. Now let's see how to manipulate variables and methods right during the execution of the application (what is called runtime). For this we use the debagger LLDB.
In the original article, all examples are with GDB, but
after upgrading Xcode to 5.0.1 (the current version at the time of translation), GDB requires dancing with a tambourine. Therefore, in order not to burden the tutorial, I remade it according to the table of the command correspondence between LLDB and GDB . - Approx. per.
Open the folder of the main bundle (
Meme Collector.app ) installed on the iOS simulator in the terminal. If you are at a loss to make it, glance in the first part .We take the original position: the simulator is running, the application is installed, but not running.
In the terminal type:
lldb Debagger launched, great. On the next line we see an invitation from him:
(lldb)Recruit team for debugger:
I will not write characters
(lldb) at the beginning of the line so that you do not confuse when copying attach --name "Meme Collector" --waitfor The
attach command is used to connect to a specific process. Here we ask LLDB to wait for the launch of the new process called " Meme Collector " and connect to it.So, the debugger is waiting. Let us go to the iOS Simulator and perform the traditional (according to the last part of the lesson) deleting the application from multitasking, and then restarting (run it from the simulator, not from the IDE) - we will call it “restart”.
If everything is done correctly, LLDB will begin
Process 1427 stopped Executable module set to "/Users/dmitriy/Library/Application Support/iPhone Simulator/7.0.3/Applications/9A72F266-8851-4A25-84E4-9CF8EFF95CD4/Meme Collector.app/Meme Collector". Architecture set to: i486-apple-macosx. And an invitation to enter a new command:
(lldb)Let's add a breakpoint before displaying each ViewController. This is the place where a lot of interesting things usually happen. Often, a significant part of the application logic is defined there. For example, let's add a breakpoint on every call to the
viewDidLoad method, since in iOS, the UIViewController subclasses of iOS almost always override viewDidLoad .Run in terminal:
b viewDidLoad Method names are case-sensitive, so the
viewdidload option viewdidload not work.By this we set breakpoints on all methods called
viewDidLoad (including C ++ and Objective C methods). If desired, for specific ObjC selectors you can enter their names, for example, -[UIViewController viewDidLoad] , but note that this option will not work for the heirs of the UIViewController class.So LLDB informs us that it has found 15 suitable places for breakpoints:
Breakpoint 1: 15 locations. Fine. Let's see where he put them. Enter the command:
br l (This is short for
breakpoint list - if you want, you can write the full version of the command.)Well, here they are:
Current breakpoints: 1: name = 'viewDidLoad', locations = 15, resolved = 15 1.1: where = Meme Collector`-[ViewController viewDidLoad] + 18 at ViewController.m:27, address = 0x0001f482, resolved, hit count = 0 1.2: where = UIKit`-[UIViewController viewDidLoad], address = 0x005d3db5, resolved, hit count = 0 1.3: where = UIKit`-[_UIModalItemsPresentingViewController viewDidLoad], address = 0x0065ab4b, resolved, hit count = 0 1.4: where = UIKit`-[UIKeyboardCandidateGridCollectionViewController viewDidLoad], address = 0x00680729, resolved, hit count = 0 1.5: where = UIKit`-[UIActivityGroupViewController viewDidLoad], address = 0x008d2b6b, resolved, hit count = 0 1.6: where = UIKit`-[UIPrintPanelTableViewController viewDidLoad], address = 0x009be80f, resolved, hit count = 0 1.7: where = UIKit`-[UIPrintStatusViewController viewDidLoad], address = 0x009c8828, resolved, hit count = 0 1.8: where = UIKit`-[UIPrintRangeViewController viewDidLoad], address = 0x009d29ae, resolved, hit count = 0 1.9: where = UIKit`-[_UILongDefinitionViewController viewDidLoad], address = 0x00a10cf4, resolved, hit count = 0 1.10: where = UIKit`-[_UINoDefinitionViewController viewDidLoad], address = 0x00a1249d, resolved, hit count = 0 1.11: where = UIKit`-[UIReferenceLibraryViewController viewDidLoad], address = 0x00a13bd4, resolved, hit count = 0 1.12: where = UIKit`-[_UIFallbackPresentationViewController viewDidLoad], address = 0x00a77877, resolved, hit count = 0 1.13: where = UIKit`-[_UIViewServiceViewControllerOperator viewDidLoad], address = 0x00aba23b, resolved, hit count = 0 1.14: where = UIKit`-[UIActivityViewController viewDidLoad], address = 0x00b4f296, resolved, hit count = 0 1.15: where = UIKit`-[_UITextEditingController viewDidLoad], address = 0x00b9a6ec, resolved, hit count = 0 In fact, it is clear that we need to leave only one breakpoint:
-[ViewController viewDidLoad] , since the rest belong to the Apple Private API. But we are interested, so leave them on.Let's return to the launch of our application! Enter the command:
c which in the full version looks like
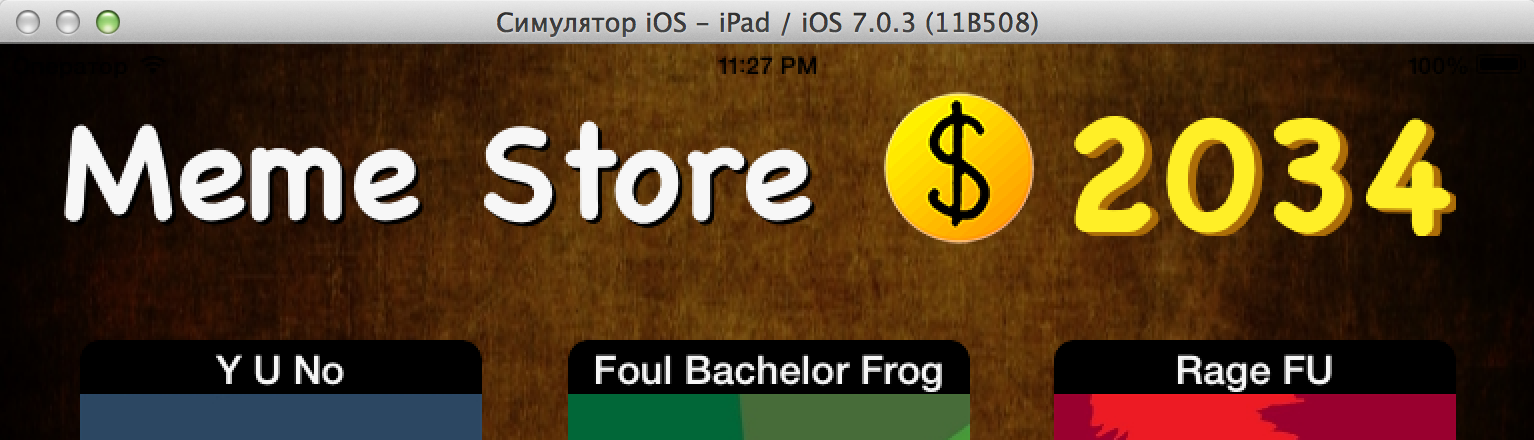
continue . The application will continue to execute code until the first call to viewDidLoad : Process 1427 resuming Process 1427 stopped * thread #1: tid = 0x83c4, 0x0001f482 Meme Collector`-[ViewController viewDidLoad](self=0x08f7c620, _cmd=0x00c50587) + 18 at ViewController.m:27, queue = 'com.apple.main-thread, stop reason = breakpoint 1.1 frame #0: 0x0001f482 Meme Collector`-[ViewController viewDidLoad](self=0x08f7c620, _cmd=0x00c50587) + 18 at ViewController.m:27 24 25 - (void)viewDidLoad 26 { -> 27 [super viewDidLoad]; 28 self.memeDescriptionTextView.clipsToBounds = YES; 29 self.memeDescriptionTextView.layer.cornerRadius = 20.0f; 30 [self.moneyLabel sizeToFit]; “And now tep-e-er ... it's time for us to have some fun: otherwise I do not play!”
We stopped the process on the frame of the
ViewController class (ViewController.m file). This means that we have access to its instance variables and methods. Cool? And further! The code section is already loaded into memory. Consequently, we have access to all other classes, including - attention! - singltony.Yes, singletons. If you carefully studied this point in the first part , you might have noticed an “interesting” class called
MoneyManager . He has a method of purchaseCurrency , which one wants to test, eh? :)Type in our
(lldb) terminal: call [[MoneyManager sharedManager] purchaseCurrency] We called the method! The debugger will display the result of the execution:
(BOOL) $0 = YES If we saw the answer
YES , it means that we have successfully “acquired” virtual currency. (The author blurted out here, this is insider information. We, hackers, should not know it. - Appro. Trans. )And LLDB repeats the previous command by pressing Enter. Therefore, press Enter several times to rob
(lldb) call [[MoneyManager sharedManager] purchaseCurrency] (BOOL) $0 = YES (lldb) (BOOL) $1 = YES (lldb) (BOOL) $2 = YES (lldb) (BOOL) $3 = YES (lldb) (BOOL) $4 = YES (lldb) (BOOL) $5 = YES (lldb) (BOOL) $6 = YES (lldb) (BOOL) $7 = YES (lldb) Buying
c ... so that all the breakpoints we’ve completed are over and evaluate the result in the simulator:
Not bad, huh? Well, let's see what we can do about it.
To pause the execution of the application and return to the command line again, switch to the terminal and press Ctrl + C there. The LLDB debugger is again ready to execute our commands.
Let's finish the debug session for now: enter the
q command and then confirm y : (lldb) q Quitting LLDB will detach from one or more processes. Do you really want to proceed: [Y/n] y We return to the side of the developer. Is it possible to outsmart those who want to manipulate your application through a debugger?
Protection against runtime manipulations
Fortunately, there is a way to find out if the debugger is connected to our code! But there is one problem. This check determines whether the debugger is connected at a particular time. A hacker (cracker, cheater, ...) can connect to the application after this check, when the application is no longer aware of the danger. This problem can be solved in at least two ways:
- Include a check in the run loop, so the check will be performed continuously.
- Put the check in the most critical parts of the code where we are most concerned about security.
The first option is usually undesirable. Its price is a waste of precious processor time
One elegant solution is to test for debugger activity in
MoneyManager Singleton. For example: if we determine that debugging is in progress, then return nil instead of a static instance of the class.Advanced mode
In Objective C, you can do it easily, because methods in Objective C are essentially not methods, but messages . This means that sending a message to an empty object is absolutely safe - it does nothing, i.e. the code does not fall.
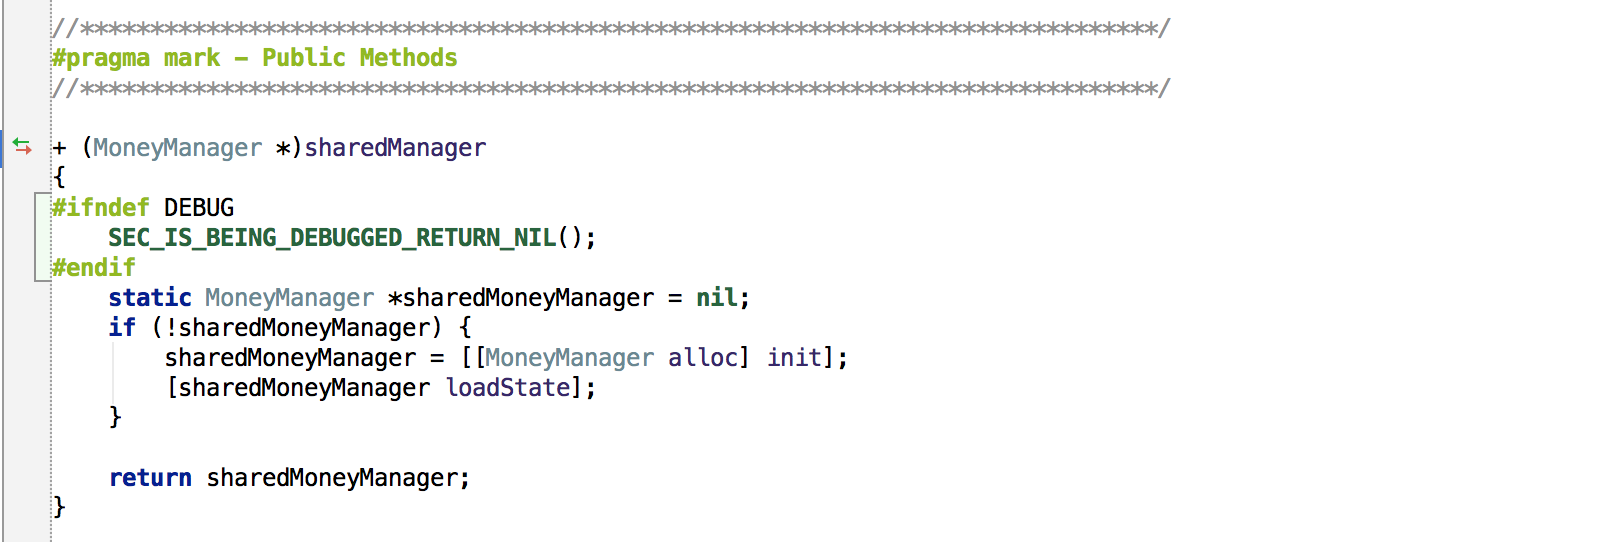
Well, finally, let's work with the code! Open our project (in your favorite IDE or in Xcode) and go to the MoneyManager.m file. This is what we will do: we will add a preprocessor macro that will check in which configuration our application is assembled, and if it is Release, then it will check if the debugger is running. If running, returns
nil . Otherwise, everything is done as usual.Add 3 lines to the top of the
sharedManager class's MoneyManager : #ifndef DEBUG SEC_IS_BEING_DEBUGGED_RETURN_NIL(); #endif Now the method should look like this:
SEC_IS_BEING_DEBUGGED_RETURN_NIL() is a call to the standard preprocessor macro, which returns nil if a debugger is connected to the application.Note: this macro is available only in the Release configuration. If you followed us in part one, you should have already switched to release.
(just to remind you)
Xcode: Product> Scheme> Edit scheme ... ( ⌘ < ) - select Run ... on the left, Info> Build Configuration: Release tab on the right.
AppCode: Run> Edit configurations ... > Configuration: Release.
AppCode: Run> Edit configurations ... > Configuration: Release.
Advanced mode
Someone might say that it is better to write an ObjC method or a C function instead of a preprocessor macro. But! There is a very specific reason for using a macro. Since we have already learned that anyone can spy on the names of all the methods, and also change their behavior (looking ahead: this is what we will do next) - knowing this, we want to hide our test (for example, here, inside the singleton method). In general, it will be much more difficult for hackers to find and patch the security check, in the case of a macro, you have to tinker with an assembler.
Now start our application from the IDE (remember to choose the Release configuration?)
Xcode: Run (⌘R)
AppCode: Debug (Ctrl + D)
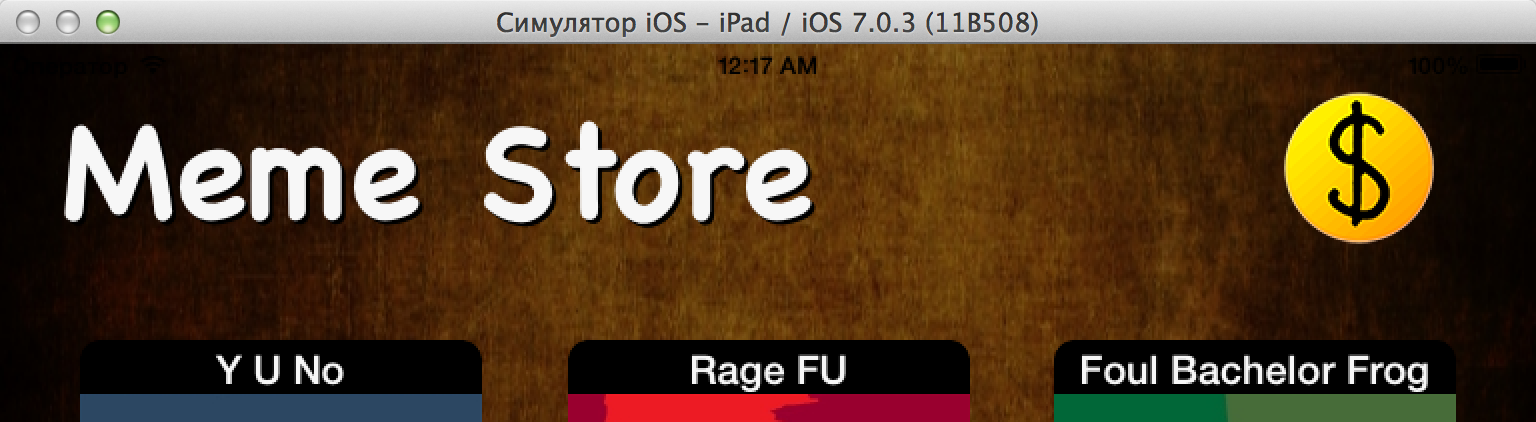
Xcode automatically turns on the LLDB debugger when you select the Run command. Result: the balance on the account is not displayed! Indeed, somewhere
nil :And in AppCode, there are two different commands: the Run command does not enable the debugger, and the Debug command connects. Conveniently.
To finally make sure that our protection works, check: can you buy something now?
MoneyManager not available - so you can not.Stop the application by clicking the Stop button (with a square) in IDE. Also stop debugger LLDB. Switch to the simulator and start the application from there. The application displays the currency, because The debugger is not connected.
As we have said, you can connect the debugger to the process not only at startup, but generally at an arbitrary point in time. Run in terminal:
ps aux | grep "Meme Collector" The output of this command will contain a list of all processes whose name contains the phrase “Meme Collector”:
dmitriy 2008 0,0 0,0 2432784 636 s001 S+ 1:05 0:00.00 grep Meme Collector dmitriy 2001 0,0 0,4 857416 32240 ?? S 1:04 0:00.65 /Users/dmitriy/Library/Application Support/iPhone Simulator/7.0.3/Applications/9A72F266-8851-4A25-84E4-9CF8EFF95CD4/Meme Collector.app/Meme Collector You can see that the second line corresponds to the application folder in the simulator. Note the number of this process (second column). In my case, this number is 2001.
From the terminal, run LLDB with the
-p key to connect to the process by the number: lldb -p { } For example, I need to type "lldb -p 2001".
LLDB will start and report a successful connection to the process:
Attaching to process with: process attach -p 2001 Process 2001 stopped Executable module set to "/Users/dmitriy/Library/Application Support/iPhone Simulator/7.0.3/Applications/9A72F266-8851-4A25-84E4-9CF8EFF95CD4/Meme Collector.app/Meme Collector". Architecture set to: i486-apple-macosx. When LLDB is running, try
MoneyManager singleton: call [[MoneyManager sharedManager] purchaseCurrency] An attempt to “buy” a currency now returns
NO , that is, does not work.And we will try to print the description of the
sharedManager object. Type the command: po [MoneyManager sharedManager] And what about this description?
nil What was required to achieve! Our singleton does not return at least some intelligible result, and also does not show an error message during the purchase process. Simple and incomprehensible hacker
nil .We continue the application with the command:
c Try to legally replenish your account by clicking on the “Purchase Currency” button. Nothing will come out! After all, LLDB is still connected to the process.
Disable the debugger from the process: press Ctrl + C and then enter the command q . The “Purchase Currency” button is working again.
In addition to checking for the presence of a debugger, a tougher approach can be applied. The
ptrace function helps ptrace To do this, go back to the IDE and open main.m. Add one header file:
#include <sys/ptrace.h> And three lines at the beginning of the
main function: #ifndef DEBUG ptrace(PT_DENY_ATTACH, 0, 0, 0); #endif The
ptrace function is commonly used in debuggers to connect to a process, as they do — as we have seen — GDB and LLDB. We added a call to ptrace , which with the special parameter PT_DENY_ATTACH asks the operating system to prevent other processes (that is, debuggers) from connecting to our application.Now we will start application from IDE.
Xcode : the application does not seem to start. What's happening? We see for a moment a black screen, which immediately disappears - this application is loaded into memory and begins to run. At the same time, Xcode wants to connect LLDB to it, but iOS does not allow and terminate the debugger process. “Once the debugger is complete,” Xcode thinks, “the application has ended, so I’ll stop its execution.” The last phrase sounds crazy, but it works that way. - Approx. per.
AppCode : after the Run (⌘R) command, the application starts normally, and when the Debug command (Ctrl + D) “drops” like Xcode.
And from the simulator runs correctly. Try connecting the debugger to it now, as discussed above:
lldb -p { Meme Collector} The result is predictable:
Attaching to process with: process attach -p 3435 error: attach failed: process did not stop (no such process or permission problem?) This is a good tool to stop young children who have been reading Habra from playing with your application. But this will not stop the bearded hackers. They will stop your process when you call the
ptrace function and modify it before continuing.In general, do not feel too comfortable. Hackers like to use Cycript - a scripting language (reminiscent of JavaScript) - precisely for manipulating ObjC applications at runtime. The debugger protection we did will not protect you from Cycript. Remember where we started the conversation in the previous article:
No application is safe!
We prepare the binary
Before proceeding with the modification of binary files, let's find out how to disassemble it into pieces, and what's what.
I will periodically refer to specific addresses in a binary to illustrate certain concepts. If you do not have a version of the compiler like mine (for example, that comes with a newer Xcode), or you compile the Debug configuration instead of Release, or you made changes to the project yourself - the addresses may be different. Don't let that bother you - just watch the presentation to get an idea.
The format of executable files in OS X and iOS is called Mach-O . As a rule, a binary begins with a header (header) containing all the information about where and what data is in the binary. This information is followed by load commands that will tell you about marking a file by segment. In addition, these commands define special flags: for example, whether binary data is encrypted in the file.
In each segment (segment) there is one or more sections (sections). Two types of sections worth noting:
- Text section . Mostly for read-only data. For example, source code, C strings, constants, etc. The peculiarity of read-only data is that if the system runs out of RAM, it can easily free the data from these partitions and then (if necessary) download it from the file again.
- Data section Basically for the data that can be modified from the code. They include BSS sections for static variables, common sections for global variables , etc.
And Apple has an excellent reference for the Mach-O format in English. - Approx. per.
Now we will explore the
Meme Collector binary file to see all this in action. Let's start with the title. In the terminal, while still in the folder of the main bundle "Meme Collector.app", enter: otool -h "Meme Collector" This command will print the header of the executable binary file “Meme Collector”. Something like this:
Meme Collector: Mach header magic cputype cpusubtype caps filetype ncmds sizeofcmds flags 0xfeedface 7 3 0x00 2 25 3372 0x01000085 Advanced mode
0xfeedface (0xFEEDFACE) is a hexadecimal address or ... some phrase in English, don't you think? Wikipedia responds. - Approx. per.
Note: the file has 25 download commands (
cmds ), and they occupy 3372 bytes ( sizeofcmds ). Let's look at these commands: otool -l "Meme Collector" (Before this, you can clear the terminal window by pressing ⌘K. It will be more convenient to scroll through. - Note. Trans. )
You will get many, many lines. From these lines (even without preliminary preparation) you can see a lot of interesting things about the order of loading segments and sections into memory. But this study is beyond the scope of this tutorial, let us leave it to the most curious readers for independent study.
And we continue our lesson. Find ( ⌘F ) a section called
__objc_classname , note the offset is the “position” or “shift” of this section relative to the beginning of the virtual memory occupied by the application.Advanced mode
About
offset . The most curious, perhaps, have already understood the difference between addr and offset , why is this difference everywhere equal to 0x1000 = 4096 bytes? If not, then read more about __PAGEZERO , a very interesting page.Here the section shift
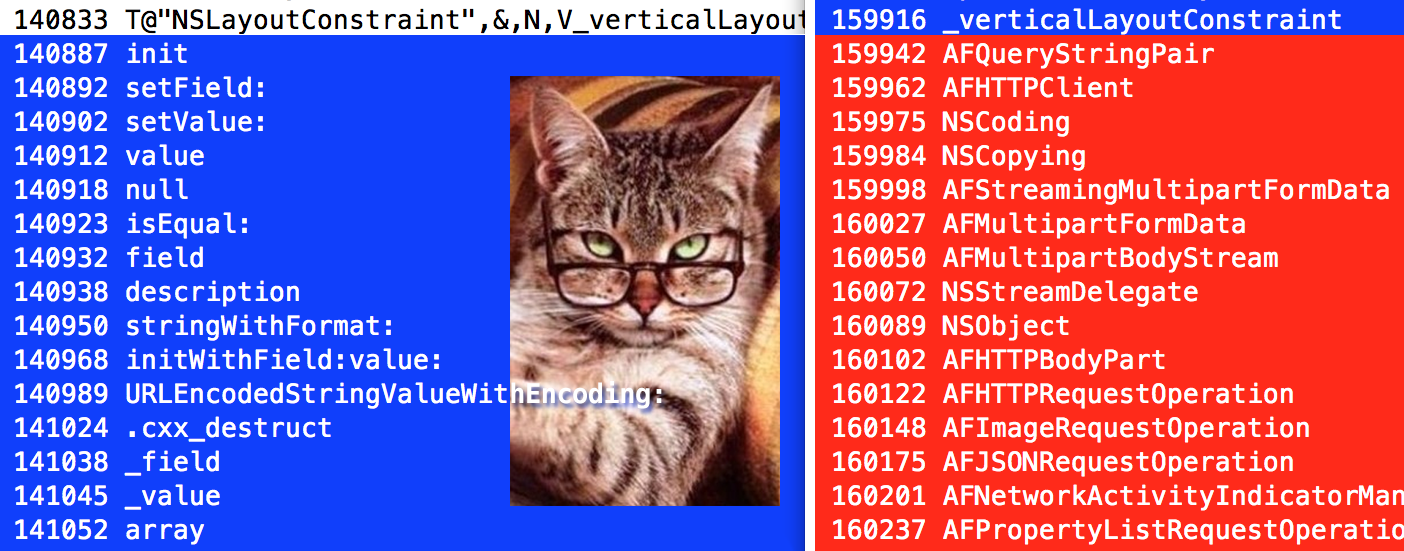
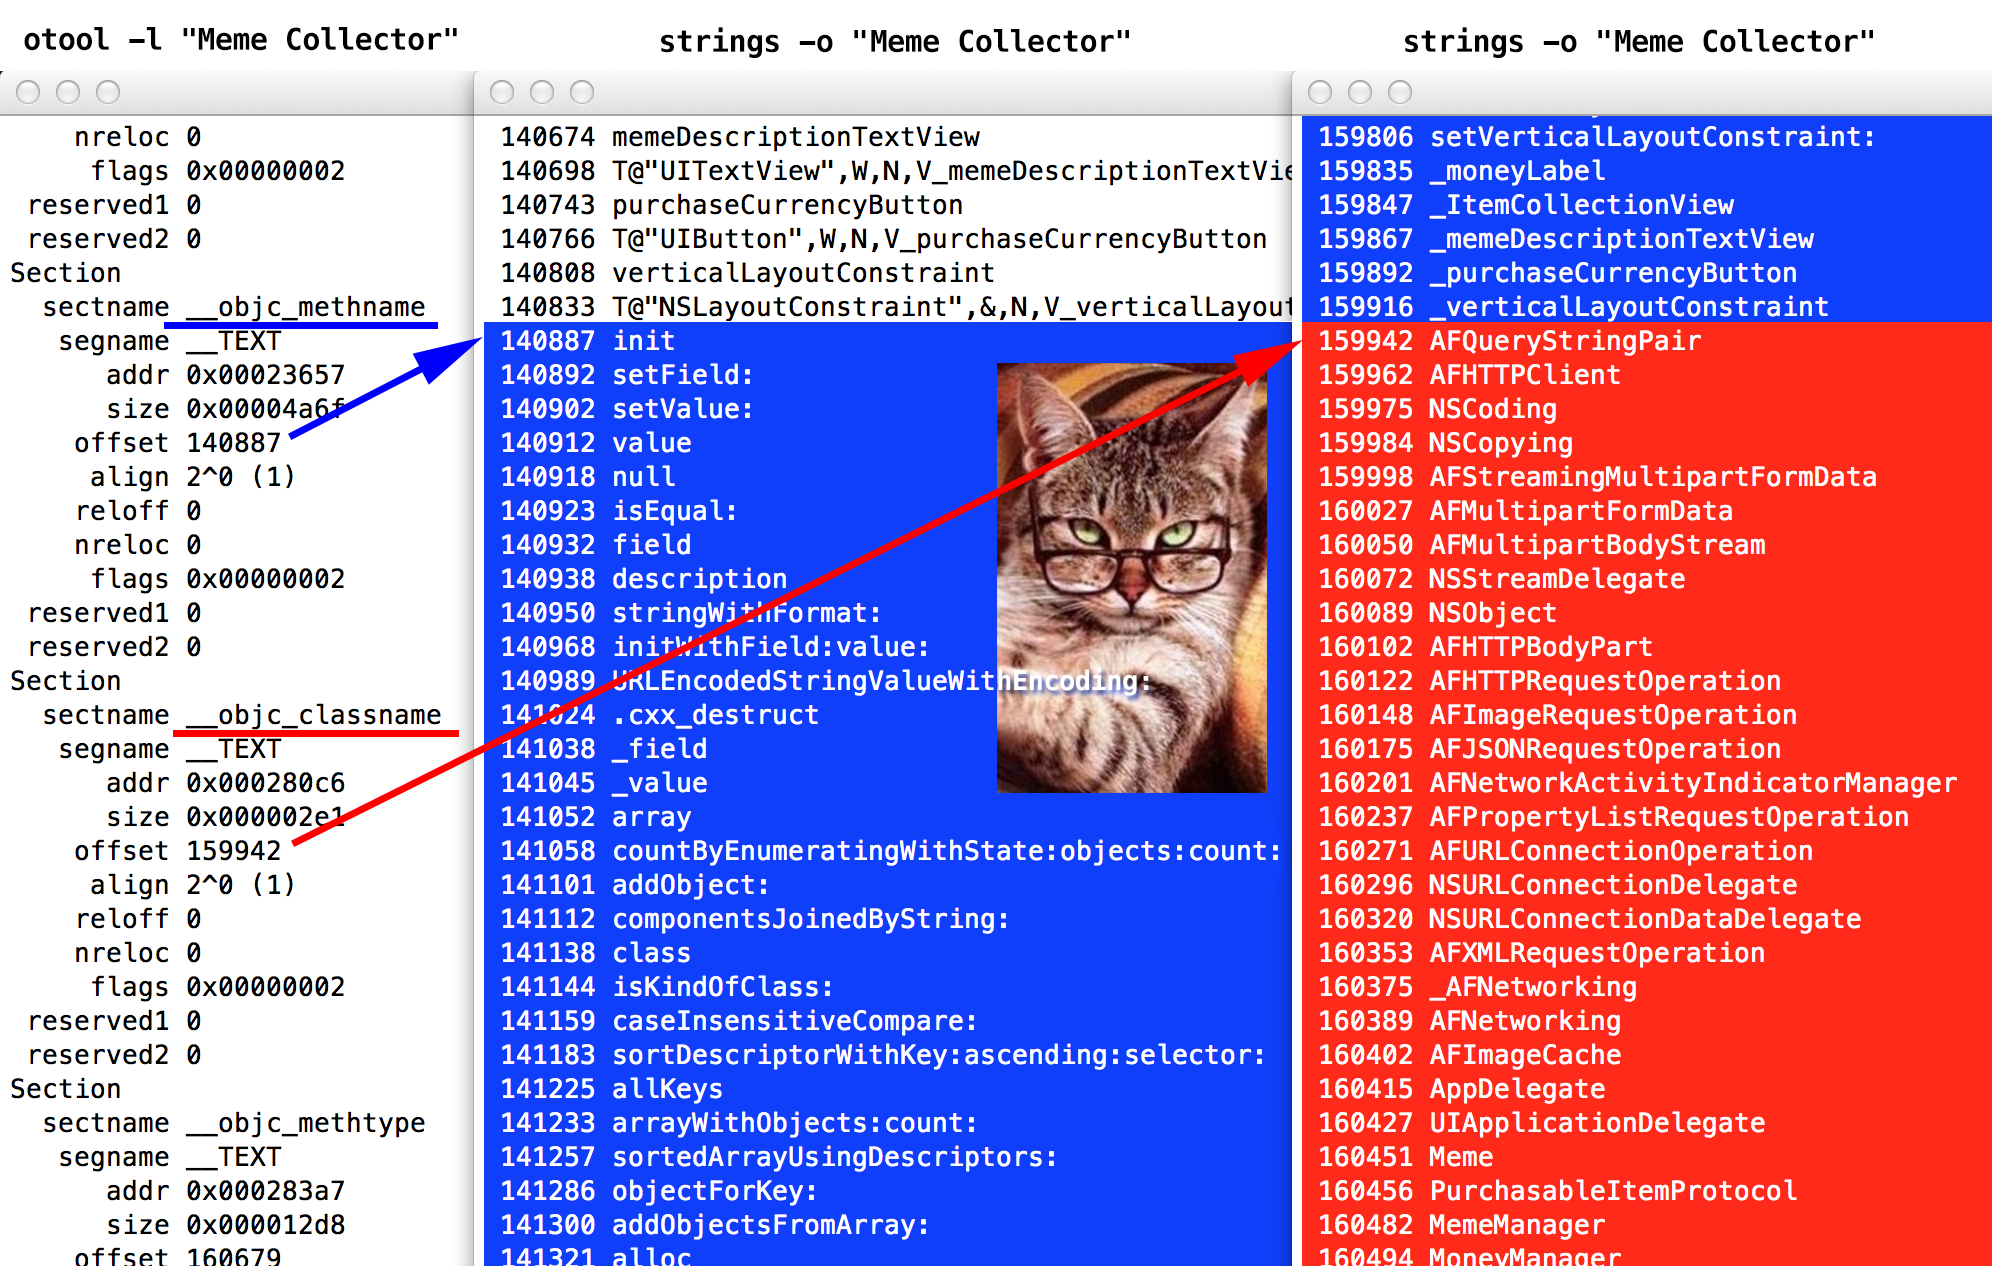
__objc_classname is equal to 159942 bytes (in decimal representation). In the image below, on the left side - underlined red.Go to the terminal. Open a new terminal window ( ⌘N ) and from the same folder “Meme Collector.app” execute:
strings -o "Meme Collector" The
strings command searches for strings in a binary file, and the -o flag writes each line its position relative to the beginning of the file.Well, what is our address 159942? Class names! (Highlighted in red.) Logically, we searched for the
__objc_classname section:Directly above this section we see the
__objc_methname section, it starts from 140887 - here we have method names (highlighted in blue), starting from the init method.Advanced mode
I wonder why the
init method comes first?Where method names end, class names immediately begin. The
__objc_classname section comes right after the __objc_methname section. In the boot commands, they followed one after another - and loaded into memory sequentially.So, we see how load commands allow us to arrange the chaos that is represented by the Mach-O binary file. With this knowledge, we proceed ... tadaaam! to modify the code section.
Heavy artillery: disassembler and reverse engineering
Are you ready to use serious guns? Finally, we will learn how to modify the application binary file!
Probably, you often hear in your life the phrase: the application is “hacked”. This means that someone modified the application so that it works ... mmm ... otherwise than the developer intended. For example, do not ask to register. Therefore, we (the author and translator) sincerely hope that our work will serve you for good. Only to protect your applications.
Download IDA Demo and some HEX editor, for example, Hex Fiend . IDA is a tool that hackers turn to most often when they study binaries. This is an incredibly powerful disassembler, debugger and decompiler. And the full version is not that expensive.
But if you are not ready to buy the program, which you heard about 15 seconds ago, IDA offers a demo version with limited functionality. The demo version has limited types of assembler files that can be studied in it. And also the ability to modify the code is disabled.
But it has our x86 assembly type. And all the modifications we will do manually in another program - Hex Fiend.
Advanced mode
« … x86? ARM?» — . , iOS- ARM-. x86. , , .
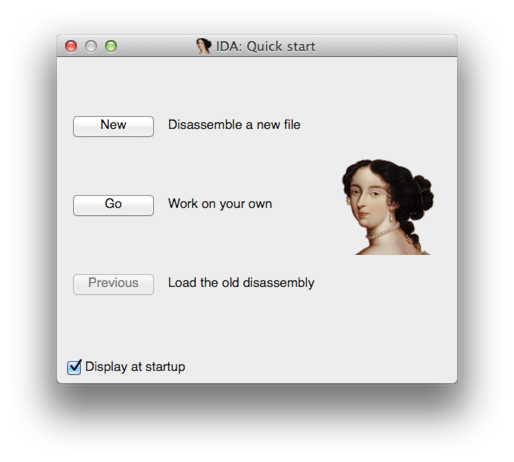
Install and run IDA. We are greeted by Ada Lovelace - the world's first programmer:
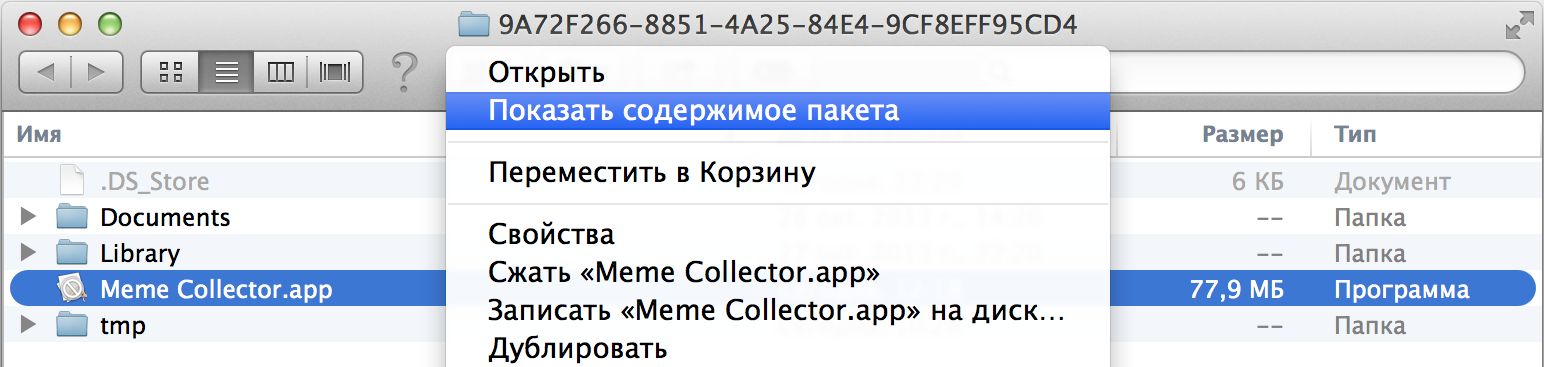
Click the Go button . In the terminal, we (yes-yes) are still in the bundle folder (
Meme Collector.app). Enter the following command to display this folder in the Finder: open -R . Do not forget the point at the end. The dot symbol here means "current folder".
Then in the Finder window that opens, right-click> Show package contents :
(OS Mavericks calls bundle a “package” in Russian translation, but this name seems to me uninformative. - Note lane )
Inside the bundle you will find the executable file
Meme Collector, drag it into the IDA window and get the dialog box:Indeed, IDA determined that this binary file is an executable file of the i386 architecture.
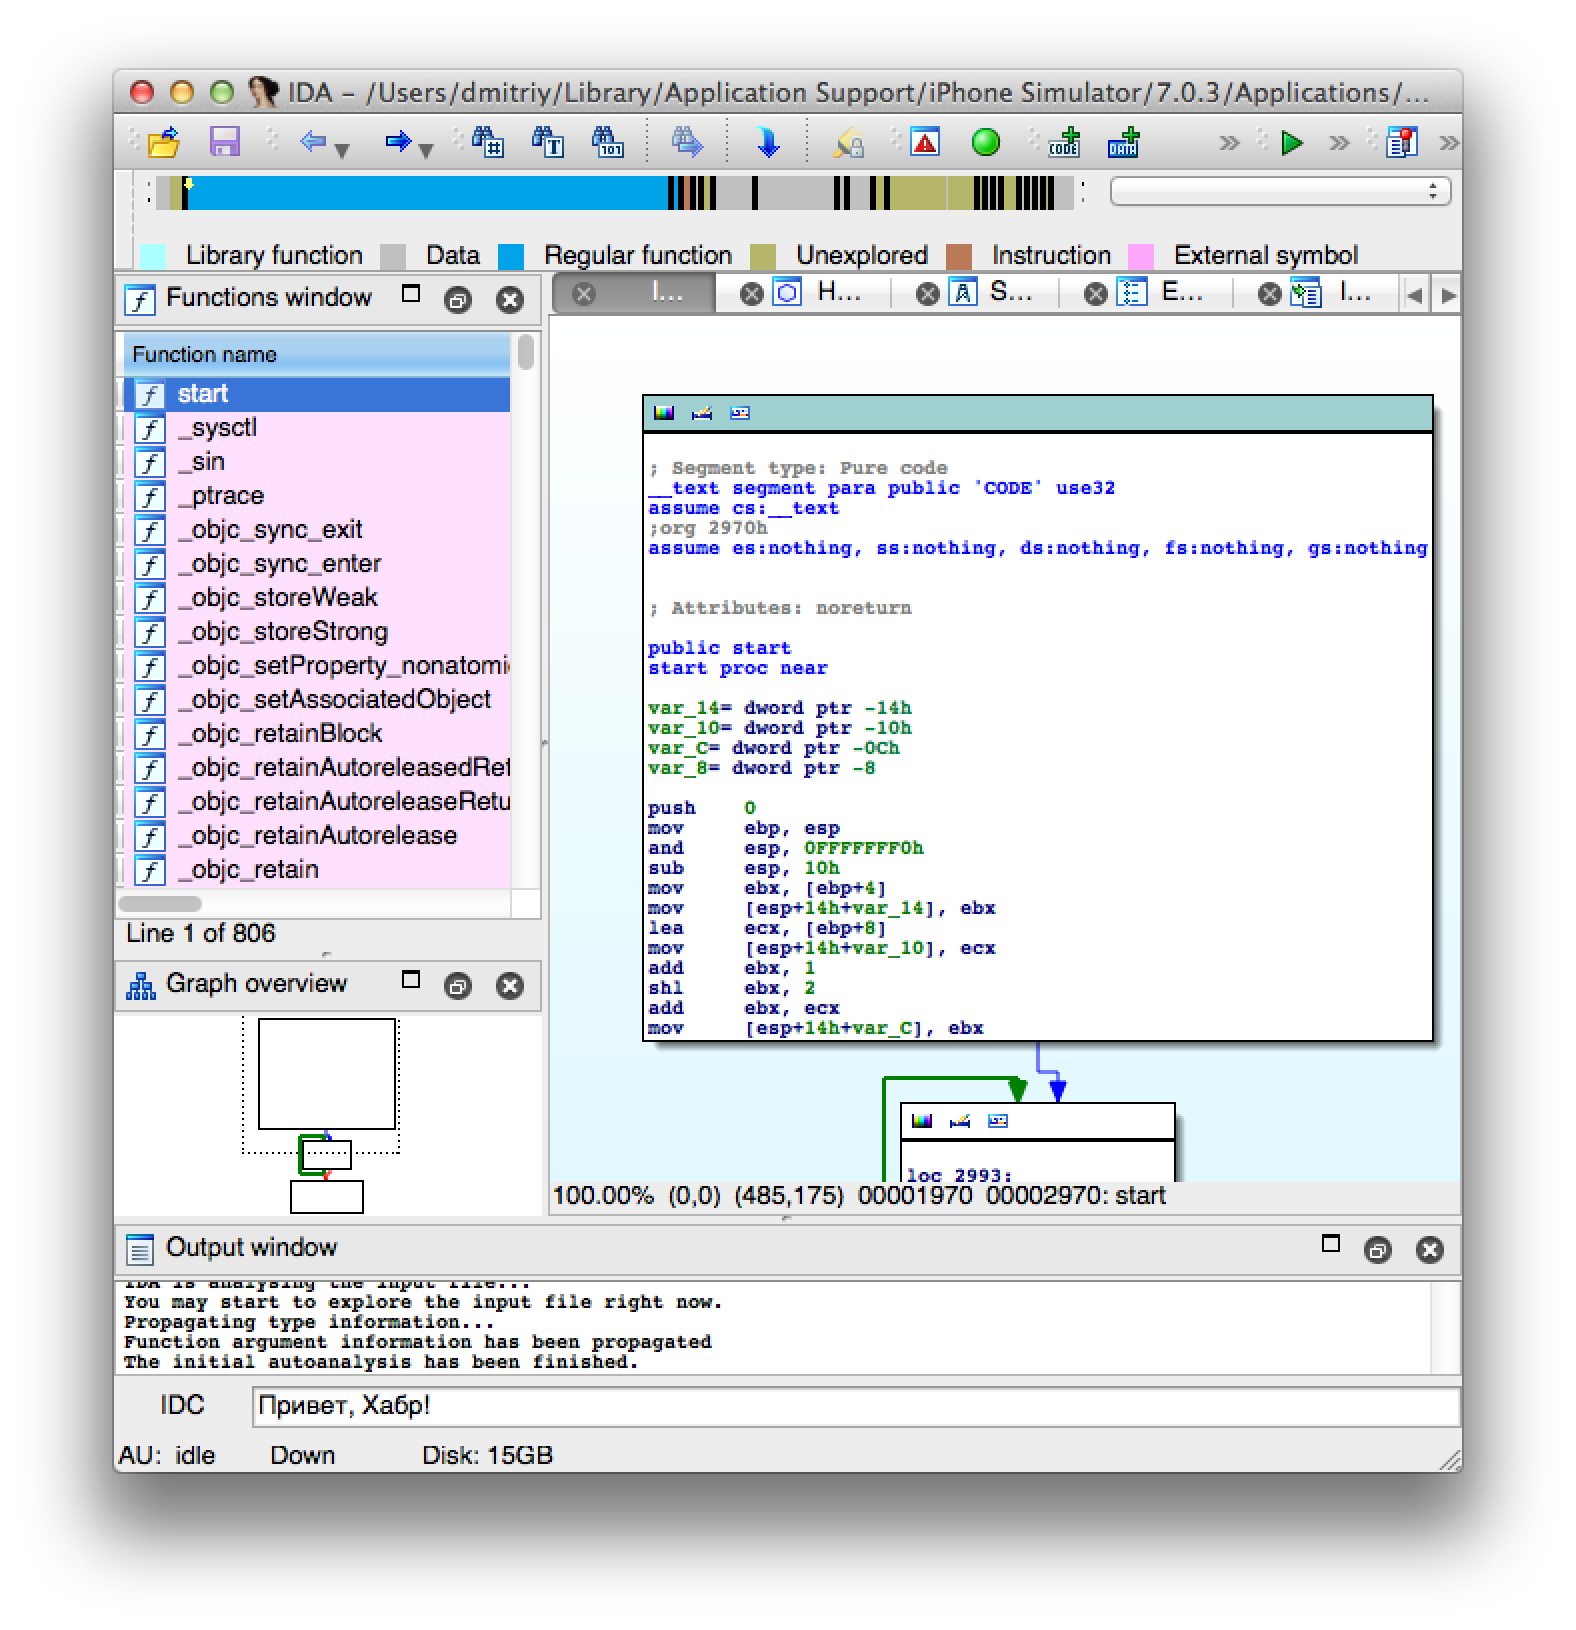
Your settings should correspond to those shown above (I think you don’t have to change anything) - and click
If asked “Objective-C 2.0 structures detected. Do you want to parse them and rename methods? ”- answer Yes. If you ask for something about proximity view, answer No.
When IDA finishes processing a binary file, you will of
start, click on it and then press the space bar until you see such a beautiful block diagram:(In my case, it was not enough one space, I had to press Enter once or twice. Well, you quickly figure out what's what. - Note lane. )
And open the project in Xcode or AppCode. In order to shorten the presentation, we’ll look at the code a little bit.
Open upMoneyManager.m and take a look at the method
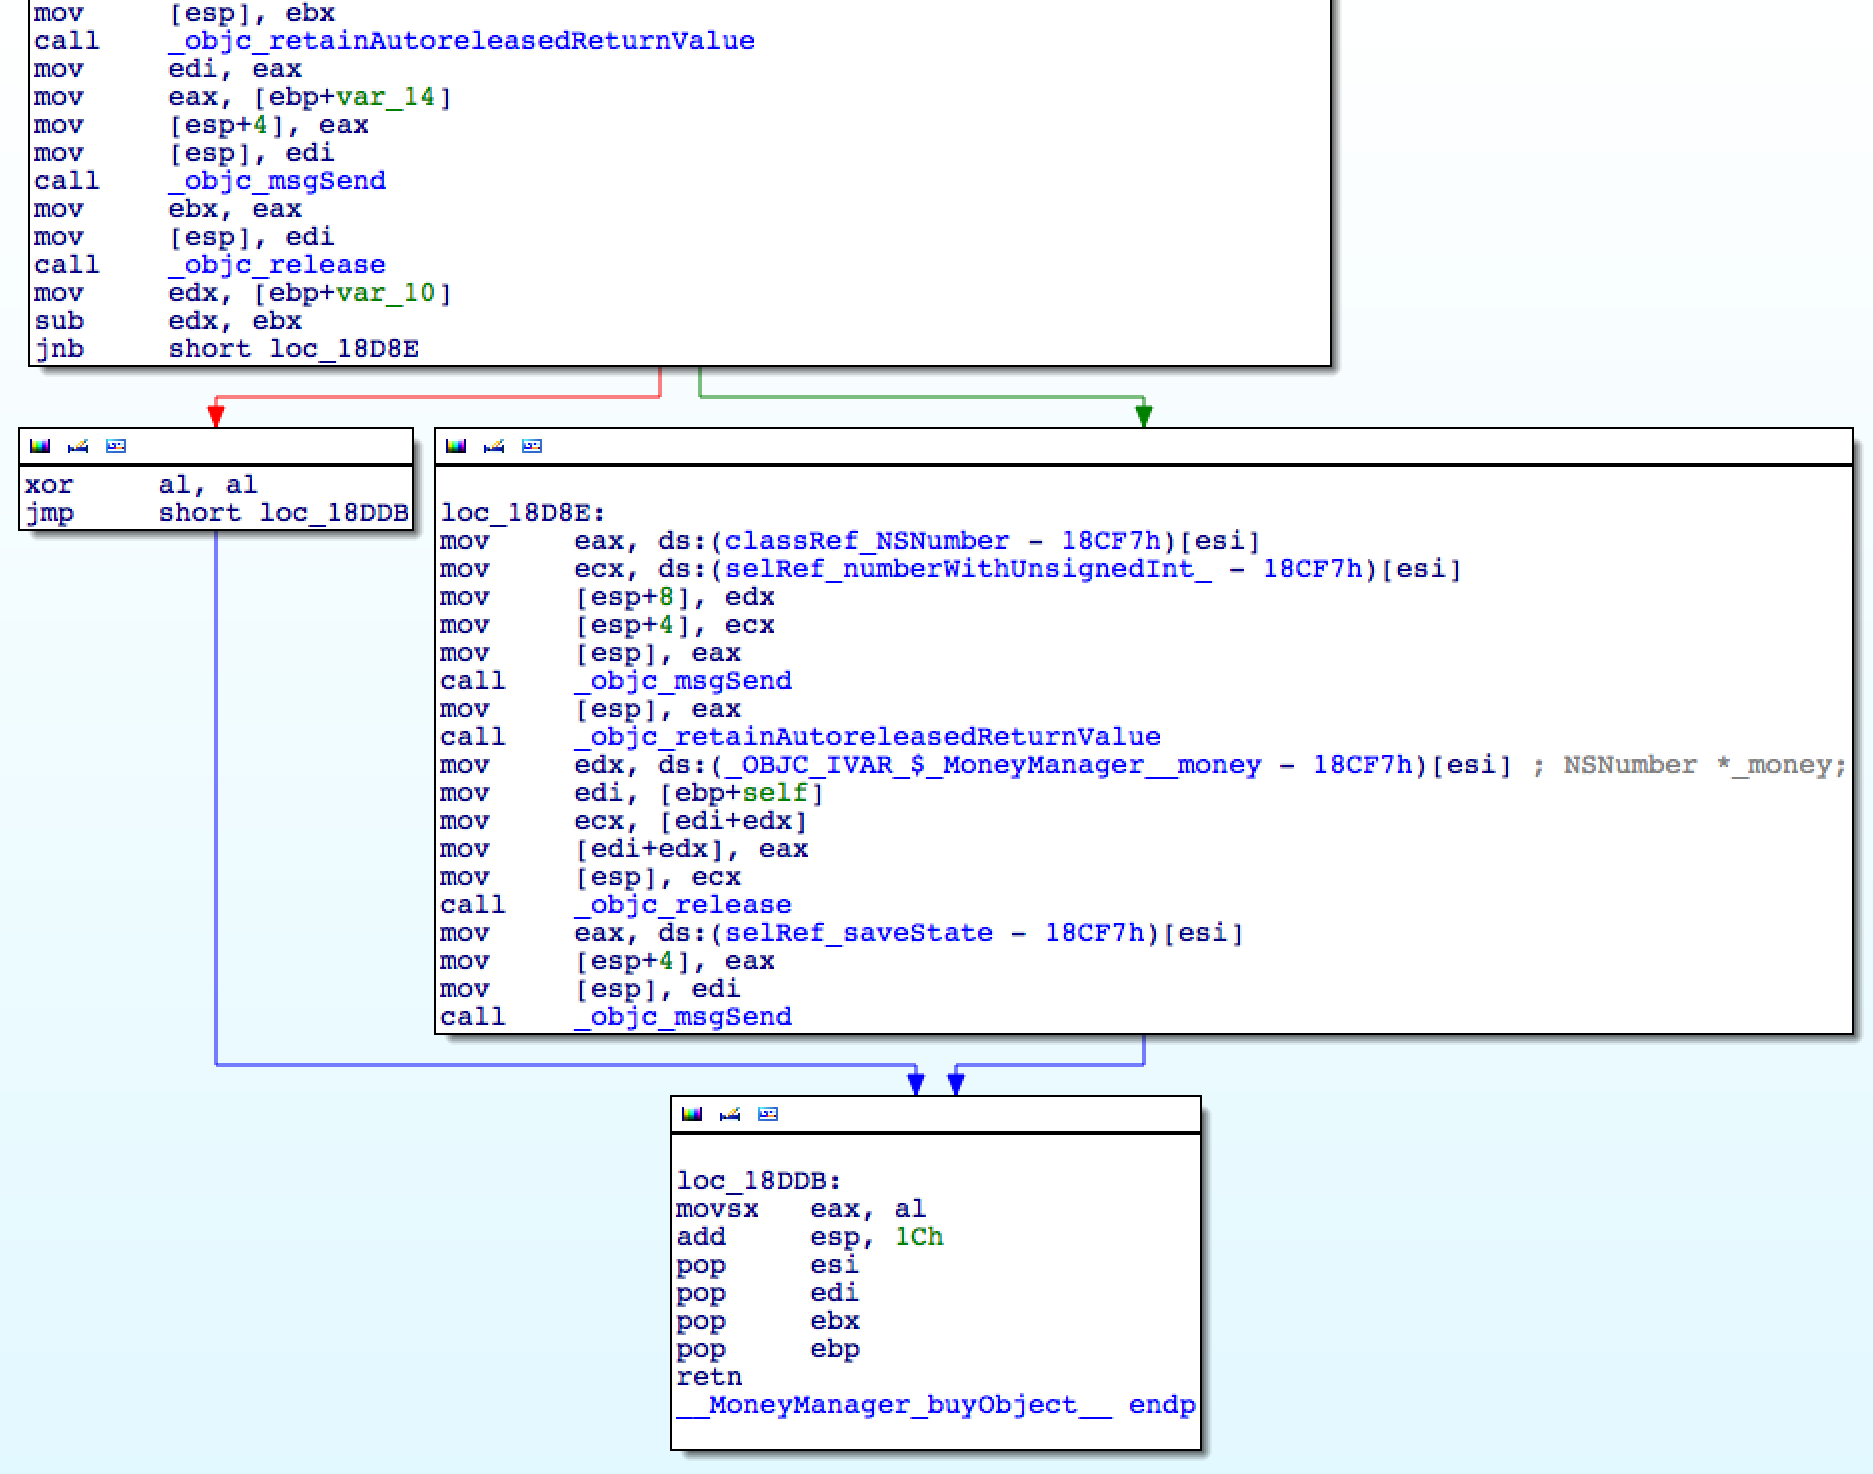
buyObject: - (BOOL)buyObject:(id<PurchasableItemProtocol>)object { NSUInteger totalMoney = self.money.unsignedIntegerValue; NSUInteger cost = [object cost].unsignedIntegerValue; if (totalMoney < cost) { return NO; } _money = @(totalMoney - cost); return [self saveState]; } Learn the algorithm, it's pretty simple. If the variable of the eclamption
_moneydoes not have enough sum to pay, the function will return NO, and the transaction will not be executed. This conditional operator, allowing / prohibiting the purchase, relies on one boolean value: does the user have enough money? (Recalls the behavior of some people in the store? - Approx. Lane. )If this test was bypassed (“jump over”, in terms of assembler), one could buy anything, then the value
_moneywould no longer be considered a factor in the purchase.Now we will find the same code in the disassembler. Go back to IDA, click on any function in the Functions panel (just to activate this panel) and then press ctrl + F(or from the menu: Edit> Quick Filter ). An input field will appear to search for our function. We need to find
buyObject:Aha, found, double click on the name of the method. IDA will show the disassembler window, which perfectly demonstrates the conditional operator and code branching:
Even if you do not know anything from
buyObject:you can assume that the green arrow to the right is exactly the place where we want to go hacking, there is a lot of action. A short code under the red arrow "to the left" looks more like a concise " return nil".I will load you a little with the assembler. Let's look at the conditional operator (“jump”), the lowest one in the upper block, from which there are two arrows - red and green. it
jnbwhich means "jump if not below" (to go if "not less"). Apparently, we should replace this instruction with “jump always” - instruction jmp.To replace the instruction, you need to find it. Double click the operand
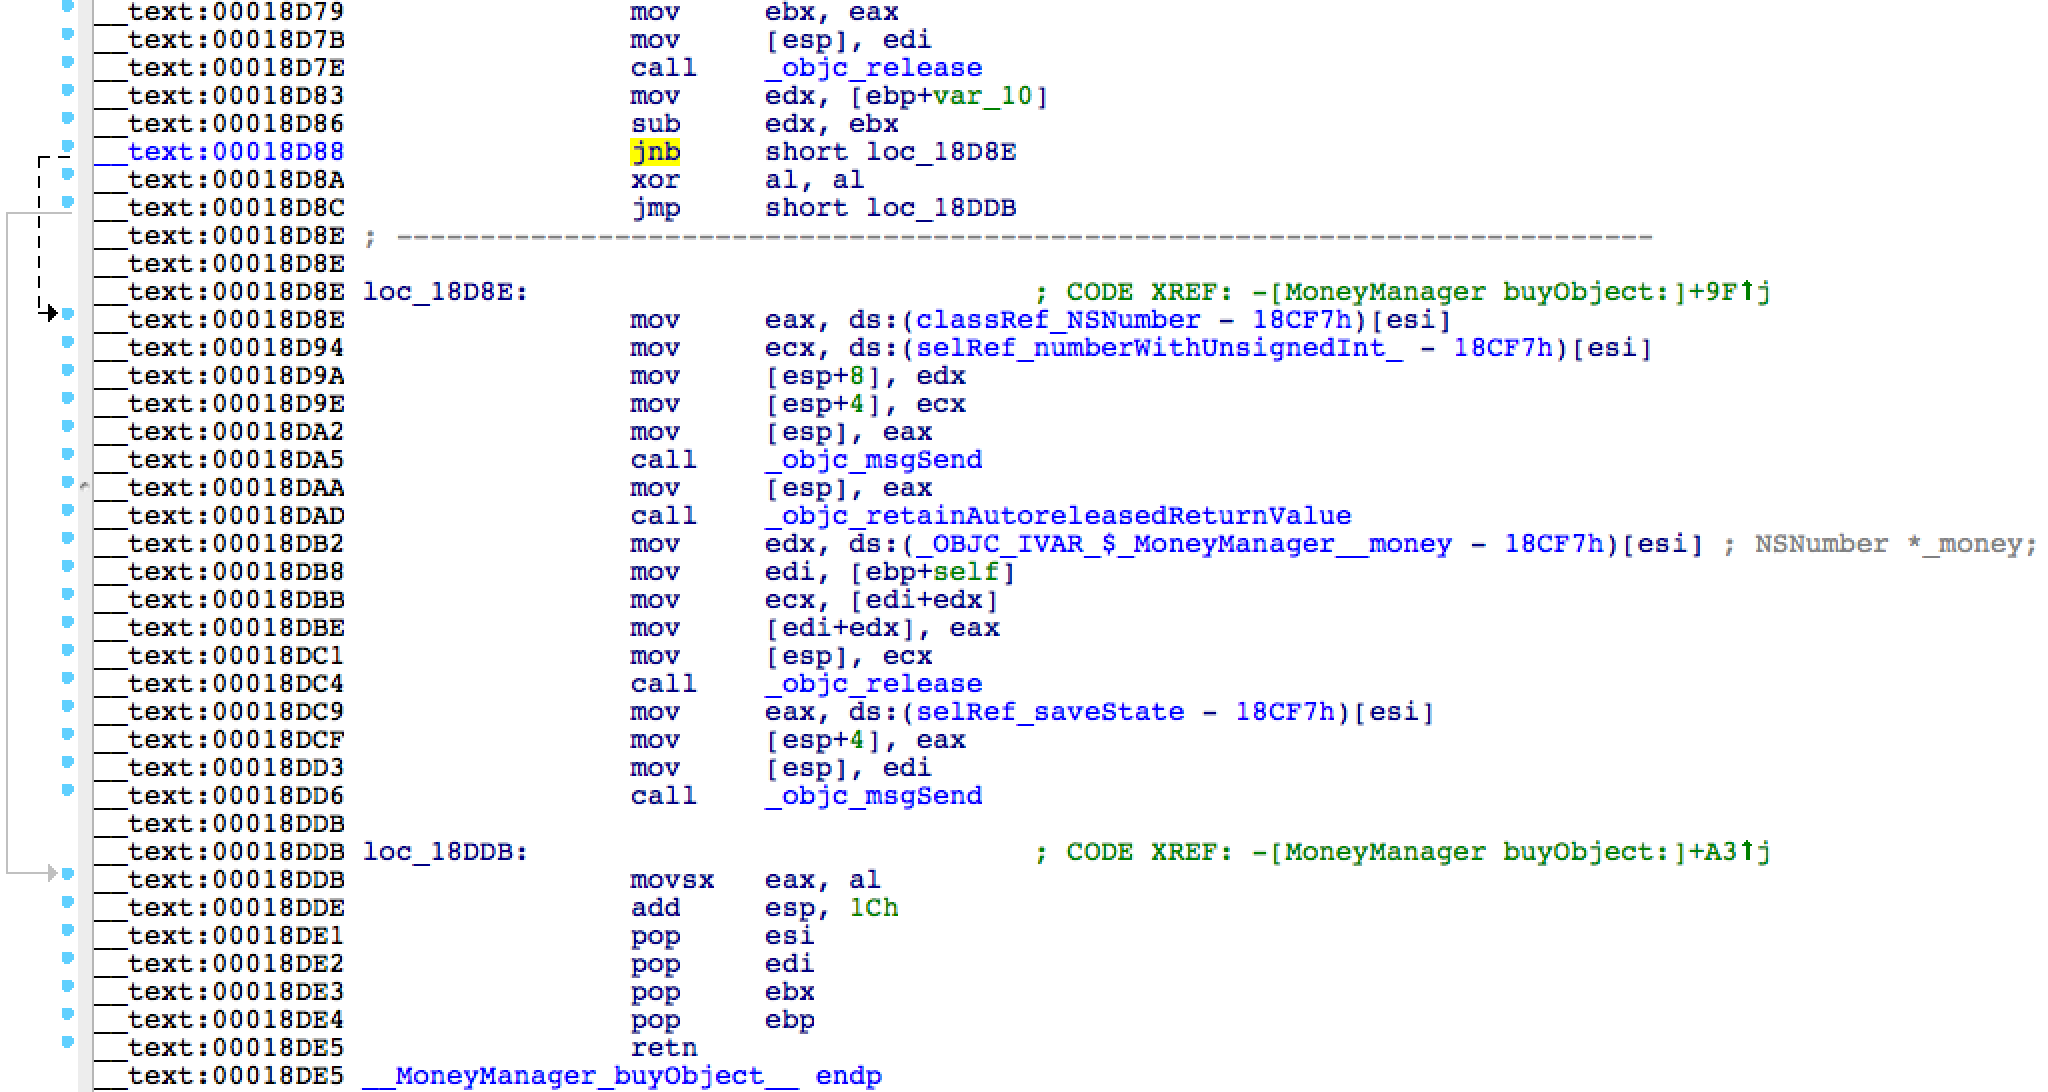
jnb. It will be highlighted in yellow. Now press the spacebar to go to text mode.Here is the same information, but in a linear form. Find the line number with the command
jnb(this line is highlighted):In my case the address was 0x00018D88. Let me remind you that you can have any other address.
The operand code "
jnb short" is 0x73??where question marks indicate the relative offset in bytes where we want to go. We need to change the operand code to 0xEB??- unconditional jump code "jmp short"(for the same number of bytes). Where did I get the operand codes? For example, from the Intel Software Developer's Manual (by the way, exciting reading!)Download (if you have not downloaded yet) Hex Fiend . Install it, for example, by copying to a folder
/Applications. From the terminal (assuming that we are still in the “Meme Collector.app” bundle folder) type the command: open -a "/Applications/Hex Fiend.app/" "Meme Collector" A window will open with our binary. Beautiful, is not it? Here they are - our friends:
__objc_classnameand other sections. Before us is clearly the header of the executable file.Now type in the terminal:
otool -l "Meme Collector" | grep -a10 "sectname __text" As we saw earlier, it
otool -ldisplays the commands to load a binary file into memory. We are interested in the code section (“text” section), so we narrow the search area with the command grep. We got something like this: segname __TEXT vmaddr 0x00001000 vmsize 0x0002e000 fileoff 0 filesize 188416 maxprot 0x00000007 initprot 0x00000005 nsects 11 flags 0x0 Section sectname __text segname __TEXT addr 0x00002970 size 0x0001dec3 offset 6512 align 2^4 (16) reloff 0 nreloc 0 flags 0x80000400 reserved1 0 reserved2 0 Here we see the starting address of the section (
addr) 0x00002970, and the shift ( offset) - 6512 (decimal). You can take IDA and visually make sure that the starting address from which the code starts is exactly 0x2970, for this you need to scroll (in the "linear" form) to the very top. (Remember, your specific values may differ, but the meaning is the same).Fine!Time to do arithmetic: you need to recalculate the instruction offset
jnb(found for the "text" section) to the absolute value inside the binary file. If you try to change the bytes at the address found in the IDA, you will probably have a crash somewhere, since they do not match.In order not to distract us too much, I prepared for you a formula:
{absolute position of a command in a binary file} =
{command address} - {starting address of the text section} + {shift of the text section}
In my case:
Team address
jnb= 0x18D88 (from IDA)Text section start address = 0x2970 (from
otool)Text section shift = decimal 6512 (from
otool)Take the calculator, switch from the menu: View> For programmer ...(do not forget to switch to the desired number system when entering decimal and hexadecimal numbers).
I got:
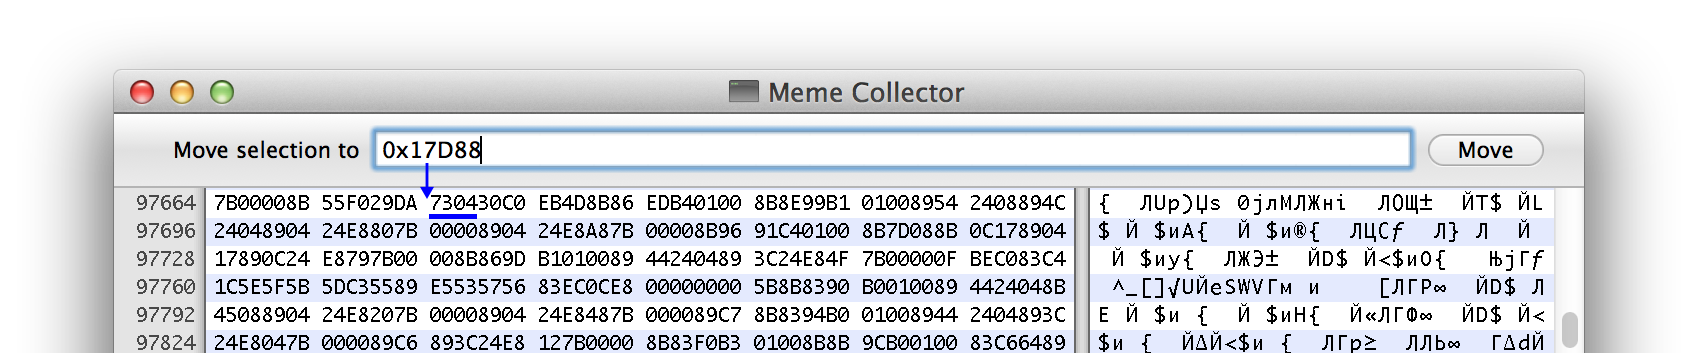
0x18D88 - 0x2970 + 6512 = 0x17D88
Advanced mode
«Advanced Mode» , 0x1000 (0x18D88 – 0x17D88).
If your calculations were correct, this will be the address of the instruction
jnbthat we saw in the IDA. Now in Hex Fiend, click ⌘L (or from the menu Edit> Jump To Offset ) to open the address entry field. Enter your address value (if you enter in hexadecimal format, do not forget 0xat the beginning).Hmm, line numbers for some reason in decimal form. Well, let's recalculate: 0x17D88 = 97672, i.e. from position 97664 you need to count another 8 bytes to the right. 8 bytes = 16 hexadecimal digits = two 4-byte words. You see, Hex Fiend groups a binary "text" by the words: We
skip the first two words, and at the beginning of the third word - here it is - our opcode
0x7304. 0x73- instruction code, and0x04- offset by how many bytes the processor must "jump" forward.Correct
0x73on 0xEB(neatly: one click of Backspace deletes 1 byte = two hexadecimal characters at once). Save ( ⌘S ) and close the file. Open the simulator, delete the application from the memory and run it again (from the simulator, not from the IDE, so that it does not compile again). “Buy” memes until you run out of money. What happened when you tried to buy a product that costs more than you have "money" left?Yes, we really threw out the check of the condition "does the user have money?" And a small bonus: unsigned value
_money"Loops", due to the peculiarities of the representation of numbers in memory, instead of negative it becomes a little less than 10 32 (about 4 billion).Reverse Engineering Protection
How do we protect ourselves? Remember, I said: "Nothing is safe." This statement works here. Reverse engineering can be very difficult, but you can't stop a burglar if he is serious. Your only hope is to confuse the intruders so much that they will give up and start breaking other applications.
One way is to change the names of important classes and methods through the preprocessor. Open the project in the IDE and find the file “Meme Collector-Prefix.pch” in it. Add a line to it:
#define MoneyManager DS_UIColor_Theme This code will replace all occurrences of "
MoneyManager" in a name that seems less interesting to hackers: " DS_UIColor_Theme".This approach should be applied with great care so as not to break anything. You need to make sure 100% that the selected new name is not found anywhere else in your application. Otherwise, you will confuse yourself; unexplainable things will start happening with the application.
Typically, an executable file has a symbol table that stores the mapping of addresses to the readable names of functions and methods. And now, another way to confuse the code is to delete the symbol table after building the project. This is more suitable for hiding C and C ++ functions, because Objective C messages are processed by a single function
objc_msgSend().Open MoneyManager.m again and add the following C function to the beginning:
BOOL aSecretFunction(void) { return YES; } Then compile the application again. Check the existence of this function in the symbol table. From the terminal:
nm "Meme Collector" | grep aSecretFunction The command
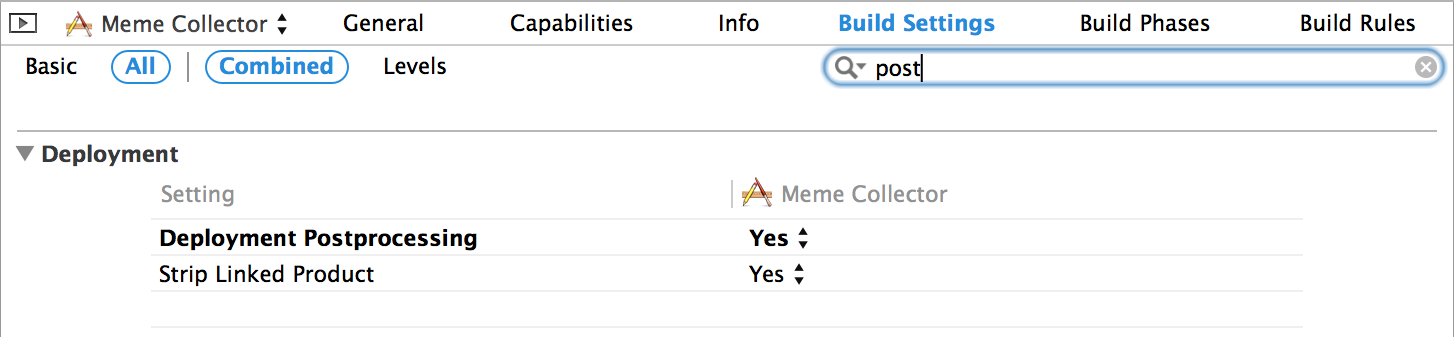
nmdisplays a table of characters, and grepfilters by function name. Here, she is here: 00018b8f t _aSecretFunction An easy way to remove a symbol table from an iOS application is to find two options in the project settings: Deployment Postprocessing and Strip Linked Product, and set them to Yes:
Then you need to “clean” the project (Xcode: Product> Clean or in AppCode: Run> Clean ) and re-compile. Then go to the terminal and run the same command:
nm "Meme Collector" | grep aSecretFunction Excellent!We have successfully deleted the character that referred to
aSecretFunction(). Now the hacker will have to spend more time to find critical moments in the code.What's next?
We made sure that the attacker can:
- easy to see Objective C selector names;
- manipulate the files accessed by your application;
- intercept and modify network interaction;
- manage the runtime environment;
- change the executable file of your application.
When creating an application, it is important to remember these things. Think about how much effort you are willing to make to make the application more secure. What is safety? It is always a balance between your resources (time), the level of problems for your users, and the likelihood of hacking.
The security of an iOS application is a serious topic. You can still learn a lot. So far we have barely scratched the surface. The whole range of features of the debugger and other analysis tools is much deeper. If you are interested in this topic, I advise you to think about jailbreaking the test device. The file system will provide rich research food.
If you have no problems with English, be sure to check out the book Hacking and Securing iOS Applications(author Jonathan Zdziarski). Although it is slightly outdated (you’ll have to google it for changes in the encryption mechanism of Apple applications), but the author of the article is one of the favorite books on iOS and security.
A couple of books:
Hacking: of The Art of Exploitation, 2nd Edition by of Jon Erickson
the Mac OS the X and iOS Internals: the To the Core Apple's's by of Jonathan Levin
Forums:
http://www.woodmann.com
http://www.reddit.com/r/ReverseEngineering
Article on code injection:
http://blog.timac.org/?p=761 The
author can be written in the comments , and on the translation write on mail dev
@x128.ru .Source: https://habr.com/ru/post/199130/
All Articles