Visualization of a two-dimensional gaussian on a plane
 Good day. In the process of developing one of the clustering methods, I had a need to visualize Gaussians (to draw an ellipse in essence) on a plane using a given covariance matrix . But somehow I didn’t think at once that there were some difficulties hiding behind the simple drawing of a regular ellipse on 4 numbers. It turned out that when calculating the points of the ellipse, the eigenvalues and eigenvectors of the covariance matrix, the Mahalanobis distance , as well as the quantile chi-square distribution , which I, frankly, have not used since the times of the university have been used.
Data and their relative position
')
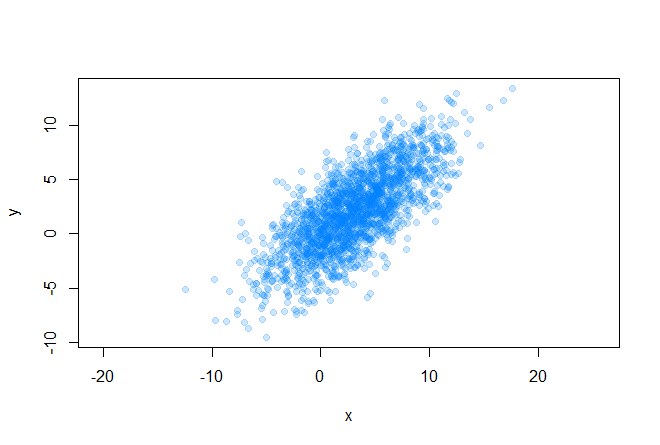
Let's start with the initial conditions. So, we have some array of two-dimensional data

for which we can easily find out the covariance matrix and mean values (center of the future ellipse):
plot(data[, 1], data[, 2], pch=19, asp=1, col=rgb(0, 0.5, 1, 0.2), xlab="x", ylab="y") sigma <- cov(data) mx <- mean(data[, 1]) my <- mean(data[, 2]) Before proceeding with the drawing of an ellipse, you need to decide what size the figure will be. Here are some examples:

To determine the size of an ellipse, we recall the Mahalanobis distance between two random vectors from one probability distribution with a covariance matrix Σ :

You can also determine the distance from the random vector x to the set with the mean value μ and the covariance matrix Σ :

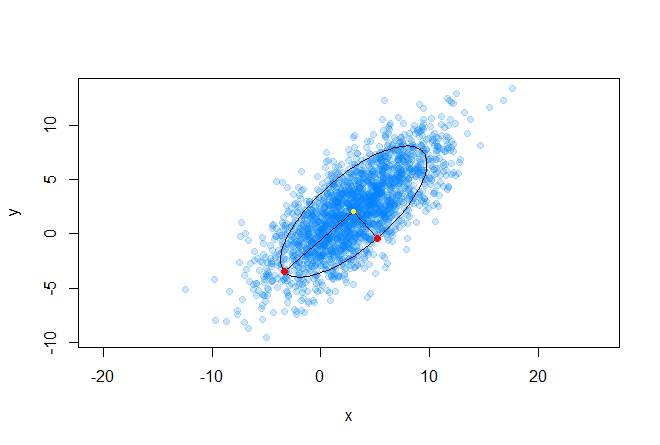
It should be noted that in the case when Σ is equal to the identity matrix, the Mahalanobis distance degenerates into Euclidean distance. The meaning of the Mahalanobis distance is that it takes into account the correlation between variables; or in other words, the scatter of data relative to the center of mass is taken into account (it is assumed that the scatter has the shape of an ellipsoid). In the case of using the Euclidean distance, the assumption is used that the data are spherically (uniformly distributed across all dimensions) around the center of mass. We illustrate this with the following schedule:

The center of mass is marked in yellow, and two red points from the dataset located on the main axes of the ellipse are at the same distance, in the Mahalanobis sense, from the center of mass.
Ellipse and chi-square distribution
An ellipse is a central nondegenerate curve of the second order, its equation can be written in general form (we will not write out the restrictions):

On the other hand, you can write the equation of an ellipse in matrix form (in homogeneous two-dimensional coordinates):

and get the following expression to show that the ellipse is actually given in the matrix form:

Now remember the distance of Mahalanobis, and consider its square:

It is easy to see that this representation is identical to writing the equation of an ellipse in matrix form. Thus, we have seen that the Mahalanobis distance describes an ellipse in Euclidean space. The Mahalanobis distance is simply the distance between a given point and the center of mass divided by the width of the ellipsoid in the direction of the given point.
There comes a delicate moment to understand, it took me some time to realize: the square of the Mahalanobis distance is the sum of the squares of the k-th number of normally distributed random variables , where n is the dimension of space.
Recall that this chi-square distribution is the distribution of the sum of squares of k independent standard normal random variables (this distribution is parametrized by the number of degrees of freedom k). And this is precisely the distance of Mahalanobis. Thus, the probability that x is inside an ellipse is expressed by the following formula:

And here we come to the answer to the question about the size of an ellipse - we will determine its size by quantiles of the chi-square distribution, this is easily done in R (where q is from (0, 1) and k is the number of degrees of freedom):
v <- qchisq(q, k) Getting the outline of an ellipse
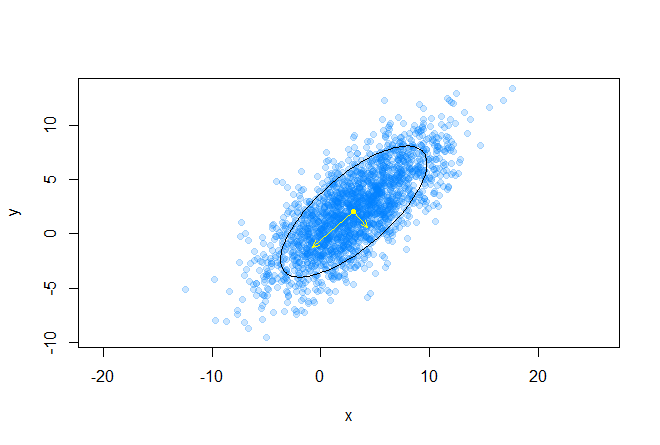
The idea of generating the contour of the ellipse we need is very simple, we just take a series of points on the unit circle, displace this circle to the center of mass of the data array, then scale and stretch this circle in the right directions. Consider a geometric interpretation of a multidimensional Gaussian distribution: as we know, this is an ellipsoid, whose direction of the main axes is given by the eigenvalues of the covariance matrix, and the relative length of the main axes is given by the root of the corresponding eigenvalues.
The following graph shows the eigenvectors of the covariance matrix scaled to the roots of the corresponding eigenvalues, the directions correspond to the principal axes of the ellipse:

Consider the decomposition of the covariance matrix in the following form:

where U is the matrix formed by the unit eigenvectors of the matrix Σ , and Λ is the diagonal matrix composed of the corresponding eigenvalues.
e <- eigen(sigma) And also consider the following expression for a random vector from a multidimensional normal distribution:

Thus, the distribution N (μ, Σ) is, in fact, the standard multidimensional normal distribution N (0, I) scaled by Λ ^ (1/2) , rotated by U and shifted by μ .
Let's now write a function that draws an ellipse, with the following inputs:
- mx, my - coordinates of the center of mass
- sigma - covariance matrix
- q is the chi-square distribution quantile
- n - density of discretization of the ellipse (the number of points on which the ellipse will be built)
GetEllipsePoints <- function(mx, my, sigma, q = 0.75, n = 100) { k <- qchisq(q, 2) # sigma <- k * sigma # e <- eigen(sigma) # angles <- seq(0, 2*pi, length.out=n) # n- cir1.points <- rbind(cos(angles), sin(angles)) # ellipse.centered <- (e$vectors %*% diag(sqrt(abs(e$values)))) %*% cir1.points # ellipse.biased <- ellipse.centered + c(mx, my) # return(ellipse.biased) # } Result
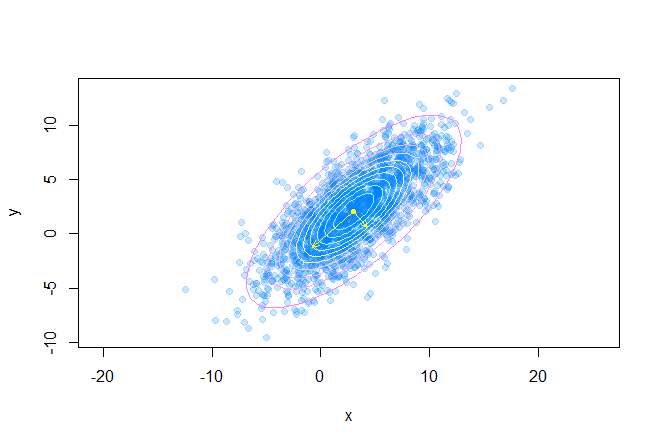
The following code draws many confidence ellipses around the center of mass of the dataset:
points(mx, my, pch=20, col="yellow") q <- seq(0.1, 0.95, length.out=10) palette <- cm.colors(length(q)) for(i in 1:length(q)) { p <- GetEllipsePoints(mx, my, sigma, q = q[i]) points(p[1, ], p[2, ], type="l", col=palette[i]) } e <- eigen(sigma) v <- (e$vectors %*% diag(sqrt(abs(e$values)))) arrows(c(mx, mx), c(my, my), c(v[1, 1] + mx, v[1, 2] + mx), c(v[2, 1] + my, v[2, 2] + my), As a result, we get the following picture:

Read
The code can be found on my githaba .
Source: https://habr.com/ru/post/199060/
All Articles