Write Back in MS SQL Server Analysis Service cubes
Today, In-Memory BI solutions are becoming increasingly popular. Cubes are no longer in vogue, their structure is morally obsolete, and although they scale pretty well, the requirements for the speed of modern BI systems have increased significantly. Nevertheless, many companies are still successfully using analytics built on one of the OLAP servers (Microsoft, Oracle, Cognos, and others). For example, I really like the Microsoft SQL Server Analysis Service, and I would like to tell you how you can use a function that is a bit unusual for analytics in it - write back to the source (Write Back).
It is necessary to make a sales plan for the year by month, product and region. At the same time, it is necessary to see the actual data of the current year and the calculated trend for the next year, which the manager will change. The data entry tool should be convenient, it should allow you to overlay filters and look at the results for different groupings (in general, by region, product and period) and still not require a lot of time from the user to study.
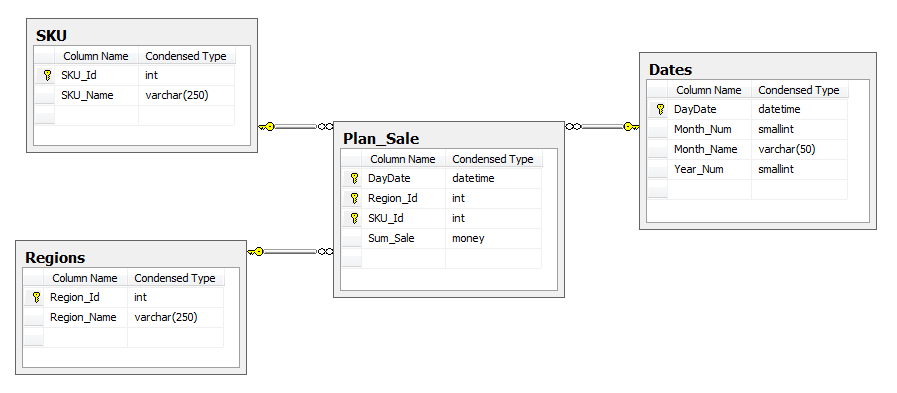
We will use MS SQL Server 2008 R2 (Database Engine and Analysis Service) + Excel 2010. Create a database, several tables and fill them with data.
')
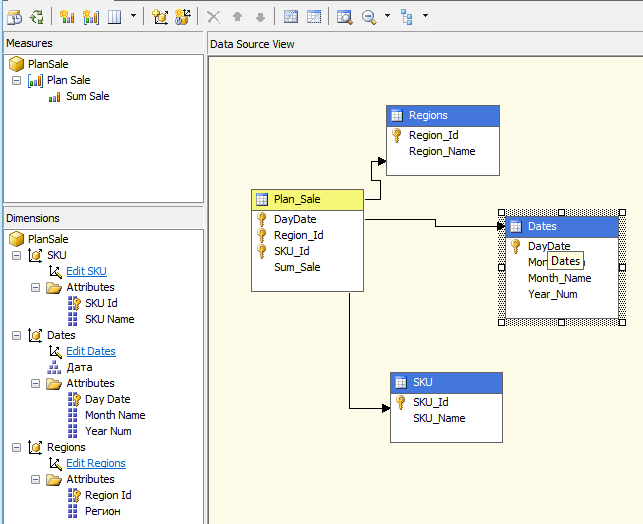
Create a cube.
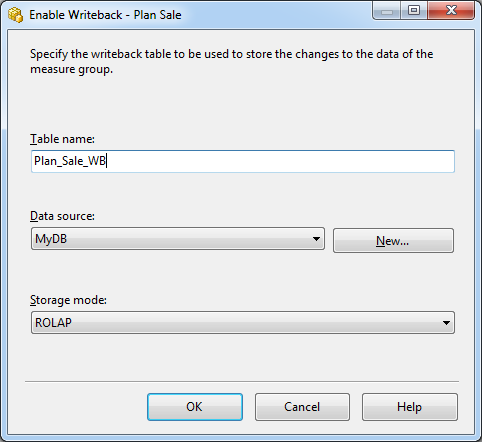
Activate Write Back for the partition, specify the data source and the table. Process the cube.
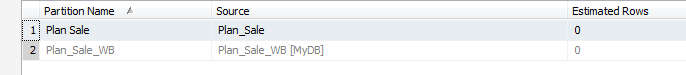
This is how the table will look in the database:
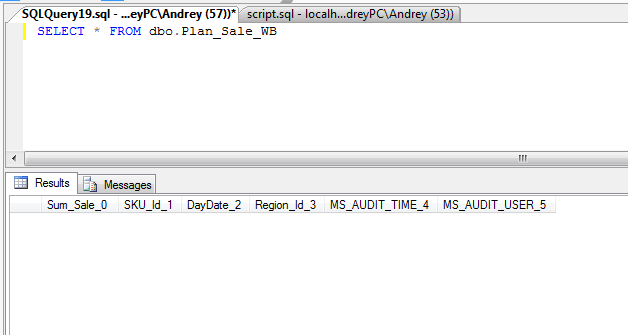
Do not change anything in its structure - the writeback may break. The changes correcting the initial value will fall into this table. To get the real value, the data from this table must be added to the data from the original table.
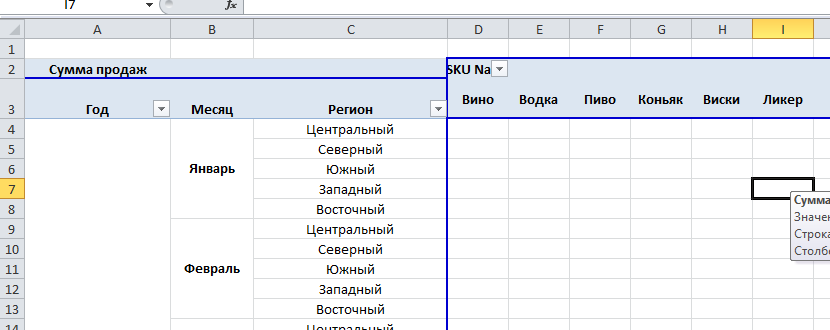
As a client, we use Excel. Prior to Excel version 14.0, you had to write data using a macro, or in version 13.0, add-in (AddIn). Starting with Excel 2010, the ability to edit data has become part of the functionality. Two data writing modes are supported: temporary writeback, also known as What If Analysis, and permanent writeback.
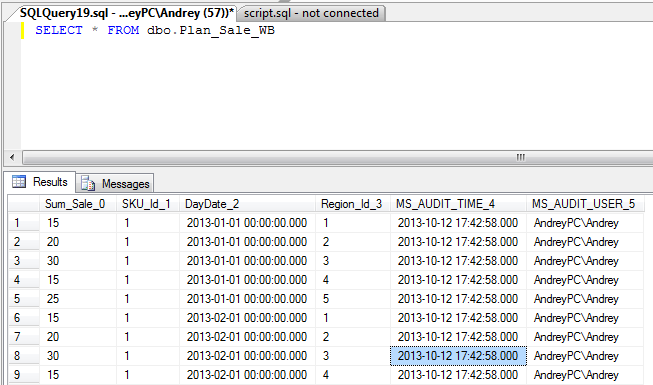
Let's see what is in our Write Back table in the database:
The distribution of data can be more complex, for example: the user enters data at the top level of the hierarchy, and the data is distributed into leaf elements using the coefficients set in the leaf elements. It will all depend on your imagination and tasks.
This is such a simple and most importantly common budgeting tool for a simple user. Easy to use and quick to set up. I will answer all questions - write!
Link to used files .
Formulation of the problem.
It is necessary to make a sales plan for the year by month, product and region. At the same time, it is necessary to see the actual data of the current year and the calculated trend for the next year, which the manager will change. The data entry tool should be convenient, it should allow you to overlay filters and look at the results for different groupings (in general, by region, product and period) and still not require a lot of time from the user to study.
Decision.
We will use MS SQL Server 2008 R2 (Database Engine and Analysis Service) + Excel 2010. Create a database, several tables and fill them with data.
')
Script database creation and filling tables
CREATE DATABASE [MyDB] ON PRIMARY ( NAME = N'MyDB', FILENAME = N'C:\MyDB.mdf' , SIZE = 3072KB , FILEGROWTH = 1024KB ) LOG ON ( NAME = N'MyDB_log', FILENAME = N'C:\MyDB_log.ldf' , SIZE = 1024KB , FILEGROWTH = 10%) GO USE MyDB GO CREATE TABLE dbo.Dates (DayDate DATETIME, Month_Num SMALLINT, Month_Name VARCHAR(50), Year_Num SMALLINT, PRIMARY KEY (DayDate)) GO INSERT INTO dbo.Dates (DayDate, Month_Num, Month_Name, Year_Num) VALUES ('20130101', 1, '', 2013), ('20130201', 2, '', 2013), ('20130301', 3, '', 2013), ('20130401', 4, '', 2013), ('20130501', 5, '', 2013), ('20130601', 6, '', 2013), ('20130701', 7, '', 2013), ('20130801', 8, '', 2013), ('20130901', 9, '', 2013), ('20131001', 10, '', 2013), ('20131101', 11, '', 2013), ('20131201', 12, '', 2013) GO CREATE TABLE dbo.Regions (Region_Id INT, Region_Name VARCHAR(250), PRIMARY KEY (Region_Id)) GO INSERT INTO dbo.Regions (Region_Id, Region_Name) VALUES (1, ''), (2, ''), (3, ''), (4, ''), (5, '') GO CREATE TABLE dbo.SKU (SKU_Id INT, SKU_Name VARCHAR(250), PRIMARY KEY (SKU_Id)) GO INSERT INTO dbo.SKU (SKU_Id, SKU_Name) VALUES (1, ''), (2, ''), (3, ''), (4, ''), (5, ''), (6, ''), (7, ''), (8, ''), (9, ''), (10, '') GO CREATE TABLE dbo.Plan_Sale (DayDate DATETIME, Region_Id INT, SKU_Id INT, Sum_Sale MONEY, PRIMARY KEY (DayDate, Region_Id, SKU_Id)) GO Create a cube.
Activate Write Back for the partition, specify the data source and the table. Process the cube.
This is how the table will look in the database:
Do not change anything in its structure - the writeback may break. The changes correcting the initial value will fall into this table. To get the real value, the data from this table must be added to the data from the original table.
As a client, we use Excel. Prior to Excel version 14.0, you had to write data using a macro, or in version 13.0, add-in (AddIn). Starting with Excel 2010, the ability to edit data has become part of the functionality. Two data writing modes are supported: temporary writeback, also known as What If Analysis, and permanent writeback.
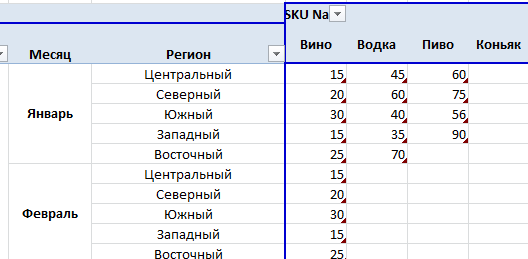
- Connect the data source. In the pivot table, enable these options.

- From inside the pivot table that is connected to the cube, click the Work with Pivot Tables tab.

- Find the what-if analysis group .
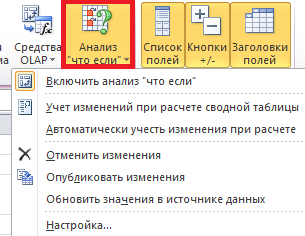
- This group has an Enable what-if analysis menu item. When enabled, it will be possible to enter data into the data area of the pivot table.
- The data you enter will be highlighted with a marker in the lower right corner of the cell. These data do not get anywhere yet and do not affect the other indicators in the cube.
- 6. After making a portion of the data, in the “what if” analysis group menu , select Accounting changes when calculating the pivot table — all fields that depend on the values you enter will be updated (you can turn on the changes automatically when calculating the pivot table , then after each input value data will be updated). This item can be skipped and immediately publish changes (p.6).

- After you have taken into account the changes, you must click Publish changes , otherwise the data will not fall into the permanent storage tables and will be lost . After the publication of the change, the marker in the lower right corner of the cell disappears, the data will be saved in the database.
Let's see what is in our Write Back table in the database:
Conclusion
The distribution of data can be more complex, for example: the user enters data at the top level of the hierarchy, and the data is distributed into leaf elements using the coefficients set in the leaf elements. It will all depend on your imagination and tasks.
This is such a simple and most importantly common budgeting tool for a simple user. Easy to use and quick to set up. I will answer all questions - write!
Link to used files .
Source: https://habr.com/ru/post/198098/
All Articles