Work with tables in MultiCAD.NET. Part 1. Creating a report based on a template

With this publication we will open a series of articles about the possibilities and features of the API for working with tables in MultiCAD.NET.
As you know, practically no drawing is complete without tabular design: the tables are used to create objects containing quantitative information about the structure, statement of elements, specifications, etc. A typical task faced by designers is to create a tabular report on selected drawing objects. Automating this task will save the user from the routine work, thereby reducing the time spent and the number of errors.
')
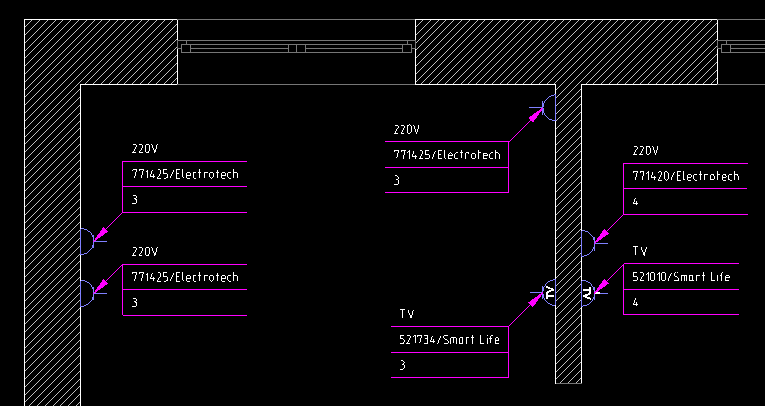
As an example, consider the formation of the final sheet of electrical appliances according to the equipment layout plan (or, more simply, according to a drawing illustrating the distribution of electrical outlets across rooms).
Each outlet is marked with a multilevel callout, which contains the following information:
- outlet type
- article / manufacturer,
- room number for installation.
The process of solving the task can be divided into three stages:
- creating your own table template for the report,
- loading the template and sequentially filling the table with data
- breakdown and pagination of the table.
Creating a table template
Tabular reports are usually formed on the basis of standard templates, for the creation of which the tabular UI is more often used. However, for demonstration purposes, we will create our own template using the MultiCAD.NET software. The general view of the final table will look as follows:

The cell values correspond to the number of installed electrical outlets of a particular model in a particular room. The table will also contain two headers: a normal page header, which, if a table is split, will be added to each page of the report, except the first, and the first page header.
An example of a method that creates such a template and saves it to a file with the specified name
bool CreateTemplate(string FileName) { McTable table = new McTable(); table.DefaultCell.HorizontalTextAlign = HorizTextAlign.Center; table.DefaultCell.VerticalTextAlign = VertTextAlign.Center; table.Columns.AddRange(0, 2); table.Columns[0].Width = 55; table.Columns[1].Width = 10; // table.Rows.InsertSection(SectionTypeEnum.HeaderFirst, 0, 2); System.Drawing.Rectangle rect = new System.Drawing.Rectangle(0, 0, 1, 0); table.Merge(rect); table[0, 0].TextHeight = 3.5; table.Rows[0].Height = 10; table[0, 0].Value = " "; foreach (var cell in table.Rows[0].Cells) cell.SetBorderLineweight(BorderTypesEnum.ButBottom, -9); table.Rows[1].Height = 8; foreach (var cell in table.Rows[1].Cells) { cell.TextHeight = 2.5; } table[1, 0].Value = " "; table[1, 1].Value = "#room"; // table.Rows.InsertSection(SectionTypeEnum.Header, 2); table.Rows[3].Height = 8; foreach (var cell in table.Rows[3].Cells) { cell.TextHeight = 2.5; } table[3, 0].Value = " "; table[3, 1].Value = "#room"; // table.Rows.InsertSection(SectionTypeEnum.None, 4); table.Rows[5].Height = 6; table[5, 0].Value = "#code"; // if (!table.SaveToFile(FileName)) { return false; } return true; } The proposed structure of the table and the format of the cells can be changed in the template in accordance with the preferences of the user using the table editor.
In this implementation, the cells of the template contain special identifier strings "#code" and "#room", which, in the course of filling the table, will allow determining which data should be written to a specific cell. This will ensure the correct filling of the table even with the possible change in the number of rows and columns in the template.
Report generation
The algorithm for constructing a report table can be divided into the following steps:
- registration of the report creation team,
- the selection on the drawing of all callouts containing a description of electrical outlets,
- loading the template, launching the table editor for possible template changes,
- structuring the data of selected objects for subsequent writing to the table,
- filling in the table footers (table name, column names by the number of rooms),
- filling in the rows of the table.
The full sample code is available at this link , and we will focus on some key points.
Registration of the report creation team
Add the “main” method of the application, which is the processor of the
smpl_CreateTableReport and will contain the implementation of the algorithm: [CommandMethod("smpl_CreateTableReport", CommandFlags.NoCheck | CommandFlags.NoPrefix)] public void smpl_CreateTableReport() { // } Object selection
The selection of objects like “callout for multilayer structures” is carried out in the standard way, by specifying the filter of objects:
McObjectId[] idSelecteds = ObjectFilter.Create(true).AddType(McNoteMultilayer.TypeID).GetObjects().ToArray(); if (idSelecteds == null || idSelecteds.Length == 0) { return; } As a result of selecting objects by filter, we received an array of Id of all callouts in the drawing. By Id, you can get the contents of the lines of each callout:
McNoteUnitCollection units=(McNoteMultilayer)id.GetObject()).Units; To populate the table, it will be convenient to write the contents of all selected objects into a single data structure suitable for searching and sorting elements. In this example, a structure from nested dictionaries of the form is used: <article <room_number, number >> .
Loading template
We assume that we have already created a template of the desired structure using the
CreateTemplate() method and saved it to a file, for example, “C: \ template.dat” . The table is McTable.LoadFromFile() from an external file using the McTable.LoadFromFile() method. Create a table object, load structure and content for it from the created template, and call the spreadsheet editor to allow the user to make changes to the template, if any. Of course, the table template must be written in a format that allows you to save not only the content, but also the structure and formatting of the table. const string FileName = "C:\\template.dat"; McTable Table = new McTable(); if (!Table.LoadFromFile(FileName)) { return; } Table.OnEdit(); 
After that, you can begin to fill in the table. The process consists in sorting, sequentially enumerating the data obtained from the callout lines and adding them as values of the corresponding cells. Given the variety of possible implementations, we will not dwell on this moment; You can find the solution used in writing this example in the source code of the project.
Spreadsheet into pages
Separately, it is worth mentioning this useful feature when working with tables, as pagination. By default, the report is presented in the form of a single table, the size of which with a large number of rows can be critical. You can split a table into pages with height restrictions using the
McTable.PagesTable.SetPageHeight(). method McTable.PagesTable.SetPageHeight(). The following code fragment will break the table into pages no more than 50 high: const double pageHeight = 50; double tableHeight = Table.DbEntity.BoundingBox.SizeByY; if (tableHeight > pageHeight) { Table.Pages.SetPageHeight(pageHeight); } 
An additional way is to insert a forced page break using the
McTable.PagesTable.SetPageBreak() method. For example, to split a table into two pages in a row with index 7: Table.Pages.SetPageBreak(7); The result will be a table consisting of two pages:

After the table has been split by any of these methods, you need to set the insertion point of each page relative to the table insertion point using the
McTable.PagesTable.SetOriginPage() method, the first argument of which is the page number and the second is the point coordinates. For example, to place pages with an interval of 5 units: for (int n = 0; n < Table.Pages.Count; n++) { Table.Pages.SetOriginPage(n, new Point3d(n * (tableWidth + 5 * Table.DbEntity.Scale), 0, 0)); } Download the application in AutoCAD
As usual, our example will be launched in the nanoCAD environment after loading the built library and running the registered
smpl_CreateTableReport . To run MultiCAD.NET applications in an AutoCAD environment, you need to use a special application adapter (Object Enabler). It should be noted that the standard MultiCAD Enabler for AutoCAD does not contain tools for working with objects from the Multicad.Symbols namespace, therefore, to run applications dealing with such objects, you must first download the GraphiCS or MechaniCS applications that contain all primitives, including tables and callouts.Discussion of the article is also available on our forum: forum.nanocad.ru/index.php?showtopic=6510 .
Translation of the article into English: Tables in MultiCAD.NET. Generating reports based on table templates .
See also:
Work with tables in MultiCAD.NET. Part 2. Creating and editing
Work with tables in MultiCAD.NET. Part 3. External table files and data exchange with Microsoft Excel
Source: https://habr.com/ru/post/197794/
All Articles