Creating cross-browser visualization of audio
About a year ago, the task appeared to make a beautiful html5 audio player. Designers have drawn the simplest visualization:
The easiest option is to draw against the background of "noise" that is not related to the playing music. But we are not looking for easy ways.
')
On Habré there was an article on visualization of audio in HTML5 , in which the issue of visualization using javascript is considered in detail. There are 2 standards for obtaining audio information:
Standards are very different from each other, using these APIs we could only achieve support in these browsers. We wanted to expand the list and came up with a solution that worked even in older versions of IE.
Simplified demo
All music was imported from a third-party service and passed preprocessing written in ruby - 128kb stereo mp3 conversion. We added to this the creation of a json file for visualization.
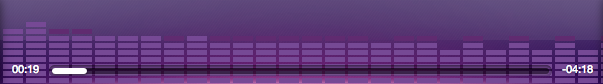
In Figure 30, the columns show the saturation of the frequency range: low frequencies - on the left, high frequencies - on the right.
Without going into details of the algorithm, on the server, using 2 gems - wavefile to get data from .wav files and fftw3 to calculate the fast Fourier transform, json was generated in the following format:
On average, the size of the visualization file is 500kb.
Experimentally, we chose the “resolution” of 0.04 seconds, at which the visualization changes smoothly (do you remember about 24 frames per second?) And the file size does not increase. Funny fact: at the first implementation, the height of the columns was represented by a number with a dot and the file size reached 5 megabytes. Adding a cast to an integer has reduced the file size dozens of times.
On the client, the algorithm is obvious: for each audio file from the server, json-rendering is taken. During playback for the current time, the nearest time is taken from the file and 30 columns are drawn, the height of which is calculated on the server.
The obvious disadvantage of the approach: to change the appearance of the visualization, you need to regenerate all the files. But over the year, the appearance did not change and such a problem did not arise. Another drawback: for each audio you need to store a half-megabyte render file. But at the same time, visualization works in all browsers.
The easiest option is to draw against the background of "noise" that is not related to the playing music. But we are not looking for easy ways.
')
On Habré there was an article on visualization of audio in HTML5 , in which the issue of visualization using javascript is considered in detail. There are 2 standards for obtaining audio information:
- Web Audio API for Chrome,
- Audio Data API for Firefox.
Standards are very different from each other, using these APIs we could only achieve support in these browsers. We wanted to expand the list and came up with a solution that worked even in older versions of IE.
Simplified demo
All music was imported from a third-party service and passed preprocessing written in ruby - 128kb stereo mp3 conversion. We added to this the creation of a json file for visualization.
Server-side
In Figure 30, the columns show the saturation of the frequency range: low frequencies - on the left, high frequencies - on the right.
Without going into details of the algorithm, on the server, using 2 gems - wavefile to get data from .wav files and fftw3 to calculate the fast Fourier transform, json was generated in the following format:
{ // — 0.0: [/* 30 */], 0.04: [...], 0.08: [...] ... } On average, the size of the visualization file is 500kb.
Experimentally, we chose the “resolution” of 0.04 seconds, at which the visualization changes smoothly (do you remember about 24 frames per second?) And the file size does not increase. Funny fact: at the first implementation, the height of the columns was represented by a number with a dot and the file size reached 5 megabytes. Adding a cast to an integer has reduced the file size dozens of times.
Client-side
On the client, the algorithm is obvious: for each audio file from the server, json-rendering is taken. During playback for the current time, the nearest time is taken from the file and 30 columns are drawn, the height of which is calculated on the server.
Cons and pros
The obvious disadvantage of the approach: to change the appearance of the visualization, you need to regenerate all the files. But over the year, the appearance did not change and such a problem did not arise. Another drawback: for each audio you need to store a half-megabyte render file. But at the same time, visualization works in all browsers.
Source: https://habr.com/ru/post/196668/
All Articles