Fast tracks on google maps
I am working on the visualization of paragliding competitions - I am writing a race viewer for Airtribune.com . In the process of work, I come across interesting and non-standard tasks. One of them is the task of quickly drawing markers and tracks on google maps.
The scales are as follows: there are ~ 200 trackers in a fairly limited area (50x50km), each transmitting data about its position every 10 seconds. It is necessary to draw them all on the map and smoothly move when the coordinates change. A track should be drawn behind each marker. The picture is about the following:
')
It soon became apparent that the built-in objects — google.maps.Marker and google.maps.Polyline — are too slow for this task. There was a lot of ideas for optimization, and as a result we got a solution on the canvas that works at a speed of 40fps even on a thousand markers. However, you can measure fps yourself - I assembled a test application for comparing 4 engines, in which you can plug in different chips on the fly and look at the speed of work.
kasheftin.imtqy.com/gmaps is a demo here, github.com/Kasheftin/gmaps is the source code here. Works in firefox and chrome, html + js. Used google maps api v3, knockout, require, underscore and bootstrap.
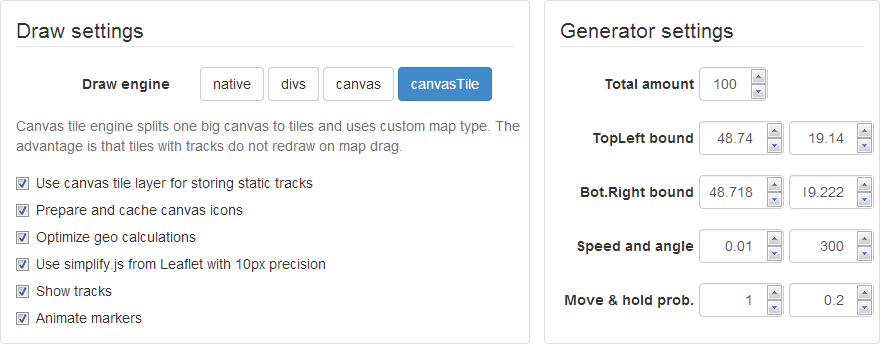
The settings are divided into two parts - in the right part is the coordinate generator. In addition to managing the number of markers there is little interesting. The generator emulates a real server, i.e. spits out data in chunks a minute ahead. Therefore, if the settings change, the changes are not immediately visible. Speed is the maximum value by which latitude or longitude can change in a second. Angle - the maximum angle at which the course can change. The probability of movement is the probability that data with the coordinates of the pilot will arrive at this second, and hold is the probability that the data will come the same (ie, the pilot will hang in one place). Between control points, the movement is considered uniform straight.
The most interesting is in the left column of settings. Here you can switch the engines, when you select the engine, checkboxes with its settings are displayed under it, and everything is connected on the fly on the same data set - this is done in order to adequately evaluate fps. The fps itself will be displayed if you click on the play button above the map. Fps is measured stupidly and practically - the requestAnimFrame method is used to play the animation - how many times it has time to work in a second, such and fps.
This is a drawing using standard google maps. The first thing that comes to mind is to use google.maps.Marker to display the current position of the trackers and google.maps.Polyline to draw the tracks. The reason for the brakes during animation is object logic. Markers and lines are pictures on canvas, but we communicate with them as with objects. And it is expensive. Marker movements should be smooth. If at this point in time the marker has no coordinates, its instantaneous coordinates are calculated as a linear proportion between the existing coordinates before and after. This means that EVERY markers are shifted in each frame.
Suppose that 100 markers with random coordinates were created in the markers array. Consider the code:
The run function is roughly an animation frame. In each frame, each marker in turn moves to a new position using the very convenient setPosition method. It is about the following:
Suppose there is a code that performs an action in a loop, and it is not known how long it takes (a classic example is the function requestAnimFrame). I want to know this time, add it to the timer and get some time to show in the player. It is natural to expect that the calculated time will go at the same speed as the present. The obvious solution:
It seems all right? I propose to run an exaggerated example and find what the error is - jsfiddle.net/kasheftin/a5sen/1 .
We'll deal with the tracks later, but for now we’ll optimize the drawing of markers. In google maps v2 and leaflet markers are drawn by divs. It is logical to assume that moving 100 divs is faster than 100 times to redraw canvases with objects. Especially if at the same time to optimize the calculations of coordinates.
There are two mechanisms for imposing your objects on google maps - using overlays ( overlays ) or using your own map type ( overlay map type ). For marvelous markers we will use the overlay. Create a div container, which we will put on top of the map, and in which we will add divs with icons of markers. In each frame of the animation, we will run through the array of markers, calculate the new coordinates and shift the divs.
In google maps there are several places where you can add your own elements. Overlays are recommended to add to one of the containers MapPanes . The controls (for example, your zoom scale or switches) are in MapControls . Accordingly, all the layers of MapPanes are “glued” to tile tiles of the map and move at the dredge. The controls are on top of the tiles and are fixed.
An idea arises - since every time a dam is overloaded, the overlay card needs to be returned back to the upper left corner, why not place it in a fixed layer of controls? This works (discussion on stackoverflow and a working example on jsfiddle ). The idea may even seem successful - as long as the application is not running on a slow android-like system. It turns out that the map is moving, and the markers do not have time and blunt in place. Everyone is accustomed to the fact that during a dredging, unloaded gray areas can come out, which are then filled with data (for example, they moved the map - and the track on the new area was drawn only after a second). But the desynchronization in the movement of the layers is invalid.
Since the markers are constantly in motion, it is logical to assume that they all redraw at once faster than moving one at a time. No observable or events emitter is needed, no need to follow when the marker changes its coordinates (it may happen more than once between frames). Instead, in each frame we will run over all the markers and re-draw them on one large canvas, which is superimposed over the map.
The author of this overlay is napa3um . He proposed the following optimization. Each time when the coordinates of a point change, its rectangular coordinates are calculated using the WGS84 Mercator projection formula. To avoid computations, you can calculate and store rectangular coordinates on the server, and send the computation results to the client.
There is no server in the test application, and therefore do not test the result of this optimization. To simulate the effect, I replaced the calculation of the projection with a simpler linear transformation (the geographical and rectangular coordinates of the map corners are known, and based on them the rectangular coordinates of any point are calculated as a linear proportion). In the application settings there is a checkbox "optimize geo calculations", which includes this method of calculation. On large zooms, the proportion lies, but on those zooms on which it is noticeable, paragliding races are not looking. However, the results show that any calculations are now happening very quickly, and the brakes occur at the drawing stage.
When using canvas, it is often necessary to solve the problem of handling mouse events on drawn objects. On Airtribune , both engines are used to handle paraglider clicks - the markers themselves are drawn on the canvas, and a divine overlay with empty divas lives above the canvas, which move synchronously to the markers and catch clicks.
This is just an illustration of what sprites, icons, texts and other small graphics should be cached. In a canvas engine, markers are drawn along with captions. Drawing text on canvas, especially with stroke (strokeText) is a very expensive operation. There is a setting that includes caching the icon with the text on a separate small canvas (the prepared image is then inserted into the overlay with the drawImage command). All other things being equal, on 100 markers, the performance of the cached and non-cached versions differs 15 times.
The server returns the position of the marker as an array of control points [[time, lat, lng], ..]. The track that needs to be drawn after the marker is broken down into constant and dynamic parts. The constant part of the track is a polyline connecting the control points with a time shorter than the current one. Dynamic is a segment from the last drawn control point to the current position of the marker (due to the smoothness of movement, the marker is almost always between some control points).

In the native and marvelous engines, tracks are drawn using the google.maps.Polyline object. There is a setting - use one polyline for the entire track or two (one for the dynamic part, the other for the static part). The longer the track, the more a single polyline loses split into two. This is due to the fact that in the first case in each frame you need to remove the last point from the track (the one that indicates the current position of the marker) and add it again.
Work with canvas recalls drawing with a pen on paper. You can finish the line pretty quickly, but in order to move it later, it is easier to take a new sheet and redraw everything anew. Drawing tracks fits well with this technology. The very essence of the track is that it is a trace behind the marker. The idea is that when adding a new link, you do not need to redraw the entire track again!
We use two canvases, one for the static part of the tracks, the other for the dynamic part. Dynamic is still redrawn once per frame. Static - only when the map shifts and the zoom changes. When you need to extend the track - just draw a new link to what is already drawn on the canvas. The speed of such tracks is high and does not depend on the length of the track. In fact, if it were not for the map shifts (and a few more cases when redrawing is needed), the coordinates of the track points could not have been remembered at all on the client.
Simplify.js is created as if specifically for this task, it is silly not to use it. On the default settings of the generator, the effect is not visible, but the real tracks are less reminiscent of Brownian motion. In this task, speed is more important than accuracy, so we use a fast radial algorithm.
All the described optimizations are now working on Aitribune . Examples of races - 1 , 2 . From the point of view of performance, the main thing that does not suit now is the brakes in the drawing when the map shifts, when everyone, even a small shift, causes a complete redrawing of all the tracks. To solve this problem, instead of overlaying, we will use our own map type with tiles. A tile is a square with a side of 256 pixels. When map shifts, the google maps engine completes new squares and removes old ones. All that is required of us is to write a method that should be called when the new square is completed:
Static pieces of tracks will be drawn on this layer, while the track is considered as a set of segments. Two options are possible:

Option 1: send new data, you need to complete the track. In this case, we run only on the new points of the track. For each new segment, you can very quickly get the number (a) of the square in which it is contained. We got the number of the square, rendered it (in the picture: we determine that of all existing tiles, the segment is in the squares (2,3) and (3,3), we draw on them).
Option 2: there was a shift of the map, as a result of which new tiles were initialized. In this case, you need to re-run through all the segments, but draw only those that fall into the new tiles. When adding a new tile, the drawing should not be started immediately, since tiles are usually added several times in rows or columns (in the picture: the map is shifted to the left, while the new column from the tiles is completed on the right, all existing segments need to be drawn on them).
The article ended unexpectedly. A rather narrow task of drawing tracks on a map was considered, however, some techniques can be applied in a wide area. Using the canvas overlay, you can draw any objects on the map (see example ). Own tile layer can also be used in many places. For example, in some tasks you can generate tiles with markers on the server, and transfer ready-made pictures to the client (see fusion tables ). Well, the very idea of the tracks is also common for any animation: less redraw - complete more.
The scales are as follows: there are ~ 200 trackers in a fairly limited area (50x50km), each transmitting data about its position every 10 seconds. It is necessary to draw them all on the map and smoothly move when the coordinates change. A track should be drawn behind each marker. The picture is about the following:
')
It soon became apparent that the built-in objects — google.maps.Marker and google.maps.Polyline — are too slow for this task. There was a lot of ideas for optimization, and as a result we got a solution on the canvas that works at a speed of 40fps even on a thousand markers. However, you can measure fps yourself - I assembled a test application for comparing 4 engines, in which you can plug in different chips on the fly and look at the speed of work.
Test application
kasheftin.imtqy.com/gmaps is a demo here, github.com/Kasheftin/gmaps is the source code here. Works in firefox and chrome, html + js. Used google maps api v3, knockout, require, underscore and bootstrap.
The settings are divided into two parts - in the right part is the coordinate generator. In addition to managing the number of markers there is little interesting. The generator emulates a real server, i.e. spits out data in chunks a minute ahead. Therefore, if the settings change, the changes are not immediately visible. Speed is the maximum value by which latitude or longitude can change in a second. Angle - the maximum angle at which the course can change. The probability of movement is the probability that data with the coordinates of the pilot will arrive at this second, and hold is the probability that the data will come the same (ie, the pilot will hang in one place). Between control points, the movement is considered uniform straight.
The most interesting is in the left column of settings. Here you can switch the engines, when you select the engine, checkboxes with its settings are displayed under it, and everything is connected on the fly on the same data set - this is done in order to adequately evaluate fps. The fps itself will be displayed if you click on the play button above the map. Fps is measured stupidly and practically - the requestAnimFrame method is used to play the animation - how many times it has time to work in a second, such and fps.
Native engine
This is a drawing using standard google maps. The first thing that comes to mind is to use google.maps.Marker to display the current position of the trackers and google.maps.Polyline to draw the tracks. The reason for the brakes during animation is object logic. Markers and lines are pictures on canvas, but we communicate with them as with objects. And it is expensive. Marker movements should be smooth. If at this point in time the marker has no coordinates, its instantaneous coordinates are calculated as a linear proportion between the existing coordinates before and after. This means that EVERY markers are shifted in each frame.
Suppose that 100 markers with random coordinates were created in the markers array. Consider the code:
var run = function() { for (var i = 0; i < markers.length; i++) markers[i].setPosition(getRandomCoords()); requestAnimFrame(run); } run(); The run function is roughly an animation frame. In each frame, each marker in turn moves to a new position using the very convenient setPosition method. It is about the following:
- Geographic coordinates are converted to rectangular and then pixel by WGS84.
- It is determined on which canvas tile there was a marker, and on which one it should jump now.
- Canvas is a bitmap, it does not have a vector structure. There is a complete redraw.
Retreat: problem-joke
Suppose there is a code that performs an action in a loop, and it is not known how long it takes (a classic example is the function requestAnimFrame). I want to know this time, add it to the timer and get some time to show in the player. It is natural to expect that the calculated time will go at the same speed as the present. The obvious solution:
var run = function() { // var startDt = (new Date).getTime(); // - , callback requestAnimFrame(function() { // , var currentDt = (new Date).getTime(); // , requestAnimFrame var diffDt = currentDt-startDt; // ourTimer += diffDt; }); // run(); } It seems all right? I propose to run an exaggerated example and find what the error is - jsfiddle.net/kasheftin/a5sen/1 .
Wonderful engine
We'll deal with the tracks later, but for now we’ll optimize the drawing of markers. In google maps v2 and leaflet markers are drawn by divs. It is logical to assume that moving 100 divs is faster than 100 times to redraw canvases with objects. Especially if at the same time to optimize the calculations of coordinates.
There are two mechanisms for imposing your objects on google maps - using overlays ( overlays ) or using your own map type ( overlay map type ). For marvelous markers we will use the overlay. Create a div container, which we will put on top of the map, and in which we will add divs with icons of markers. In each frame of the animation, we will run through the array of markers, calculate the new coordinates and shift the divs.
code with comments
var Overlay = function(map) { this._map = map; this.setMap(map); } // google.maps.OverlayView Overlay.prototype = new google.maps.OverlayView(); // Overlay.prototype.onAdd = function() { // - this._container = document.createElement("div"); this._container.style.position = "absolute"; // , , z-index- // floatPane - , this.getPanes().floatPane.appendChild(this._container); this.relayout(); } // - // , - - Overlay.prototype.relayout = function() { var bounds = this._map.getBounds(); // - - var corner = new google.maps.LatLng(bounds.getNorthEast().lat(),bounds.getSouthWest().lng()); // this.sqCorner = this._map.getProjection().fromLatLngToPoint(corner); // this.pxCorner = this.getProjection().fromLatLngToDivPixel(corner); // this._container.style.top = Math.floor(this.pxCorner.l)+"px"; this._container.style.left= Math.floor(this.pxCorner.t)+"px"; } // Overlay.prototype.appendChild = function(child) { this._container.appendChild(child); } var map = new google.maps.map(...); var overlay = new Overlay(map); Bad optimization
In google maps there are several places where you can add your own elements. Overlays are recommended to add to one of the containers MapPanes . The controls (for example, your zoom scale or switches) are in MapControls . Accordingly, all the layers of MapPanes are “glued” to tile tiles of the map and move at the dredge. The controls are on top of the tiles and are fixed.
An idea arises - since every time a dam is overloaded, the overlay card needs to be returned back to the upper left corner, why not place it in a fixed layer of controls? This works (discussion on stackoverflow and a working example on jsfiddle ). The idea may even seem successful - as long as the application is not running on a slow android-like system. It turns out that the map is moving, and the markers do not have time and blunt in place. Everyone is accustomed to the fact that during a dredging, unloaded gray areas can come out, which are then filled with data (for example, they moved the map - and the track on the new area was drawn only after a second). But the desynchronization in the movement of the layers is invalid.
Canvas engine
Since the markers are constantly in motion, it is logical to assume that they all redraw at once faster than moving one at a time. No observable or events emitter is needed, no need to follow when the marker changes its coordinates (it may happen more than once between frames). Instead, in each frame we will run over all the markers and re-draw them on one large canvas, which is superimposed over the map.
Code with comments
var Overlay = function(map) { this._map = map; this._mapDiv = this._map.getDiv(); this.setMap(map); } // google.maps.OverlayView Overlay.prototype = new google.maps.OverlayView(); // Overlay.prototype.onAdd = function() { // canvas- this._container = document.createElement("canvas"); this._canvas.style.position = "absolute"; this._container.style.pointerEvents = "none"; this._container.style.webkitTransform = "translate3d(0,0,0)"; this._container.style.imageRendering = "optimizeSpeed"; // , , z-index- // floatPane - , this.getPanes().floatPane.appendChild(this._canvas); this.relayout(); } // - // , - - Overlay.prototype.relayout = function() { var bounds = this._map.getBounds(); // - - var corner = new google.maps.LatLng(bounds.getNorthEast().lat(),bounds.getSouthWest().lng()); // this.sqCorner = this._map.getProjection().fromLatLngToPoint(corner); // this.pxCorner = this.getProjection().fromLatLngToDivPixel(corner); // this._container.style.top = Math.floor(this.pxCorner.l)+"px"; this._container.style.left= Math.floor(this.pxCorner.t)+"px"; // , , if (this._width != this._mapDiv.offsetWidth || this._height != this._mapDiv.offsetHeight) { this._width = this._mapDiv.offsetWidth; this._height = this._mapDiv.offsetHeight; this._container.width = w; this._container.height = h; } } The author of this overlay is napa3um . He proposed the following optimization. Each time when the coordinates of a point change, its rectangular coordinates are calculated using the WGS84 Mercator projection formula. To avoid computations, you can calculate and store rectangular coordinates on the server, and send the computation results to the client.
There is no server in the test application, and therefore do not test the result of this optimization. To simulate the effect, I replaced the calculation of the projection with a simpler linear transformation (the geographical and rectangular coordinates of the map corners are known, and based on them the rectangular coordinates of any point are calculated as a linear proportion). In the application settings there is a checkbox "optimize geo calculations", which includes this method of calculation. On large zooms, the proportion lies, but on those zooms on which it is noticeable, paragliding races are not looking. However, the results show that any calculations are now happening very quickly, and the brakes occur at the drawing stage.
When using canvas, it is often necessary to solve the problem of handling mouse events on drawn objects. On Airtribune , both engines are used to handle paraglider clicks - the markers themselves are drawn on the canvas, and a divine overlay with empty divas lives above the canvas, which move synchronously to the markers and catch clicks.
Caching icons
This is just an illustration of what sprites, icons, texts and other small graphics should be cached. In a canvas engine, markers are drawn along with captions. Drawing text on canvas, especially with stroke (strokeText) is a very expensive operation. There is a setting that includes caching the icon with the text on a separate small canvas (the prepared image is then inserted into the overlay with the drawImage command). All other things being equal, on 100 markers, the performance of the cached and non-cached versions differs 15 times.
Tracks
The server returns the position of the marker as an array of control points [[time, lat, lng], ..]. The track that needs to be drawn after the marker is broken down into constant and dynamic parts. The constant part of the track is a polyline connecting the control points with a time shorter than the current one. Dynamic is a segment from the last drawn control point to the current position of the marker (due to the smoothness of movement, the marker is almost always between some control points).
In the native and marvelous engines, tracks are drawn using the google.maps.Polyline object. There is a setting - use one polyline for the entire track or two (one for the dynamic part, the other for the static part). The longer the track, the more a single polyline loses split into two. This is due to the fact that in the first case in each frame you need to remove the last point from the track (the one that indicates the current position of the marker) and add it again.
Main feature
Work with canvas recalls drawing with a pen on paper. You can finish the line pretty quickly, but in order to move it later, it is easier to take a new sheet and redraw everything anew. Drawing tracks fits well with this technology. The very essence of the track is that it is a trace behind the marker. The idea is that when adding a new link, you do not need to redraw the entire track again!
We use two canvases, one for the static part of the tracks, the other for the dynamic part. Dynamic is still redrawn once per frame. Static - only when the map shifts and the zoom changes. When you need to extend the track - just draw a new link to what is already drawn on the canvas. The speed of such tracks is high and does not depend on the length of the track. In fact, if it were not for the map shifts (and a few more cases when redrawing is needed), the coordinates of the track points could not have been remembered at all on the client.
Simplify.js
Simplify.js is created as if specifically for this task, it is silly not to use it. On the default settings of the generator, the effect is not visible, but the real tracks are less reminiscent of Brownian motion. In this task, speed is more important than accuracy, so we use a fast radial algorithm.
Tile Tracks
All the described optimizations are now working on Aitribune . Examples of races - 1 , 2 . From the point of view of performance, the main thing that does not suit now is the brakes in the drawing when the map shifts, when everyone, even a small shift, causes a complete redrawing of all the tracks. To solve this problem, instead of overlaying, we will use our own map type with tiles. A tile is a square with a side of 256 pixels. When map shifts, the google maps engine completes new squares and removes old ones. All that is required of us is to write a method that should be called when the new square is completed:
Code with comments
var CanvasTileMapType = function() { } // CanvasTileMapType.prototype.tileSize = new google.maps.Size(256,256); // , // coord = {x:..,y:..} - x y // , {x: coord.x*256, y: coord.y*256} // , {x: coord.x*256/(1<<zoom), y: coord.y*256/(1<<zoom)}. CanvasTileMapType.prototype.getTile = function(coord,zoom,ownerDocument) { var tile = { coord: coord, zoom: zoom, size: this.tileSize.width, }; tile.canvas = ownerDocument.createElement("canvas"); tile.canvas.width = tile.size; tile.canvas.height = tile.size; tile.canvas.tile = tile; return tile.canvas; } var map = new google.maps.Map(...); // -- google maps var canvasTileMapType = new CanvasTileMapType; map.overlayMapTypes.push(canvasTileMapType); Static pieces of tracks will be drawn on this layer, while the track is considered as a set of segments. Two options are possible:
Option 1: send new data, you need to complete the track. In this case, we run only on the new points of the track. For each new segment, you can very quickly get the number (a) of the square in which it is contained. We got the number of the square, rendered it (in the picture: we determine that of all existing tiles, the segment is in the squares (2,3) and (3,3), we draw on them).
Option 2: there was a shift of the map, as a result of which new tiles were initialized. In this case, you need to re-run through all the segments, but draw only those that fall into the new tiles. When adding a new tile, the drawing should not be started immediately, since tiles are usually added several times in rows or columns (in the picture: the map is shifted to the left, while the new column from the tiles is completed on the right, all existing segments need to be drawn on them).
Conclusion
The article ended unexpectedly. A rather narrow task of drawing tracks on a map was considered, however, some techniques can be applied in a wide area. Using the canvas overlay, you can draw any objects on the map (see example ). Own tile layer can also be used in many places. For example, in some tasks you can generate tiles with markers on the server, and transfer ready-made pictures to the client (see fusion tables ). Well, the very idea of the tracks is also common for any animation: less redraw - complete more.
Source: https://habr.com/ru/post/195950/
All Articles