Automated test report generation
Introduction
It so happened that in our company we keep records of testing work in well-known GoogleDocs. Since I am engaged in such an account alone, this is an ideal option. Plus, there is still the opportunity to easily share the developments with colleagues and no need to worry about the relevance of the versions - everything is saved instantly.
These are the main reasons for the chosen job. But, as you know, any coin has two sides. The disadvantage of this approach is that large projects are difficult to process and produce sane test reports (test management systems are certainly suitable for this purpose).
Most recently, I ran into Google Script. This tool allows you to work with documents in the cloud much more efficiently. I decided that it would be suitable for the task of automated test reporting. And that's what happened.
Structure
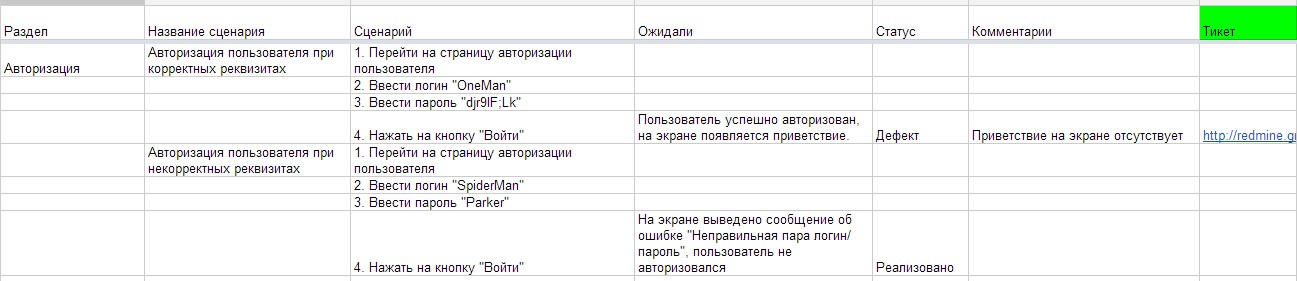
In a tabular document, I write descriptions of user scripts for testing applications. I do not pretend to a detailed description, but the most critical information is available there, namely: the section to which the script relates, the name of the script itself, the steps of the script, the status of the passed script, comments and a link to the page with a description of the error in the bug tracker. The set of statuses with us is usually limited to “Implemented”, “Defect”, “Postponed”. On some projects, others may be added, but not the essence. It looks like this:
')
Obviously, such scenarios are not convenient to keep on one page - it makes sense to split into several sheets (for example, by stages or releases).
Task
It is necessary to simplify the tester's life as much as possible when writing test reports. Ideal would be the option where you can see a summary of the sections and the project as a whole, as well as not only get a list of errors and links to them, but also look at the overall picture.
Decision
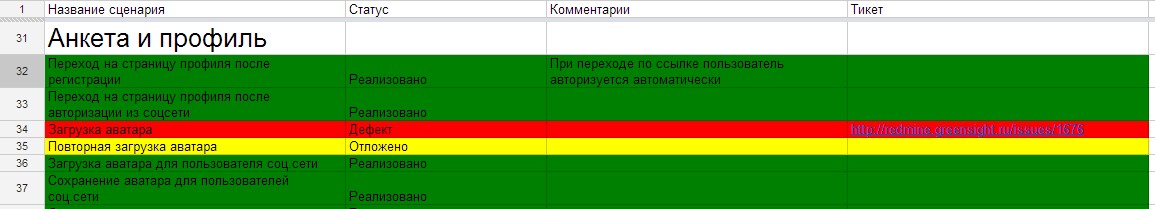
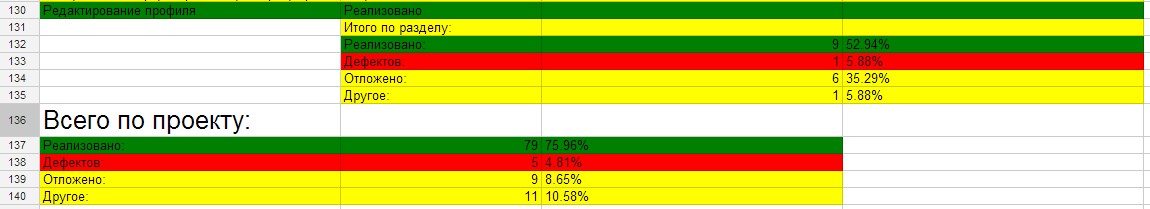
As a solution, I chose a table divided by sections. Each line corresponds to the test scenario and is colored in the appropriate color (red for defects, green for finished tasks, yellow for the rest). At the same time, statistics for each of the sections are summarized separately (how many errors, how many successful scenarios, how many others, the same as a percentage) and for the entire project as a whole.
This is the type of report for scripts:
Here's what happened for the statistics:
How to do it?
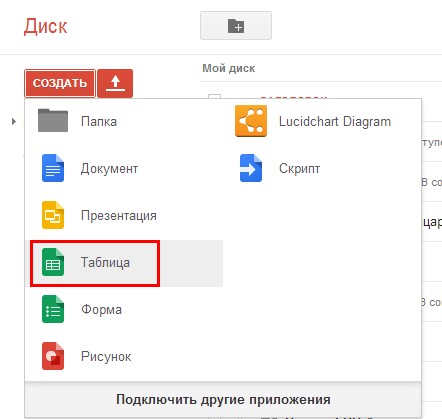
First we need to create a script inside the document. This is done in just a few minutes.
First you need to create a table on Google Drive.
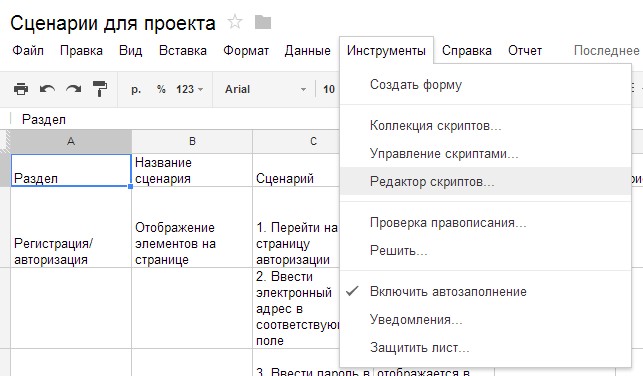
Then go to the "Tools" menu and select "Script Editor"
After that, select the menu item "Empty Project", erase the code and start writing your own.
First, let's write the onOpen function:
function onOpen() { var spreadsheet = SpreadsheetApp.getActive(); var menuItems = [ {name: ' ', functionName: 'generateReport_'} ]; spreadsheet.addMenu('', menuItems); } This will help us add a menu item to the toolbar:

Next, we write a function that will be called when this menu item is selected:
function generateReport_() { // var columns = ['', ' ', '', '', '']; // var reportColumns = [' ', '', '', '']; // var Data = getAllCases(columns); // CreateNewSheet(); // var stat = FormReport(Data, reportColumns); ShowStat(stat); } Well, now in order.
The function runs over all sheets of the open file and reads all the information for the report:
function getAllCases(columns) { var sheets = SpreadsheetApp.getActive().getSheets(); var data = new Array(); for (q=0; q<sheets.length; q++) { SpreadsheetApp.getActive().setActiveSheet(sheets[q]); data.push(getCases(columns)); } return data; } The function forms an array for output in a readable form. There is one feature here - if you swap fields on different sheets, then nothing terrible will happen. The parts array contains lists of sections by which scripts are grouped, and its elements are the name of the section and the list of scripts as an array:
function getCases(columns) { var range = SpreadsheetApp.getActiveSheet().getDataRange().getValues(); var fields = FindFields(range[0], columns); var parts = new Array(); for (i=1; i<range.length; i++) { if (range[i][fields[0]] != '') { parts.push(new Array()); parts[parts.length-1]['name'] = range[i][fields[0]]; parts[parts.length-1]['scen'] = new Array(); } if (range[i][fields[1]] != '') { var title = range[i][fields[1]]; } if (range[i][fields[2]] != '') { var scen = new Array(); scen.push(title); for (j=2; j<fields.length; j++) { scen.push(range[i][fields[j]]); } parts[parts.length-1]['scen'].push(scen); } } return parts; } Actually, this is a function, due to which it is not so scary to confuse the columns on the script pages:
function FindFields (data, columns) { var fields = new Array(); for (i=0; i<columns.length; i++) { for (j=0; j<data.length; j++) { if (columns[i] == data[j]) fields.push(j); } } return fields; } To create a new sheet with a report:
function CreateNewSheet() { SpreadsheetApp.getActive().insertSheet(''); SpreadsheetApp.setActiveSheet(SpreadsheetApp.getActive().getSheetByName('')); } Formation of the report itself, the collection of statistics and some design:
function FormReport(data, columns) { var doc = SpreadsheetApp.getActive(); var stat = [0, 0, 0, 0]; doc.appendRow(columns); doc.setColumnWidth(1, 300); doc.setColumnWidth(2, 200); doc.setColumnWidth(3, 300); doc.setColumnWidth(4, 300); for (i=0; i<data.length; i++) { for (j=0; j<data[i].length; j++) { var temp = WritePart(data[i][j], columns); stat[0] += +temp[0]; stat[1] += +temp[1]; stat[2] += +temp[2]; stat[3] += +temp[3]; } } return stat; } The function of outputting information on a single section to a report and generating statistics on it, as well as a design for a more pleasant reading:
function WritePart(data, columns) { SpreadsheetApp.getActive().appendRow([data['name']]).set; var line = SpreadsheetApp.getActive().getLastRow(); SpreadsheetApp.getActive().getRange("A"+line).setFontSize(20); var defects = 0; var done = 0; var skipped = 0; var other = 0; for (k=0; k<data['scen'].length; k++) { SpreadsheetApp.getActive().appendRow(data['scen'][k]); var line = SpreadsheetApp.getActive().getLastRow(); switch (data['scen'][k][1]) { case '': defects++; SpreadsheetApp.getActive().getRange("A"+line+":D"+line).setBackground('red'); break; case '': done++; SpreadsheetApp.getActive().getRange("A"+line+":D"+line).setBackground('green'); break; case '': skipped++; SpreadsheetApp.getActive().getRange("A"+line+":D"+line).setBackground('yellow'); break; default: other++; SpreadsheetApp.getActive().getRange("A"+line+":D"+line).setBackground('yellow'); } } SpreadsheetApp.getActive().appendRow(['', ' :']); SpreadsheetApp.getActive().appendRow(['', ':', done, (done/(done+defects+skipped+other)*100).toFixed(2) + "%"]); line = SpreadsheetApp.getActive().getLastRow(); SpreadsheetApp.getActive().getRange("B"+line+":D"+line).setBackground('green'); SpreadsheetApp.getActive().appendRow(['', ':', defects, (defects/(done+defects+skipped+other)*100).toFixed(2) + "%"]); line = SpreadsheetApp.getActive().getLastRow(); SpreadsheetApp.getActive().getRange("B"+line+":D"+line).setBackground('red'); SpreadsheetApp.getActive().appendRow(['', ':', skipped, (skipped/(done+defects+skipped+other)*100).toFixed(2) + "%"]); line = SpreadsheetApp.getActive().getLastRow(); SpreadsheetApp.getActive().getRange("B"+line+":D"+line).setBackground('yellow'); SpreadsheetApp.getActive().appendRow(['', ':', other, (other/(done+defects+skipped+other)*100).toFixed(2) + "%"]); line = SpreadsheetApp.getActive().getLastRow(); SpreadsheetApp.getActive().getRange("B"+line+":D"+line).setBackground('yellow'); var stat = [defects, done, skipped, other]; return stat; } And finally, the final statistics and a lot of design:
function ShowStat(stat) { SpreadsheetApp.getActive().appendRow([' :']); var line = SpreadsheetApp.getActive().getLastRow(); SpreadsheetApp.getActive().getRange("A"+line).setFontSize(20); SpreadsheetApp.getActive().appendRow([':', stat[1], (stat[1]/(stat[0]+stat[1]+stat[2]+stat[3])*100).toFixed(2) + "%"]); line = SpreadsheetApp.getActive().getLastRow(); SpreadsheetApp.getActive().getRange("A"+line+":C"+line).setBackground('green'); SpreadsheetApp.getActive().appendRow([':', stat[0], (stat[0]/(stat[0]+stat[1]+stat[2]+stat[3])*100).toFixed(2) + "%"]); line = SpreadsheetApp.getActive().getLastRow(); SpreadsheetApp.getActive().getRange("A"+line+":C"+line).setBackground('red'); SpreadsheetApp.getActive().appendRow([':', stat[2], (stat[2]/(stat[0]+stat[1]+stat[2]+stat[3])*100).toFixed(2) + "%"]); line = SpreadsheetApp.getActive().getLastRow(); SpreadsheetApp.getActive().getRange("A"+line+":C"+line).setBackground('yellow'); SpreadsheetApp.getActive().appendRow([':', stat[3], (stat[3]/(stat[0]+stat[1]+stat[2]+stat[3])*100).toFixed(2) + "%"]); line = SpreadsheetApp.getActive().getLastRow(); SpreadsheetApp.getActive().getRange("A"+line+":C"+line).setBackground('yellow'); } For a full build, you need all these functions in any sequence in the script file.
The code is not perfect - there is something to work on, but if it is useful to someone, I will be happy to answer questions.
Conclusion
I gave one example of using scripts from Google. We have to admit that it is quite a powerful tool for working with documents. At least he coped well with this task. There are more examples of the use of scripts to help in the work, for example, this is an interesting article . Apparently, Google Script can be a great helper in the everyday life of IT’s.
Source: https://habr.com/ru/post/195820/
All Articles