We hunt for memory leaks in Node.js (1st of 12 articles on Node.js from the Mozilla Identity team)
 From the translator: This is the first article from the cycle about Node.js from the Mozilla Identity team that deals with the Persona project. Both the client and server parts of Persona are written in JavaScript. During the work, the project team created several tools for all occasions - from localization to debugging, dependency management, and more. In this series of articles, Mozilla developers share their experience and these tools with the community, which will be useful to anyone who writes a high-load service on Node.js.
 The first article in the series is devoted to the common Node.js problem - memory leaks, features of leaks in high-load projects, and the node-memwatch library, which helps to find and fix such leaks in Node.
All articles of the cycle:
- " Hunting for memory leaks in Node.js "
- "We load Node to the eyeballs "
- " Store the session on the client to simplify application scaling "
- " Frontend performance. Part 1 - concatenation, compression, caching "
- " We write a server that does not fall under load "
- " Frontend performance. Part 2 - we cache dynamic content using etagify "
- " Taming Web Application Configurations with node-convict "
- " Frontend performance. Part 3 - font optimization "
- " Localization of Node.js Applications. Part 1 "
- " Localization of Node.js Applications. Part 2: Toolkit and Process "
- " Localization of Node.js Applications. Part 3: Localization in Action "
- " Awsbox - PaaS infrastructure for deploying Node.js applications in the Amazon cloud "
Why bother?
You may ask, why monitor memory leaks at all? Are there no more important things? Why not just restart the process from time to time, or just add memory to the server? There are three reasons why it is important to fix leaks:
')
- You may not be too worried about memory leaks, but this is not the case with V8 (the JavaScript engine that runs Node). The more memory is occupied, the more actively the garbage collector works, slowing down your application. So node leaks directly hurt performance.
- Leaks can lead to other problems. Leaking code can block limited resources. You may run out of file descriptors, or you suddenly will not be able to open another database connection. Such problems may occur long before the memory runs out, but will bring down your application no worse.
- Sooner or later your application will fall. And this is sure to happen during the influx of visitors. Everybody will laugh at you and write bad things about you on Hacker News.
Where does the sound of falling drops come from?
In a complex application there are many places where leaks can occur. Probably the most famous and most painful place - the circuit. Since closures can store references to variables from their scope for a long time, they become the most frequent leakage site.
Some leaks can be detected sooner or later simply by looking for them in the code, but in the asynchronous world of Node, we constantly create many closures in the form of callbacks. And if they work slower than they are created, the memory fragments of each callback are piled up so that the code that does not look current at all behaves like the current one. Such leaks are much more difficult to track down.
An application may also flow due to an error in someone else's code on which it depends. Sometimes you can find a place in your program that causes a leak, but it happens that you just have to look bewildered at your perfectly debugged code, wondering how it can flow at all?
It is such difficult to track leakage that created the need for node-memwatch. Legend has it that a long time ago, a few months ago, our programmer Lloyd Hilayel locked himself in a closet for two days trying to track down a leak that manifested itself only under a very large load (by the way, he is the author of the next article in this series devoted to load testing. ).
After two days of searching, he discovered that the required error was in the Node core: the event handlers in
http.ClientRequest did not free the memory properly (the patch for correcting this error added only two small, but very important characters to the Node.js code). The agony caused Lloyd to write a tool that would help find such leaks.Leak detection tools
Node.js applications already have a good and ever-growing selection of tools to search for leaks. Here are some of them:
- Jimba Esser's node-mtrace , which uses the GCC mtrace utility to profile heap usage;
- Dave Pacheco's node-heap-dump , which takes a snapshot of the V8 heap and writes it into a huge JSON file. Includes tools for exploring and parsing this image with JavaScript;
- v8-profiler and node-inspector Danny Coates, based on the V8 profiler and the WebKit Web Inspector debugger;
- Felix Heisendorfer's Node memory leak guide , which briefly and clearly describes the basics of working with v8-profiler and node-inspector;
- Joyent SmartOS platform, which provides a whole arsenal of tools for finding and fixing leaks in Node.js.
We like these and many other tools, but none of them were perfect for our environment. Web Inspector is great for applications in development, but difficult to use in a combat, running application, especially when many servers and processes are used. Therefore, using it is difficult to catch errors that do not appear immediately and only under a large load. Tools like dtrace or libumem are great too, but they don’t work in all operating systems.
Meet: node-memwatch
We needed a cross-platform debugging library that did not require any additional tools, with which we could find places and causes of memory leaks. And so we wrote node-memwatch .
It provides three things:
- Event
'leak'memwatch.on('leak', function(info) { // info, , }); - Event
'stats'var memwatch = require('memwatch'); memwatch.on('stats', function(stats) { // }); - Heap diff tracking class:
var hd = new memwatch.HeapDiff(); // ... var diff = hd.end();
In addition, there is a function to force a call to the garbage collector, which can be useful when testing. That is, after all, four things, not three.
var stats = memwatch.gc(); memwatch.on ('stats', ...): heap statistics after garbage collection
A node-memwatch can issue heap usage statistics immediately after the garbage collector finishes, before memory is allocated to any new objects. To do this, use the hook
V8::AddGCEpilogueCallback .The statistics include fields:
- usage_trend
- current_base
- estimated_base
- num_full_gc
- num_inc_gc
- heap_compactions
- min
- max
Here is an example that shows how the change in memory usage statistics for a leaking application looks. The zigzag green line shows the memory usage according to the
process.memoryUsage() data, and the red one shows the current_base value from the node-memwatch statistics. Below left are additional data.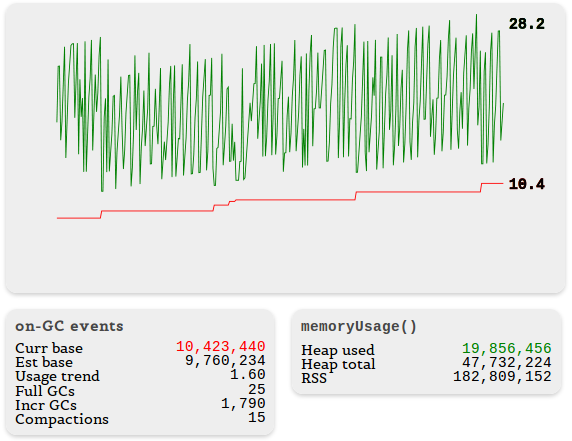
Notice how often incremental garbage collection occurs. This is an alarming sign, indicating that the V8 has to sweat, clearing the memory.
memwatch.on ('leak', ...): memory usage dynamics
We use simple heuristics to warn of potential leaks. If after five garbage collections in a row memory usage grows, a 'leak' event is triggered. Information about a possible leak is displayed in a convenient, readable form:
{ start: Fri, 29 Jun 2012 14:12:13 GMT, end: Fri, 29 Jun 2012 14:12:33 GMT, growth: 67984, reason: 'heap growth over 5 consecutive GCs (20s) - 11.67 mb/hr' } memwatch.HeapDiff (): find leaks
Finally, node-memwatch can compare heap snapshots, including the names of the number of objects that take up memory. Diff helps to find violators.
var hd = new memwatch.HeapDiff(); // ... var diff = hd.end(); The contents of the
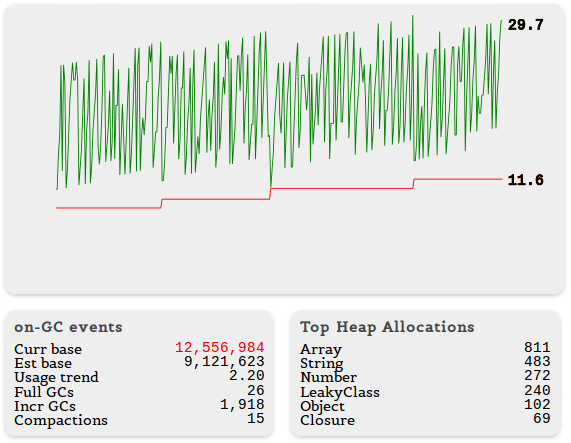
diff object look like this: { "before": { "nodes": 11625, "size_bytes": 1869904, "size": "1.78 mb" }, "after": { "nodes": 21435, "size_bytes": 2119136, "size": "2.02 mb" }, "change": { "size_bytes": 249232, "size": "243.39 kb", "freed_nodes": 197, "allocated_nodes": 10007, "details": [ { "what": "Array", "size_bytes": 66688, "size": "65.13 kb", "+": 4, "-": 78 }, { "what": "Code", "size_bytes": -55296, "size": "-54 kb", "+": 1, "-": 57 }, { "what": "LeakingClass", "size_bytes": 239952, "size": "234.33 kb", "+": 9998, "-": 0 }, { "what": "String", "size_bytes": -2120, "size": "-2.07 kb", "+": 3, "-": 62 } ] } } HeapDiff calls the garbage collector before collecting statistics so that the data do not have too much unnecessary rubbish. However, the 'stats' event does not occur, so you can safely call HeapDiff inside the 'stats' handler.Here is an example of statistics to which we added a list of objects occupying the most space in the heap.
What's next?
Node-memwatch features:
- accurate tracking of memory usage;
- possible leak notifications;
- means to get a heap diff;
- cross-platform;
- no dependencies on other tools.
We want more. In particular, we want node-memwatch to be able to give specific data of flowing objects — variable names, array indices, pieces of closure code.
We hope that the node-memwatch will be useful to you when debugging the leaking Node.js applications, you will forc it and take part in its improvement.
All articles of the cycle:
- " Hunting for memory leaks in Node.js "
- "We load Node to the eyeballs "
- " Store the session on the client to simplify application scaling "
- " Frontend performance. Part 1 - concatenation, compression, caching "
- " We write a server that does not fall under load "
- " Frontend performance. Part 2 - we cache dynamic content using etagify "
- " Taming Web Application Configurations with node-convict "
- " Frontend performance. Part 3 - font optimization "
- " Localization of Node.js Applications. Part 1 "
- " Localization of Node.js Applications. Part 2: Toolkit and Process "
- " Localization of Node.js Applications. Part 3: Localization in Action "
- " Awsbox - PaaS infrastructure for deploying Node.js applications in the Amazon cloud "
Source: https://habr.com/ru/post/195494/
All Articles