How to find and fix memory leaks using the example of Yandex.Mail
At first glance, the words JavaScript and memory leaks cannot stand nearby. Real memory leaks in JS, of course, can not be, because the process of garbage collection occurs automatically and can not be controlled from our code. It is impossible to allocate memory for an object and forget to free it. But there may be situations associated with errors in the logic of the application, which lead to memory leaks of a different kind. For example, zabindili handler, in which we do something with the methods of the common object and forget it anbind. Or send a letter with a large body and do not clear the body even after sending.

We at Yandex.Mail, a complex and massive project, have gained considerable experience in finding and fixing such leaks, and we want to share them.
As we know, in JS there are objects and primitives. Properties of objects can refer to other objects, or contain primitives. JSHeap is just a graph of related objects. The root of this graph is usually a global object (GC Roots). The nodes in this graph have two types of sizes: shallow size and retained size. Shallow size - the net amount of memory occupied by the object. Retained size - this is the total amount of memory that will be released during garbage collection, if you delete the object and all references to it from the root of the graph. You should look at shallow size only for arrays or primitives (which actually have retained size === shallow size). The path along which an object can be obtained from the root of a graph is called the retaining path. Objects for which it is impossible to obtain the retaining path are garbage and are deleted the next time it is assembled.
')
Here the situation is even worse than rendering profiling. Normal tools are available only in browsers on Chrome Developer Tools and in the future IE 11. I will use Chrome Developer Tools .
Yet again:
In general, for this you can try to poligate information from
For all the others, these values either do not change with time or are equal to zero. Therefore, I decided to look for leaks manually. To determine when there is a possibility of a memory leak, we will use the timeline panel in Chrome Developer Tools, and more specifically the Memory mode:

Open the test site (in my case, mail.yandex.ru) and start recording (Cmd + E). Next several times we perform an action that, in our opinion, can lead to a memory leak. I simply clicked on “Check” in the toolbar. During recording, we get something like this:

It is important to pay attention to the graph in the uppermost panel and the graph with statistics in the “counters” panel. In the upper graph, we can see how memory is allocated and, in fact, the size of JSHeap at different points in time. In general, growth with gorochka is normal, because there has not yet been garbage collection. It will be over time, and then the value of the occupied memory should return to normal (in our case - 8.4 MB). You can not wait for the GC and force the garbage collection if you click on the bucket in the lower left. There are three indicators in the “counters” panel:
And there is a graph of changes in these indicators for the above period of time. These indicators are important because they are not counted on the memory occupied graph at the top. So, if after the garbage collection the hill does not fall to the baseline, or the figures in the Counters panel do not return to the previous ones, then we found a case that leads to a leak.
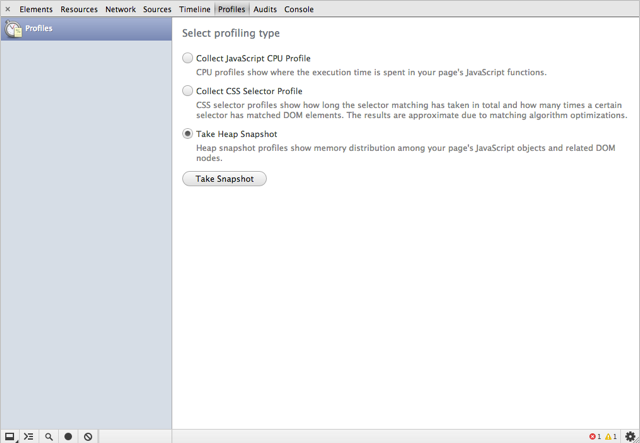
Ok, we found a sequence of actions that leads to a leak. To find the cause of the leak, use the Profiles panel and the Take Heap Snapshot item in it.
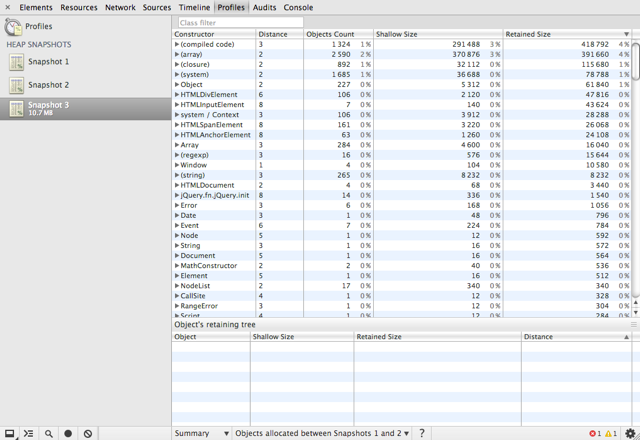
By clicking on the Take Snapshot button, you can get the JSHeap snapshot at the moment:

In the left column, under the name of snapshot (we have Snapshot 1), the total size of the memory occupied by living objects is indicated - those that have a retaining path. Only alive, because after each click on this button, the first thing is called the garbage collector. In the panel that occupies the main part of the right part of the screenshot, you can view the objects themselves, the size of the memory they occupy (absolute values in bytes or a percentage of the total snapshot size) and other useful information. By default, objects in this panel are shown in Summary mode, where they are grouped by the name of their constructor. Distance column - the number of links to this object from the root (GC Roots). Objects Count - the number of objects with this constructor.
If the name of the constructor is in parentheses, then this is an internal type of object or a primitive (with the exception of array). In principle, most objects with a constructor in brackets can be ignored ("(compiled code)", "(closure)", "(system)"), except, perhaps, "(string)" and "(array) "- and that only if they have a large shallow size. You can submit snapshot contents in other modes:
In Summary mode, for convenience, you can filter objects by the name of the constructor through the search bar at the top. If you select an object from the group, below you can see the retaining path in the form of a tree:

Gray indicates aydishniki objects. If the object is highlighted in yellow, then somewhere there is a link to it, which keeps it from garbage collection. If the object is highlighted in red - this is a DOM node that has been tampered with, but a reference from JS remains on it. You can hover over many objects with the mouse and additional information will appear in the yellow bubble (this is especially useful for functions and DOM nodes, because for them you can find out the function body and attributes of the node).
We have a case in which we noticed a leak on the timeline:
To find objects that are not deleted, we will use the technique of three snapshots. I will do this on the developer version of mail, in order to have non-focused property names and variables.
So we got all the leaked objects. Sort the results by the Objects Count column:
In the top after objects with system constructors and arrays of cached emails, we see some suspicious divs, spans, links and input. And there are exactly 7 of them - just as many times I clicked on the “Check” button. If we expand the HTMLInputElement, then we will see that all 7 objects are envelopes with the
The screenshot is not visible, but to find out the class, I just hover the cursor on one of the inputs. By retaining path, you can quickly understand that this is an input from the dropdown (the first HTMLDivElement has the
To fix this, first we find references to
We do the same in labels-actions. After checking all the divas, links and links from the dropdown disappear. And with the loader in the toolbar, everything is a little different. In "neo2 / js / components / loader.js" there is such code:
It is in a self-invoking function. When we need to add a loader to the toolbar, we call Jane.Loader.createToolbarLoader. He clones $ toolbarSpinner and inserts a clone into DOM. As you can already guess, $ toolbarSpinner itself remains pointed and is never cleared. This can be corrected if instead of cloning it is just to re-create the spinner element.
Similarly, I fixed a few more leaks (on the letter writing page, a couple in the three-pane interface, when viewing the letter, one in the settings). I also deleted Jane.Page.Log, which saved the parameters for every wound or action call, but didn’t do anything with them. And limited the number of entries in the Logger xiva object. This is all because when sending letters there objects were added with all the parameters of the letter being sent (if a letter with a large body is a potential leak). I also began to remove the body from the parameters after sending the letter.
To make it easier to find leaks, Chromium, starting from version 29, introduced an additional item in the Profiles panel - “Record Heap Allocations”. When you click on Start, it starts to take snapshots once every N seconds and compare it with the previous one, and in the top panel show the ratio of the cleaned objects to the live ones. Live - blue, peeled - gray. After stopping the recording, you can select any time interval and in the bottom panel look at the objects in the usual way (as after Take Snapshot).

We at Yandex.Mail, a complex and massive project, have gained considerable experience in finding and fixing such leaks, and we want to share them.
Little materiel
As we know, in JS there are objects and primitives. Properties of objects can refer to other objects, or contain primitives. JSHeap is just a graph of related objects. The root of this graph is usually a global object (GC Roots). The nodes in this graph have two types of sizes: shallow size and retained size. Shallow size - the net amount of memory occupied by the object. Retained size - this is the total amount of memory that will be released during garbage collection, if you delete the object and all references to it from the root of the graph. You should look at shallow size only for arrays or primitives (which actually have retained size === shallow size). The path along which an object can be obtained from the root of a graph is called the retaining path. Objects for which it is impossible to obtain the retaining path are garbage and are deleted the next time it is assembled.
')
Instruments
Here the situation is even worse than rendering profiling. Normal tools are available only in browsers on Chrome Developer Tools and in the future IE 11. I will use Chrome Developer Tools .
Profiling conditions
Yet again:
- you should not run other programs;
- Chromium should be run with default settings (if you use any experimental features, reset them to default on the chrome page: // flags);
- only one tab should be left open with the test site (this limitation is due to the fact that Chromium can render several tabs in one process, and, accordingly, there will be extra objects in the profiling results)
- no plugins should be installed (or they should be turned off). It is best to profile in private mode or launch the Chromium with a separate profile via:
< > --user-data-dir=< , >.
We define cases in which there can be leaks
In general, for this you can try to poligate information from
window.performance.memory (only in Chromium> 22) and see what actions were performed by users for whom usedJSHeapSize (size of used memory) approaches totalJSHeapSize (total size of JS memory allocated to the process) , or just a big number in totalJSHeapSize . But it seems to me that this thing shows incorrect numbers, because after logging we only have 5% of users, after 7+ hours of using mail, totalJSHeapSize approaches 100 MB.For all the others, these values either do not change with time or are equal to zero. Therefore, I decided to look for leaks manually. To determine when there is a possibility of a memory leak, we will use the timeline panel in Chrome Developer Tools, and more specifically the Memory mode:
Open the test site (in my case, mail.yandex.ru) and start recording (Cmd + E). Next several times we perform an action that, in our opinion, can lead to a memory leak. I simply clicked on “Check” in the toolbar. During recording, we get something like this:
It is important to pay attention to the graph in the uppermost panel and the graph with statistics in the “counters” panel. In the upper graph, we can see how memory is allocated and, in fact, the size of JSHeap at different points in time. In general, growth with gorochka is normal, because there has not yet been garbage collection. It will be over time, and then the value of the occupied memory should return to normal (in our case - 8.4 MB). You can not wait for the GC and force the garbage collection if you click on the bucket in the lower left. There are three indicators in the “counters” panel:
- Document Count - the number of html documents (this includes frames);
- DOM Node Count - the number of DOM nodes;
- Event Listener Count - the number of event handlers,
And there is a graph of changes in these indicators for the above period of time. These indicators are important because they are not counted on the memory occupied graph at the top. So, if after the garbage collection the hill does not fall to the baseline, or the figures in the Counters panel do not return to the previous ones, then we found a case that leads to a leak.
Find the cause of the leak
Ok, we found a sequence of actions that leads to a leak. To find the cause of the leak, use the Profiles panel and the Take Heap Snapshot item in it.
By clicking on the Take Snapshot button, you can get the JSHeap snapshot at the moment:
In the left column, under the name of snapshot (we have Snapshot 1), the total size of the memory occupied by living objects is indicated - those that have a retaining path. Only alive, because after each click on this button, the first thing is called the garbage collector. In the panel that occupies the main part of the right part of the screenshot, you can view the objects themselves, the size of the memory they occupy (absolute values in bytes or a percentage of the total snapshot size) and other useful information. By default, objects in this panel are shown in Summary mode, where they are grouped by the name of their constructor. Distance column - the number of links to this object from the root (GC Roots). Objects Count - the number of objects with this constructor.
If the name of the constructor is in parentheses, then this is an internal type of object or a primitive (with the exception of array). In principle, most objects with a constructor in brackets can be ignored ("(compiled code)", "(closure)", "(system)"), except, perhaps, "(string)" and "(array) "- and that only if they have a large shallow size. You can submit snapshot contents in other modes:
- Comparison - compares two snapshots and shows only those objects that have changed.
- Containment - shows the entire graph as a tree with global objects. Convenient for detecting unused DOM tree (Detached DOM tree).
- Dominators - Shows the dominators (objects that are in as many of the retaining paths as possible).
In Summary mode, for convenience, you can filter objects by the name of the constructor through the search bar at the top. If you select an object from the group, below you can see the retaining path in the form of a tree:
Gray indicates aydishniki objects. If the object is highlighted in yellow, then somewhere there is a link to it, which keeps it from garbage collection. If the object is highlighted in red - this is a DOM node that has been tampered with, but a reference from JS remains on it. You can hover over many objects with the mouse and additional information will appear in the yellow bubble (this is especially useful for functions and DOM nodes, because for them you can find out the function body and attributes of the node).
Technique three snapshots
We have a case in which we noticed a leak on the timeline:
- Go to inbox.
- Scroll a little scroll so that a fixed toolbar appears.
- Click on “Check” several times.
To find objects that are not deleted, we will use the technique of three snapshots. I will do this on the developer version of mail, in order to have non-focused property names and variables.
- We make the first snapshot before the actions from the case (it is needed for the baseline). Sometimes in front of him you also need to perform some warm-up actions. For example, if we have a case connected with the page of writing a letter, then we must first go to it (so that all the necessary modules are loaded and executed).
- We repeat the actions from the case several times (it is better to repeat an odd number of times so that it is easier to determine the current objects when analyzing snapshots) and do a second snapshot.
- We repeat the same actions again the same time and make the third snapshot.
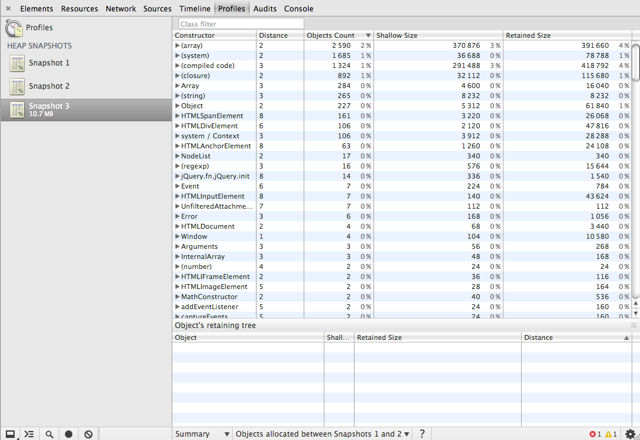
- Next, select the third snapshot and in the Summary mode in the select below select “Objects allocated between Snapshots 1 and 2” (or 2 and 3 - whatever you like).
So we got all the leaked objects. Sort the results by the Objects Count column:
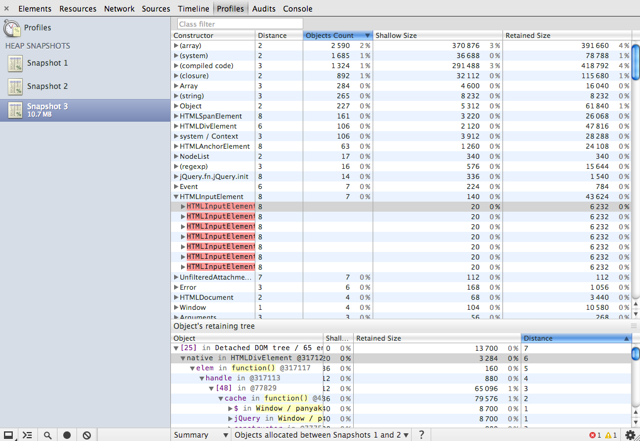
In the top after objects with system constructors and arrays of cached emails, we see some suspicious divs, spans, links and input. And there are exactly 7 of them - just as many times I clicked on the “Check” button. If we expand the HTMLInputElement, then we will see that all 7 objects are envelopes with the
b-mail-dropdown__search__input class, to which there are just links in JS:The screenshot is not visible, but to find out the class, I just hover the cursor on one of the inputs. By retaining path, you can quickly understand that this is an input from the dropdown (the first HTMLDivElement has the
b-mail-dropdown class), which in turn is referenced in the event handler (you can understand by the standard jQuery structure $ - cache - [. .] - handle - elem - our element). There is still a problem with the loader in the toolbar - the div with the loader is not cleared after garbage collection.Fix leak
To fix this, first we find references to
b-mail-dropdown__search__input in the JS code of our project. We find in two files “mail / blocks / folders-actions / folders-actions.js” and “blocks / labels-actions / labels-actions.js”. Aha, those popap with filters of folders and tags. In folders-actions there is a document handler for b-mail-dropdown-disabled , which internally refers to a jquery dropdown object. There is also a Jane.event action-move-status.change in the handler of which the _toggle method is called, which inside also refers to the jquery-object of the dropdown. To get rid of the leak, simply enbind these handlers in onhtmldestroy and fill in the references to this.$searchInput and this.$dropdown : Block.FoldersActions.prototype.onhtmldestroy = function() { $(document).off('click.newFolderClick') .off('b-mail-dropdown-disabled', this._dropdownHideHandler); Jane.events.unbind('action-move-status.change', this._moveStatusHandler); if (this.$searchInput) { this.$searchInput.off(); this.$searchInput = null; } if (this.$dropdown) { this.$dropdown.off(); this.$dropdown = null; } }; We do the same in labels-actions. After checking all the divas, links and links from the dropdown disappear. And with the loader in the toolbar, everything is a little different. In "neo2 / js / components / loader.js" there is such code:
var $toolbarSpinner = $('<div class="b-toolbar__spinner"/>'); var toolbarLoaderActive = false; Jane.Loader.createToolbarLoader = function(actionOpts, toolbarNode) { var $spinner = $toolbarSpinner.clone(); var $toolbarBtn = $(actionOpts.event && actionOpts.event.currentTarget); ... } It is in a self-invoking function. When we need to add a loader to the toolbar, we call Jane.Loader.createToolbarLoader. He clones $ toolbarSpinner and inserts a clone into DOM. As you can already guess, $ toolbarSpinner itself remains pointed and is never cleared. This can be corrected if instead of cloning it is just to re-create the spinner element.
Similarly, I fixed a few more leaks (on the letter writing page, a couple in the three-pane interface, when viewing the letter, one in the settings). I also deleted Jane.Page.Log, which saved the parameters for every wound or action call, but didn’t do anything with them. And limited the number of entries in the Logger xiva object. This is all because when sending letters there objects were added with all the parameters of the letter being sent (if a letter with a large body is a potential leak). I also began to remove the body from the parameters after sending the letter.
Record Heap Allocations
To make it easier to find leaks, Chromium, starting from version 29, introduced an additional item in the Profiles panel - “Record Heap Allocations”. When you click on Start, it starts to take snapshots once every N seconds and compare it with the previous one, and in the top panel show the ratio of the cleaned objects to the live ones. Live - blue, peeled - gray. After stopping the recording, you can select any time interval and in the bottom panel look at the objects in the usual way (as after Take Snapshot).
Useful resources
- developers.google.com/chrome-developer-tools/docs/memory-analysis-101
- developers.google.com/chrome-developer-tools/docs/heap-profiling
- addyosmani.com/blog/taming-the-unicorn-easing-javascript-memory-profiling-in-devtools
- coding.smashingmagazine.com/2012/11/05/writing-fast-memory-efficient-javascript
- www.html5rocks.com/en/tutorials/memory/effectivemanagement
- www.html5rocks.com/en/tutorials/speed/static-mem-pools
Source: https://habr.com/ru/post/195198/
All Articles