Intel® Parallel Studio XE 2013 Service Pack 1 - what's new?
The Intel Parallel Studio XE package has long been known to developers, including by publishing on the Intel Habré blog. Recently there was an update - Intel Parallel Studio XE 2013 Service Pack 1 (SP1) , which has a number of interesting innovations. It becomes easier to program for co-processors and integrated graphics, largely due to the support of the OpenMP 4.0 standard (partial). The search for errors has become more flexible, memory leaks are now detected before the process is completed, i.e. You can search for them in long-playing services and "falling" applications. Finding bottlenecks in performance will be easier thanks to a new view of the call tree, an assessment of overhead costs and detailed information on parallel structures.
Intel Composer XE combines C / C ++ and Fortran compilers, multithreaded, mathematical and other libraries. In Intel Composer XE 2013 SP1, many improvements have appeared, here we will dwell on the possibilities of vectorization and the use of co-processors and accelerators, which appeared in the OpenMP * 4.0 standard.
OpenMP * SIMD Design
Using SIMD (Single Instruction Multiple Data) instructions, or vectorization, allows you to implement data parallelism. This is one of the most effective ways to optimize software performance. The Intel compiler is doing everything possible to vectorize the code automatically, but this is not always possible if, for example, it suspects the possibility of dependencies. The OpenMP 4.0 standard allows you to explicitly tell the compiler that there are no dependencies and you can vectorize using the “#pragma omp simd” construct (there is an analogue for Fortran). If the cycle is preceded by “omp simd”, the compiler must generate vector instructions that can process several iterations simultaneously. Additional constructions can be used, for example, for “reduction”:
')
double pi() { double pi = 0.0; double t; #pragma omp simd private(t) reduction(+:pi) for (i=0; i<count; i++) { t = (double)((i+0.5)/count); pi += 4.0/(1.0+t*t); } pi /= count return pi; } You can define "element-by-element" SIMD functions, in which the developer describes the operations performed on individual data elements. The compiler knows that the function can be safely used in the SIMD cycle. To define the SIMD function, use the “omp declare” construction
#pragma omp declare simd notinbranch float min(float a, float b) { return a < b ? a : b; } #pragma omp declare simd notinbrach float distsq(float x, float y) { return (x - y) * (x - y); } Such things allow you to combine data parallelism (SIMD) within a single core, and parallelism across threads or tasks running on multiple cores. The following loop is first vectorized, then the remaining number of iterations can be performed by different threads:
#pragma omp parallel for simd for (i=0; i<N; i++) d[i] = min(distsq(a[i], b[i]), c[i]); Using the co-processor
Accelerators and co-processors, such as Intel Xeon Phi, are gaining popularity. In OpenMP 4.0, you can send calculations (which are well parallelized) to a co-processor using omp target. This construction starts the code block on the accelerator following it. If it does not exist or is not supported, the code will run on the CPU in the normal mode. The “map” construction allows you to organize data sent to the co-processor:
#pragma omp target map(to(b:count)) map(to(c,d)) map(from(a:count)) { #pragma omp parallel for for (i=0; i<count; i++) a[i] = b[i] * c + d; } Intel Advisor XE models parallel execution of sequential code. It is used for prototyping parallel algorithms, giving architects the opportunity to quickly experiment with different design options, before significant resources are spent on implementation. The result is a prediction of program execution acceleration and scalability, as well as an indication of the race data that may appear in the parallel version.
Advanced acceleration and scalability analysis
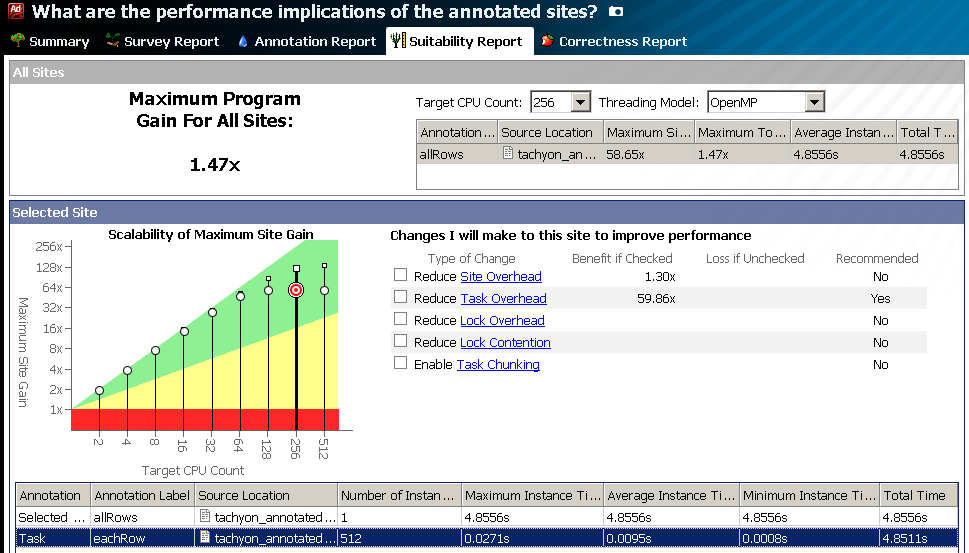
Earlier, scalability was estimated from 2 to 32 cores. This was usually enough for the CPU, but not for the Intel Xeon Phi co-processor, which has more than 240 hardware threads. The new version of Advisor XE evaluates the scalability of the algorithm on an unlimited number of cores. The picture below shows an example with 512 cores. Now you can evaluate how ready your algorithm is for porting to Intel Xeon Phi in terms of the number of threads (you also need to evaluate the “vectorization” of the code, memory limitations, etc., which the Advisor XE does not yet do).
Experiment snapshot
Inspector XE and VTune Amplifier XE users have the ability to do many tests and store all the results, tracking changes in performance and problem status. Until recently, Advisor XE was deprived of such an opportunity - the result of only the last experiment was kept, due to the complexity of the profile structure and its close connection with the current version of the code.
Intel Advisor XE 2013 update 4, supplied with Parallel Studio XE 2013 SP1, has the ability to make a copy of the experiment (snapshot). This copy is read-only, but it allows you to see what the performance evaluations were in earlier versions of the code, and compare them with the current one:


Analysis of individual sections of the code
Advisor XE analysis can add significant overhead, because complex simulation of parallel execution “in real time” is being carried out. To save time, you can now mark the individual sections of the code that need to be analyzed. In addition, such a "narrowing" can improve the accuracy of the analysis by eliminating the influence of other parts of the program. All this is implemented by new types of “annotations”: ANNOTATE_DISABLE_COLLECTION_PUSH and ANNOTATE_DISABLE_COLLECTION_POP (there are also buttons for manual control):
int main(int argc, char* argv[]) { ANNOTATE_DISABLE_COLLECTION_PUSH // Do initialization work here ANNOTATE_DISABLE_COLLECTION_POP // Do interesting work here ANNOTATE_DISABLE_COLLECTION_PUSH // Do finalization work here ANNOTATE_DISABLE_COLLECTION_POP return 0; } Intel Inspector XE - debugger of memory and threads, performs dynamic analysis during the execution of the application and can be integrated with standard debuggers. It can find errors in working with memory, such as leaks, incorrect memory access, etc., and errors in working with streams - interlocks, data races, and others. Such problems can be missed by normal functional testing or static code analysis.
Importing Valgrind * and Rational Purify * Suppression Rules
Inspector XE has the ability to suppress individual problems or groups of problems that are not of interest to the developer. For example, problems in foreign modules or false positives. Similar functionality is in other tools. The rules of suppression in large projects are stored in separate files that define the place in the code, the module, the type of problem and other information.
The new version of Inspector XE - update 7 has the ability to import files with the rules of suppression, generated by other tools - Valgrind and Rational Purify. These files are converted to Inspector XE format. This simplifies the transition to the Inspector XE from other tools, saving time and past investments in the formation of the base rules of suppression.
In addition, the Inspector XE suppression rules are now stored as text and can be edited manually.
Search for memory leaks before application termination
Memory leak detection is one of the most popular ways to analyze memory problems in the Inspector XE. In previous versions, leak detection was necessary for the program to run from start to finish, so that the Inspector XE could track all allocations and free up memory. This is not always convenient if, for example, an application runs for a long time, or even forever, like a demon or a service. In addition, if the program terminates incorrectly, “crashes,” it will also not be possible to track leaks in this way.
In the new version of Inspector XE, a programmer can mark a region of code in which to look for memory leaks. Restrict such a region can be a special API in the source code. You can call a report on the leaks detected to date by the buttons in the graphical interface and commands in the command line.
Those. You can search for leaks in a particular section of the code, and learn about them without waiting for the process to complete.
Intel VTune Amplifier XE is a performance profiler. It shows the most expensive in terms of CPU resources areas of your application with different granularities - by threads, modules, functions, instructions, etc. The tool provides information about the load balance between threads, latency and synchronization objects that cause these waits. VTune Amplifier XE allows you to detect micro-architectural performance problems, such as cache misses, "false sharing" and many others.
Detailed Overhead Report
In a multi-threaded program, a part of the CPU time is inevitably spent on synchronizing threads, distributing work between them, and so on. This time spent not on basic calculations is called overhead or “overhead”. These overheads need to be minimized to improve performance. VTune Amplifier XE can now give detailed information about overhead and spin waiting. You can estimate the amount of CPU time spent on overhead in a particular function, module or instruction. The tool can show "overhead" coming from OpenMP, Intel Threading Building Blocks or Intel Cilk Plus. You can use both the time values in the table and the graphical representation on the timeline:
Improved analysis of OpenMP * applications
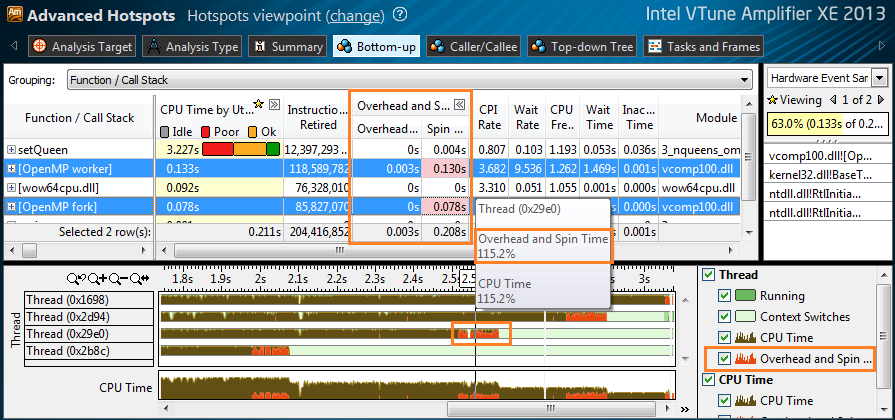
The new VTune Amplifier XE has received advanced analysis of OpenMP regions. Grouping by “Frame Domain” in the Bottom-up panel shows the OpenMP regions as frames - see the picture below. Using filters, you can narrow the performance profile to a separate parallel region, estimate how much time was spent there, what was the load balance, etc. The string “[No frame domain - Outside any frame]” represents the sequential part of your program, so that you can evaluate the degree of “parallelism” of the code (recall Amdahl’s law ).

Overhead costs and active wait times related to OpenMP are defined not only for Intel OpenMP, but also for GCC * and Microsoft OpenMP *. In the picture above (Advanced Hotspots analysis), “[OpenMP worker]” and “[OpenMP for]” refer to the Microsoft OpenMP * library — the vcomp100.dll module.
View source code and assembler from the command line
In some cases, the command line is more convenient to use than the graphical interface. For example, when you are working on a remote Linux server via SSH. Now you can view the sources in the VTune Amplifier XE profile directly from the command line. So you may not need to copy the profiling results from a remote machine or configure VNC - you can quickly look at the profile from the same command interpreter from which you started the data collection:
# amplxe-cl -report hotspots -source-object function=grid_intersect -r r000hs/ Source Line Source CPU Time:Self ----------- ------------------------------------------------------------ ------------- 460 return 1; 461 } 462 463 464 /* the real thing */ 465 static void grid_intersect(grid * g, ray * ry) 0.036 466 { 467 468 469 flt tnear, tfar, offset; 470 vector curpos, tmax, tdelta, pdeltaX, pdeltaY, pdeltaZ, nXp, nYp, nZp; 471 gridindex curvox, step, out; 472 int voxindex; 473 objectlist * cur; 474 475 if (ry->flags & RT_RAY_FINISHED) 476 return; 477 478 if (!grid_bounds_intersect(g, ry, &tnear, &tfar)) 479 return; 480 481 if (ry->maxdist < tnear) 0.020 Caller / Callee Call Tree Analysis
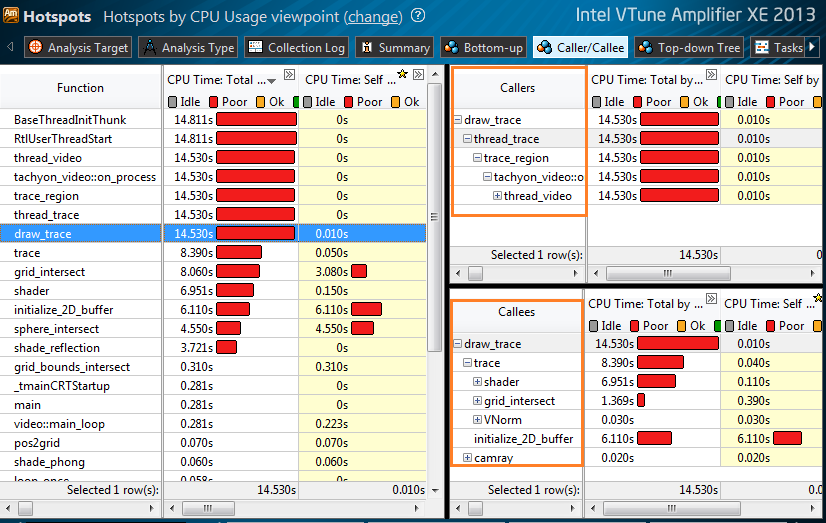
New tab Caller / Callee combines the best of Bottom-up and Top-down. It shows the own execution time of each function and the total time, taking into account the called functions. For the selected function, its parents (Callers) are shown in the upper right window, and the called functions (Callees) are shown in the lower right window. In the Caller / Callee window, you can explore the call sequences, and the contribution of each level to CPU consumption. You can filter on the full time of any function and get all the trees that have this function on any level. So you can find the most critical branch of calls.
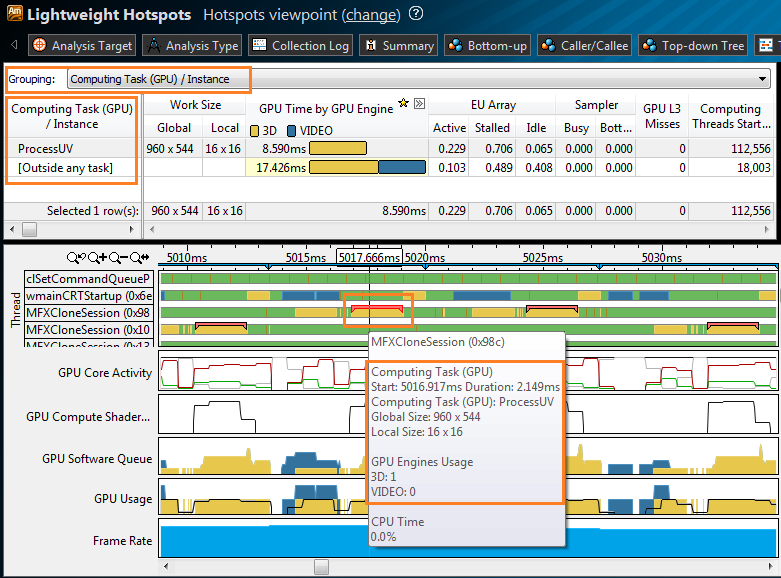
GPU profiling
VTune Amplifier XE can now profile code running on Intel Processor Graphics. You can track the overall activity of the GPU: is it used for video decoding? What CPU threads run GPU computing? Are all GPU resources used? This feature is especially interesting for computational tasks running on a GPU through OpenCL *. VTune Amplifier XE recognizes OpenCL kernels (or computing task), you can see the size of the work and microarchitectural problems, such as L3 cache misses. On the timeline, OpenCL kernels are marked on the CPU threads that started them. You can observe the state of the GPU (GPU Execution Units) computational cores over time: active, idle, or stalled. Having data on the loading of the GPU, you can assess the extent to which the program's performance is limited: CPU or GPU, which OpenCL kernels spend more resources, where there are opportunities for more loading of the GPU and, accordingly, CPU load.
Top-down performance analysis on fourth-generation Intel Core processors
The study of micro-architectural problems is not a trivial task. An understanding of the CPU micro-architecture and knowledge of the hardware events that register what is happening in the processor is required. To give more structure and friendliness to such an analysis, the data from the hardware counters in the General Exploration analysis were reduced to more comprehensible metrics, and organized from top to bottom, or from general to specific. The tool itself counts the metrics for the platform on which the data was collected, and highlights potential problems that limit performance. The hierarchical presentation of data makes it possible to control the level of detail, navigation becomes more convenient.

Summary
Intel Parallel Studio XE 2013 SP1 provides new opportunities for efficiently programming for co-processors, getting more from parallel models (such as OpenMP), easier to find and fix complex performance problems on new microarchitectures, creating excellent software products. Download the new version , check how new features can improve your current project.
Source: https://habr.com/ru/post/194912/
All Articles