HOLO - Music Analysis System - Version 2

Introduction
A little less than a year ago I wrote an article on Habré about a program I’m developing under the name HOLO .

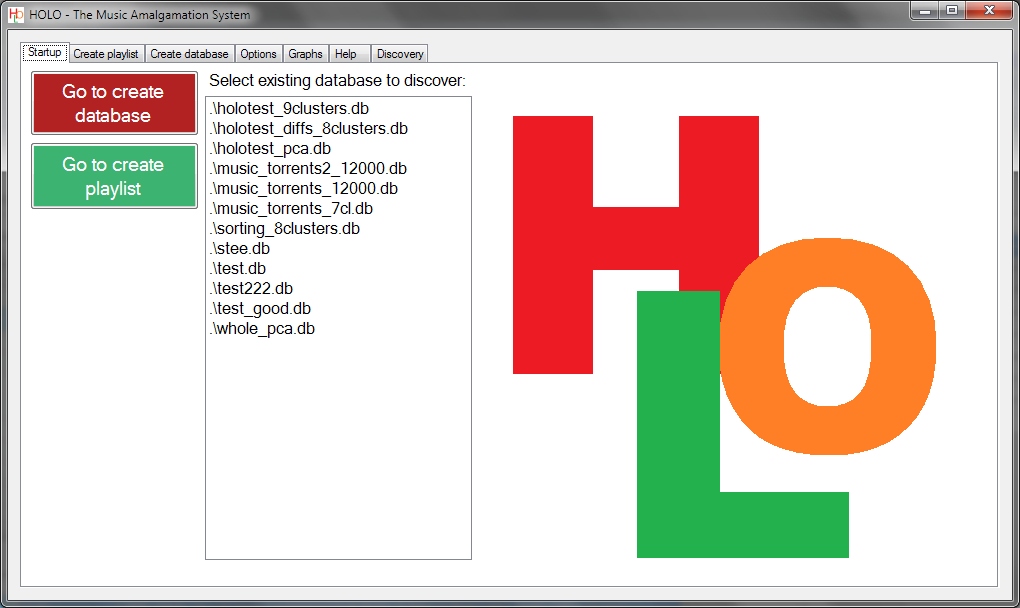
In short, the program “listens” to your music collection and then allows you to visually explore the array of collected data, as well as compile playlists similar to the specified sample tracks.
Positive feedback allowed us to keep enthusiasm. One person even went on the link and attempted to rewrite the application from .NET WinForms to WPF, but after some intermediate successes, he suddenly disappeared from view. I don’t blame him, as I understand that the project is very hard in content, and being a programmer in core work, it was difficult to devote enough time to HOLO.
Nevertheless, I myself delayed the release of the new version, but there are more positive reasons for this than banal laziness.
Opportunities
Generally speaking, from the point of view of the psychology of perception of sound, the task is very subjective. Each person will assess in his own way whether Jeanne Aguzarova and Zemfira are similar, Led Zeppelin and Iron Maiden, System of a Down and Metallica. But intensive testing on himself and friends showed that some things can still be expressed in numbers. For some genres of music is better, for some worse.
')
So, at the moment HOLO (The music amalgamation system) is able to:
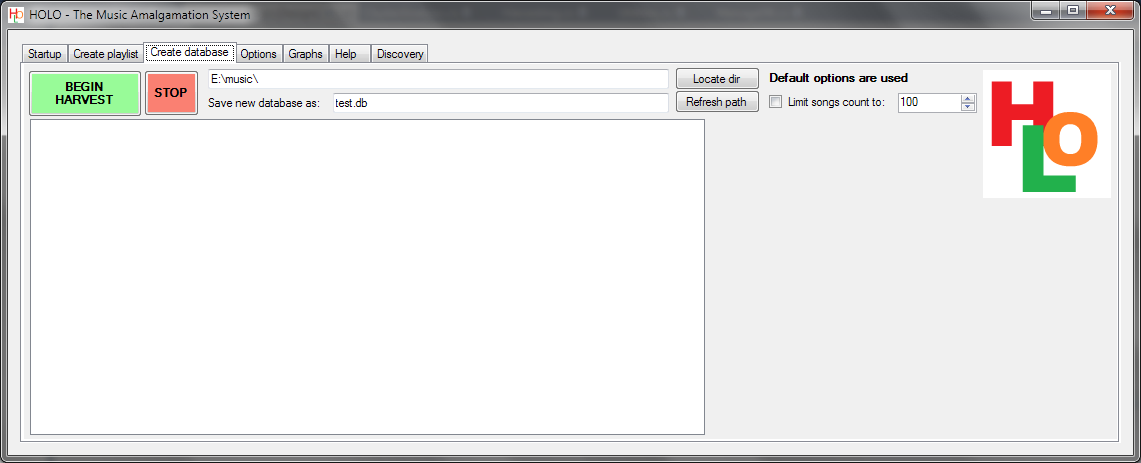
Collecting (harvesting) information about musical records on the user's computer
Relative to the previous version, the algorithm of both mechanical file processing and statistical sound processing was significantly reworked. In particular, the possibility of parallel processing of files in several streams.
Statistical processing, in short, now looks like this:
1) A fragment of parameterizable length is extracted from the file, starting at 20% of the total length.
2) The fragment is cut into a parameterizable number of pieces with a parameterizable overlap percentage.
3) Pieces are converted to FFT format, subjected to smoothing and cleaning;
4) Having a certain set of pre-prepared "centroids", the distance of each piece to each of these centroids is estimated. Centroids are spectrograms of specially selected fragments of sound 4096/44100 seconds long.

5) The temporal dynamics of the distances to the centroids roll up into the transition matrix of the composition sound fragments between centroids. For example, if the sound does not change for a long time (within the distance to the nearest centroid), then the value in the diagonal cell of the transition matrix will be greater;
6) The transition matrix is the result of statistical processing.
Collecting results in a database
There has been no change. As before, SQLite works for the good of the country.
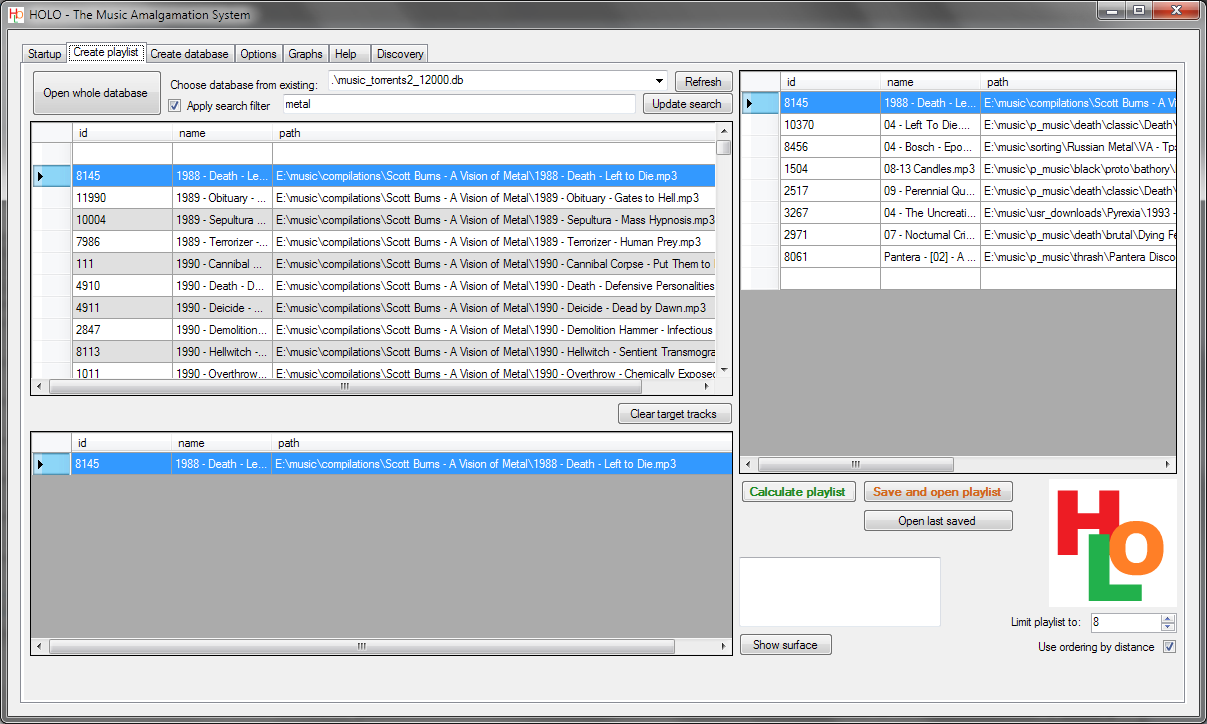
Playlist generation based on any number of sample entries provided
Here, too, the changes almost did not happen. Top left list - the contents of the database. Lower left list - samples to search. The right list is the resulting playlist. By clicking on the “Save and open ...” button, a .m3u8 file is created that opens any program that recognizes M3U playlists.
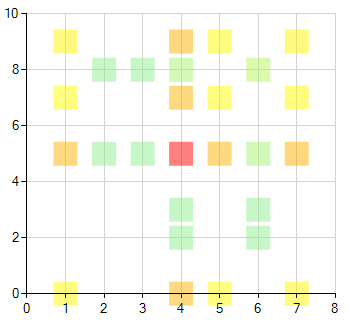
Visualization of statistics for each individual track
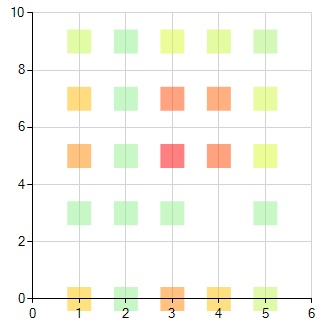
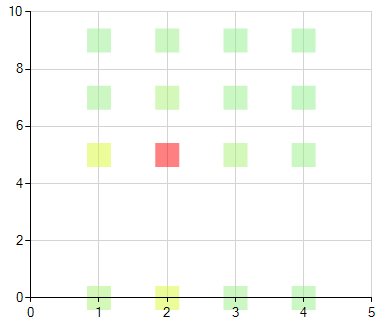
This is a new feature of the program that allows you to visualize the transition matrix (see the statistical processing algorithm above).
By itself, the visualized matrix is of no benefit to the user and is basically a decorative element of the program.
However, it is often possible to observe how certain compositions are grouped near different centroids.
Visualize the entire database
But this is perhaps the most complex and fresh functionality.
The first visualization method is the classic scatter plot . The problem is that there are too many data to build it in the database - with seven centroids, the transition matrix contains 49 elements, respectively, we deal with 49 coordinates of each processed file. In this case, very often up to half of these coordinates are zero, which also does not add to the visibility. An analysis of the main components came to the rescue, with the help of which it is possible to minimize a lot of useful information in 5-7 dimensions that can be visualized using two coordinates on a plane, plus three RGB color coordinates. As a result, the database scatterplot is a multi-colored cloud, which, however, can be parameterized quite flexibly, as well as shifted and scaled.
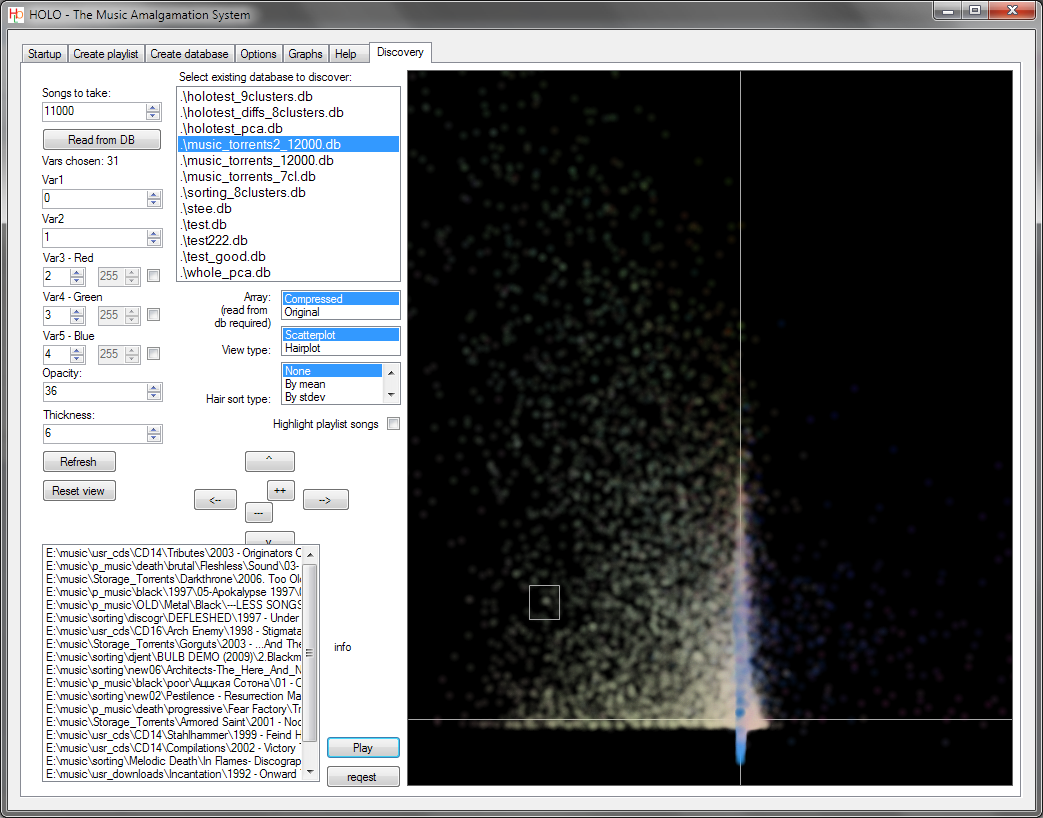
The second way of visualization is a graph on parallel coordinates . In this embodiment, a large number of coordinates are represented as an appropriate number of parallel axes, and each composition is represented as a polyline passing through a point on each of the axes. For better clarity, broken lines are replaced by splines, and therefore the graph looks like a braided spit. Of course, data compression with the help of principal component analysis is also useful for the streamer.

And try?
If you are using Windows XP and newer, you have .NET Framework 4.0, and you also have the ACM codec installed for reading MP3 files (do not ask how to check its availability, I don’t know myself), then you can try the distribution kit here .
Fans of studying the source code will have to wait until the normal repository is configured.
Benefits
Similar solutions from Apple, Google, Pandora Radio, Last.fm were analyzed. In all cases, the search is conducted according to metadata, which is at least unsportsmanlike, but at most, subjective and subject to the opinions of living appraisers.
In contrast, HOLO is still an impartial reviewer and referee, a system without a teacher. I used the word “bye” because I plan to introduce some kind of adjustment to the tastes of the user, an auxiliary subsystem of learning with a teacher.
And, of course, a big plus is that any item in the playlist is at your disposal, no streaming from remote servers, everything is under your control.
Restrictions
Unfortunately, it was not without them:
1) So far, only Win-platform;
2) For now only MP3 files 44.1kHz 16 bit;
3) With a base size of more than 10 thousand tracks x 10 centroids (~ 1 million records in the database), the formation rate of the playlist begins to exceed half a minute and is not parallelized yet;
4) It is impossible to resume the collection of the database, just start anew;
5) To specify multiple folders or exclude folders to collect while you can not, use symbolic links;
6) For any acceptable speed of database dialing, the tracks are not “listened” entirely, only a fragment from 1 to 3 minutes long. Therefore, everything that does not fall into this framework does not affect the analysis and the formation of playlists. This is one of the most common reasons for exclaiming “WTF ?!” when listening to a playlist.
7) But this is not the only reason, unfortunately. Discarding all the metadata about the files, the quality of the search is not yet perfect, please understand. But in ~ 80% of cases, the playlist will consist of things similar to the sample in tempo, sound density, volume and genre as a whole.
Afterword
At the moment, the program has grown to more than hundreds of kilobytes of code. Due to the fact that C # programming is not my profession, the quality in some places can shake the imagination. I would be pleased with informative reviews and volunteers who could help in the following aspects:
0) offer the best way of feedback for those who want to test the application at their place;
1) erasure
2) optimizing the speed of work, and, if possible, avoiding SQLite for executing queries;
3) finish UI;
4) expansion of the set of formats supported except MP3 to FLAC, AAC and OGG.
5) avoiding the NAudio platform-dependent library, which does MP3 decoding. This, perhaps, is the only thing that will not allow to compile HOLO under Mono and, accordingly, to run on all platforms supported by it.
Write in the LAN.
UPD: The project repository is here .
Source: https://habr.com/ru/post/194724/
All Articles