Android vs iOS on the example of one game
Hello! My name is Pavel and I am an indie developer .
I often read various kinds of analytics, there are a lot of graphs about how many android devices are currently activated, how many iOS are, how markets are growing and shares are falling. Unfortunately, percentages and abstract numbers rarely allow you to understand exactly what is actually going on inside.
Most likely, I’m not the only one with this problem, so I decided to share the “live” statistics of one of my games, which has become quite popular on iOS and Android. At once I will make a reservation that the speech about the game is exclusively in Russian, only Russian-speaking users play accordingly. For those who have a target for Europe, the USA, etc. post may be uninformative.
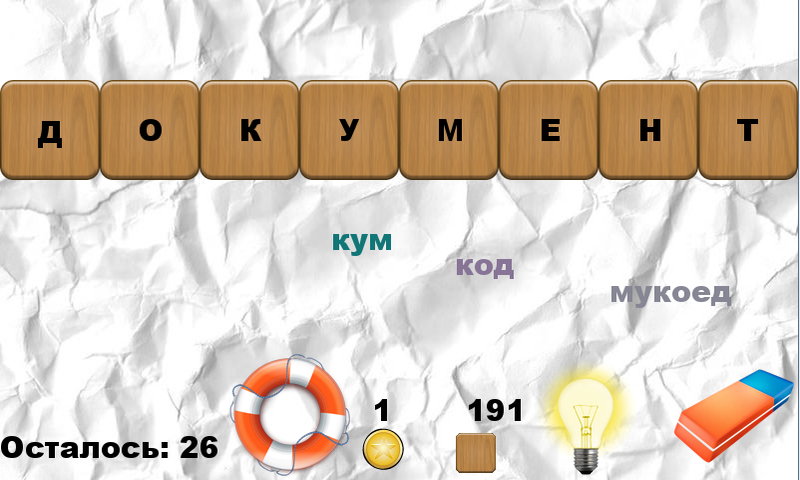
In March 2013, I posted the “Make a Word” game on Google Play. She did not offer any unprecedented gameplay. There were already 3 such in Russian (and now there are even more). Nevertheless, thanks to some features, ongoing support and weekly updates, the game was able to become relatively popular. It was not possible to take the first place even in its category, the case was limited to the fifth place in the Puzzles.
For a long time I released games only on Android, despite the fact that the framework was originally cross-platform and spreading games in parallel and in the Appstore is not so difficult. It was also a matter of prejudice against iOS, and in the absence of Mac (coupled with the reluctance to spend money on it (and the virtual machine could not run properly on an AMD processor)). But at some point I overcame the “toad”, waited for more or less adequate ads on Avito and bought a mac on the secondary market. So, almost four months later, in July 2013, the Make up a Word version appeared in the Appstore. The games were absolutely identical, except for Android, I continued to issue weekly updates with new content, and on iOS for all the time I limited myself to one. This was not my first application for iOS, I already managed to feel two failures, despite the fact that on Google Play one of the games was quite popular. But “Compose Words” could “fly up” in the top, simultaneously pulling out my other game from the bottom, which itself could not shoot on iOS.
Well, now the numbers. We will compare the statistics for 2 months. Those. for Google Play 03/15/2013 - 05/15/2013, and for the Appstore 11.07.2013-11.09.2013
In the first table, the best places in the top and places 60 days after launch in certain categories.
And a couple of graphs:
Android

iOS
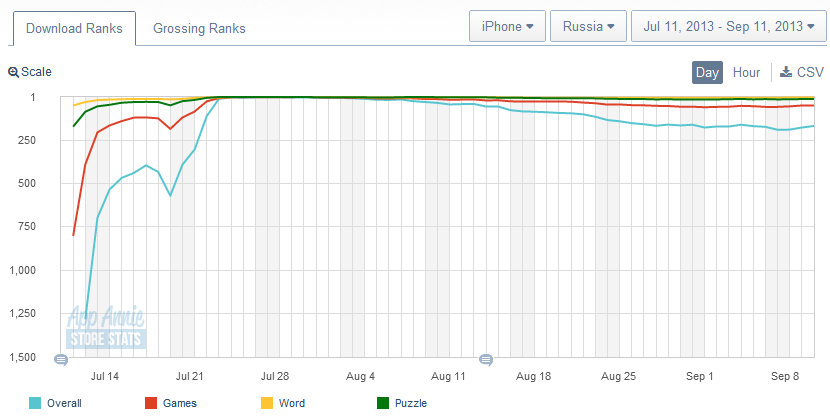
As can be seen from the tables, in iOS, the game was able to climb to the very top, but as time passed, it turned out to be still on Google Play. Perhaps the reason is more frequent updates of the Android version, and maybe the fact that on iOS it is much easier to push through the application to the top, so staying there on the top lines is much more difficult.
It's also worth saying that games on iOS can live in two thematic tops at once. The second is “Compose Words” - Word games. There, the position is quite high so far - it fluctuates between the first and third place. But they pump a little from there, this is a low-popular hub.
')
Now more interesting - downloads :
Android:

iOS:
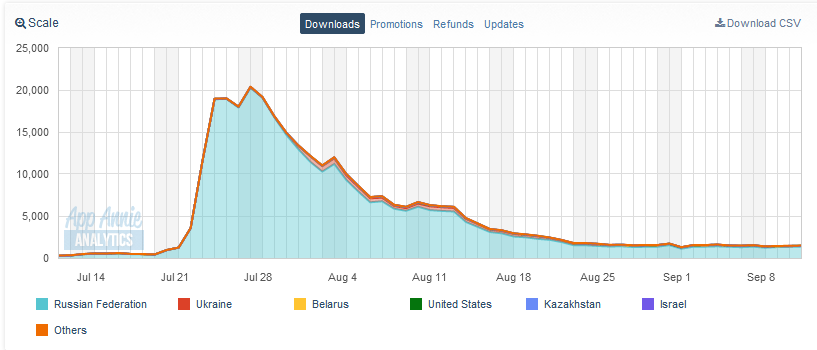
Despite the first place among all the games in the top, the maximum number of downloads per day on iOS slightly exceeded the same figure on Google Play. At the same time, for the first month in the Appstore 100 thousand more copies of the game were downloaded, and for the second Google Play, not only played this one hundred, but also stepped forward for even more installations.
The graphs show that on iOS, rapid growth is followed by almost the same rapid fall, while Google Play for slow growth rewards the same slow decline in downloads.
Further interesting to look at the estimates . In the table, the way the game was adopted on different devices. Because while being in stores is different, then for the first indicator we take the percentage of estimates from the total, and the absolute values in brackets.
As you can see, Android users are much more tolerant and positive in spite of a whole bunch of problems that had to be solved for this system. Perhaps the level of requirements for the game is somewhat lower, and maybe something else, but the fact remains that the number of fives on Android is much higher. It's funny that the ratio of the number of estimates / number of installations for both systems is the same. Those. the desire to evaluate the game does not depend on the system, the convenience of using the market and anything else. In this regard, users of both systems are the same.
Well, the most interesting - the loot .
Android:
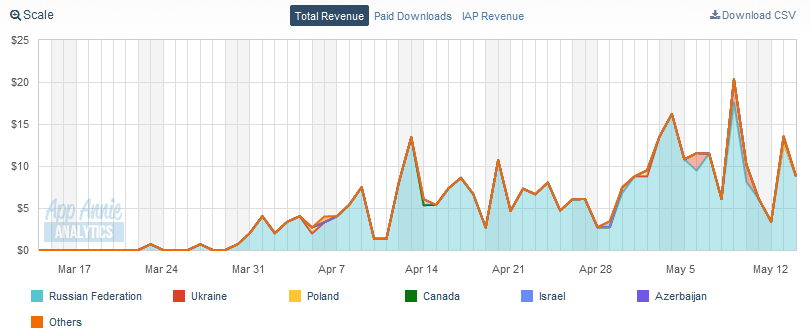
iOS:
And here is just a rout. If in the previous indicators Android felt rather confidently and often won, then in the main thing - money, everything turned out to be quite pitiable. Even for six months of the life of the game, the version for Google Play has earned less than the version on iOS for the first month in the Appstore. The reason is simple and everyone knows it. The thirst for freebies from Android users is very high. Especially in Russia :) The game sells coins, for which you can buy answers (monetization is very soft, quietly playing without buying anything is quite simple). Of course, there are a lot of ways to “wind” these coins on Android, and this can be done by any player. On iOS, this is not so trivial, which leads to just a huge gap in terms of earnings for these systems. Simple calculations show that $ 1,001 (10 times less than a cent) is spent on my download on Google Play, and $ 0.005 on iOS. Those. 5 times more the average user spends on iOS compared to a user on Google Play in Russia
Not so long ago, I realized that I was not completely facing that platform. I have to start paying more attention to iOS. Despite the fact that as a percentage of the share of iOS falls, the total number of users continues to grow. And the developer needs something there :) And I’m not talking about the many problems that Android users have (the game doesn’t load from Google Play, it doesn’t update, it crashes, it hangs, etc.). Every day I receive from 2 to 20 letters with problems from Android users and for all the time that I publish games for iOS, I received three letters from players from this system. Those. there is also much more time spent on support (and you don’t just have to answer, but also find a reason, a solution often unrelated to my application).
At the same time, I myself continue to use my Galaxy S I9000 three years ago and do not plan to leave Android.
I hope that this article will help someone in choosing the right vector of development in the mobile market.
I often read various kinds of analytics, there are a lot of graphs about how many android devices are currently activated, how many iOS are, how markets are growing and shares are falling. Unfortunately, percentages and abstract numbers rarely allow you to understand exactly what is actually going on inside.
Most likely, I’m not the only one with this problem, so I decided to share the “live” statistics of one of my games, which has become quite popular on iOS and Android. At once I will make a reservation that the speech about the game is exclusively in Russian, only Russian-speaking users play accordingly. For those who have a target for Europe, the USA, etc. post may be uninformative.
In March 2013, I posted the “Make a Word” game on Google Play. She did not offer any unprecedented gameplay. There were already 3 such in Russian (and now there are even more). Nevertheless, thanks to some features, ongoing support and weekly updates, the game was able to become relatively popular. It was not possible to take the first place even in its category, the case was limited to the fifth place in the Puzzles.
For a long time I released games only on Android, despite the fact that the framework was originally cross-platform and spreading games in parallel and in the Appstore is not so difficult. It was also a matter of prejudice against iOS, and in the absence of Mac (coupled with the reluctance to spend money on it (and the virtual machine could not run properly on an AMD processor)). But at some point I overcame the “toad”, waited for more or less adequate ads on Avito and bought a mac on the secondary market. So, almost four months later, in July 2013, the Make up a Word version appeared in the Appstore. The games were absolutely identical, except for Android, I continued to issue weekly updates with new content, and on iOS for all the time I limited myself to one. This was not my first application for iOS, I already managed to feel two failures, despite the fact that on Google Play one of the games was quite popular. But “Compose Words” could “fly up” in the top, simultaneously pulling out my other game from the bottom, which itself could not shoot on iOS.
Well, now the numbers. We will compare the statistics for 2 months. Those. for Google Play 03/15/2013 - 05/15/2013, and for the Appstore 11.07.2013-11.09.2013
In the first table, the best places in the top and places 60 days after launch in certain categories.
| OS | Android | iOS |
| Top Puzzles | five | one |
| Puzzle after 60 days | 12 | 12 |
| Top Games | 22 | one |
| Top Games after 60 days | 46 | 50 |
| Top Applications | 36 | 3 |
| Top Apps after 60 days | 76 | 168 |
And a couple of graphs:
Android
iOS
As can be seen from the tables, in iOS, the game was able to climb to the very top, but as time passed, it turned out to be still on Google Play. Perhaps the reason is more frequent updates of the Android version, and maybe the fact that on iOS it is much easier to push through the application to the top, so staying there on the top lines is much more difficult.
It's also worth saying that games on iOS can live in two thematic tops at once. The second is “Compose Words” - Word games. There, the position is quite high so far - it fluctuates between the first and third place. But they pump a little from there, this is a low-popular hub.
')
Now more interesting - downloads :
| OS | Android | iOS |
| Max. Per day | 15.828 | 20,397 |
| Just 30 days | 144,157 | 256,307 |
| Only 60 days | 460,683 | 328,256 |
| Total on 09/22/2013 | 880,168 | 343,207 |
Android:
iOS:
Despite the first place among all the games in the top, the maximum number of downloads per day on iOS slightly exceeded the same figure on Google Play. At the same time, for the first month in the Appstore 100 thousand more copies of the game were downloaded, and for the second Google Play, not only played this one hundred, but also stepped forward for even more installations.
The graphs show that on iOS, rapid growth is followed by almost the same rapid fall, while Google Play for slow growth rewards the same slow decline in downloads.
Further interesting to look at the estimates . In the table, the way the game was adopted on different devices. Because while being in stores is different, then for the first indicator we take the percentage of estimates from the total, and the absolute values in brackets.
| OS | Android | iOS |
| Total number of ratings | 5856 | 2219 |
 | 84% (4930) | 75% (1657) |
| 10% (583) | 12% (272) |
| 3% (171) | 5% (115) |
| 1% (50) | 2% (50) |
| 2% (120) | 6% (125) |
As you can see, Android users are much more tolerant and positive in spite of a whole bunch of problems that had to be solved for this system. Perhaps the level of requirements for the game is somewhat lower, and maybe something else, but the fact remains that the number of fives on Android is much higher. It's funny that the ratio of the number of estimates / number of installations for both systems is the same. Those. the desire to evaluate the game does not depend on the system, the convenience of using the market and anything else. In this regard, users of both systems are the same.
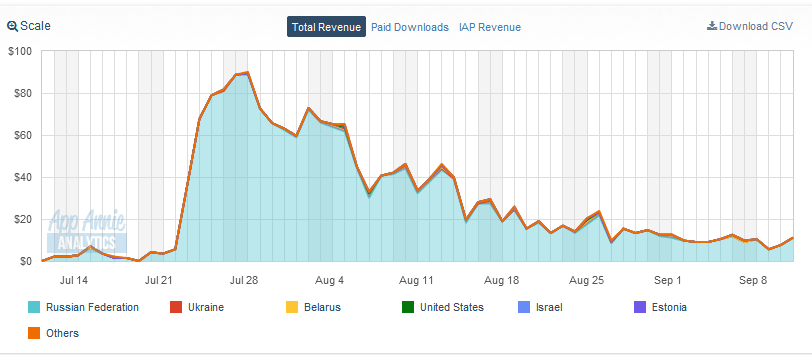
Well, the most interesting - the loot .
| OS | Android | iOS |
| Max. Per day | $ 26.23 | 90.04 $ |
| Just 30 days | 71.22 $ | 1,248.85 $ |
| Only 60 days | 319.58 $ | 1,792.39 $ |
| Total on 09/22/2013 | 1,120.15 $ | 1,888.99 $ |
Android:
iOS:
And here is just a rout. If in the previous indicators Android felt rather confidently and often won, then in the main thing - money, everything turned out to be quite pitiable. Even for six months of the life of the game, the version for Google Play has earned less than the version on iOS for the first month in the Appstore. The reason is simple and everyone knows it. The thirst for freebies from Android users is very high. Especially in Russia :) The game sells coins, for which you can buy answers (monetization is very soft, quietly playing without buying anything is quite simple). Of course, there are a lot of ways to “wind” these coins on Android, and this can be done by any player. On iOS, this is not so trivial, which leads to just a huge gap in terms of earnings for these systems. Simple calculations show that $ 1,001 (10 times less than a cent) is spent on my download on Google Play, and $ 0.005 on iOS. Those. 5 times more the average user spends on iOS compared to a user on Google Play in Russia
Not so long ago, I realized that I was not completely facing that platform. I have to start paying more attention to iOS. Despite the fact that as a percentage of the share of iOS falls, the total number of users continues to grow. And the developer needs something there :) And I’m not talking about the many problems that Android users have (the game doesn’t load from Google Play, it doesn’t update, it crashes, it hangs, etc.). Every day I receive from 2 to 20 letters with problems from Android users and for all the time that I publish games for iOS, I received three letters from players from this system. Those. there is also much more time spent on support (and you don’t just have to answer, but also find a reason, a solution often unrelated to my application).
At the same time, I myself continue to use my Galaxy S I9000 three years ago and do not plan to leave Android.
I hope that this article will help someone in choosing the right vector of development in the mobile market.
Source: https://habr.com/ru/post/194702/
All Articles