Retail analytics: today you didn’t buy condoms, and the store already knows when a discount on baby food will come in handy
That somehow it works slyly.
About your future child - this, of course, is exaggerated, but everything can be. In practice, we help retail fight for every ruble with the help of a mathematical apparatus . For example, you have a loyalty card in your wallet, or you pay with a credit card. This means that in general the store knows how much and what products you need. Then you can build the optimal model of your trip to the store and understand in what situation you will buy more. What should be where, what kind of milk do you prefer (all of a sudden you are ready to take expensive and natural without hesitation?) And so on. Modeling you by aggregate data is easy.
The same analytics can be applied to all aspects of retail work.
')
From the ridiculous - once the system calculated that it would be advantageous to destroy about half a ton of paper. At first they thought that the bug - but they began to dig and found out that the supplier gives a discount for a certain purchase threshold. A network may not have time to sell the right amount of paper. Taking into account the cost of the warehouse, delivery and the level of discounts starting from the threshold - it is easier to take and destroy a lot of goods in order to get it at a lower price. A discount of at least twice the loss of its losses.
At the entrance we have data from various sources (for example, cash checks, logs of calls to loyalty cards, visitor counters in stores, warehouse loading data, and so on). At the exit for the business owner - the answers. For example, here are the following questions:
- What is the optimal amount of inventory for each product?
- How exactly do marketing promotions affect sales?
- Why was not a single bottle of wine sold on Saturday, the 9th, from 6:00 pm to 7:15 pm?
- What sales results should a new product show to keep it online? How does this relate to display space?
Plus, you can consider the KPI of each employee. For example, the seller. And, by the way, at the same time you can display this data to him - for example, “you have 5% left to the best employee of the month”. Or display data from another shift to compete. In general, you can do anything with information.
More BI for retail means the ability to analyze staff actions. For example, if an average cashier issues a check in 2 minutes, then you can find the “brake” that does it in 10. And understand why this is - is it somewhere free or have some technical problems?

Examples
They made test analytics for a store with two entrances : it turned out that it is enough just to block one with a storefront - this, of course, cuts off some of the people “from the street”, but it will affect the increase of the check due to the correct route. The result - a little less people, and more profits. The route to the store turns out longer, people have time to see not only milk and bread, but in general all that is in the range - and collect full baskets.
For the vodka company, we are now building the best routes for supervisors and merchandazers . We optimize the movement of people around the shops so that they can check as much as possible in a short time. Of the interesting things - if the merchandiser, for example, goes by subway - it is often more profitable for him to build a route according to the principle “he went out, made at point A, crossed the road, made at point B”. But supervisors drive cars and they cannot be given the same route - for example, it can drive around the railroad for about 20 minutes. We can build optimal routes for everyone.
You can also build solutions for distributors and remove from stores information about the sales of a particular group of products, the relevant manufacturer, and so on. From the standard - podekovka and sales analysis. For example, how does the placement of goods on the shelf affect its sales and where to put it optimally. A simple example. At the checkout counter, you need to keep not only a set of “chewing gum - contraception - napkins - cigarettes”, but as it turned out, especially in the morning, these are hangover cures. No one will go to the next pharmacy or search for them on the shelves. At the same time, a neat box with the inscription “reduces hangover” attracts attention as much as the “scum” in the evening 5 years ago. Well, about the location of children's products on the lower shelves and roach closer to the beer, you yourself know.
We are also engaged in the compilation of sales reports for franchisee outlets and branches . There is usually a situation like this - the farther from the center, the less control. If you do a normal analytics, the indicators immediately show where the problem may be. And for the central office, it is important to know about it before serious losses begin, such as the fact that a ton of yogurt will disappear by the expiration date. There must be time to react.
Another took the goods at 12 rubles 50 kopecks. We decided to calculate what will happen if we raise the price to 13 rubles — it turned out that they both took it and will take it.
What is the basis?
In any case, at the bottom of all this useful information are primitives - checks, description of the store, approximate coordinates of the provision of a particular brand on the shelf of this store. With this information, you can build absolutely any report, starting from how much per month it is sold per square meter, for a cashier, etc., and ending with details, as affected by the law banning the sale of alcoholic beverages at night. By the way, on such an analysis, we can not just recommend opening a separate cash register for alcohol at 22:30, before the night ban on the sale of alcohol, but also indicate the necessary opening rule - closing cash desks throughout the distribution network, taking into account holidays and events specific to the store location .
Reporting
In general, BI is the collection of data for the sake of using analytics on them. In addition to reports, there is also a mat. Appliance with appropriate models that will manage, for example, not only the routes of merchandisers, supervisors, but also simulate the behavior of the buyer in the store. It is possible to build forecasts, starting from the average check and what constitutes the maximum priority in it, that it is necessary to move it in one direction or another to increase sales of this maximum priority.
In addition, the collective use of licenses is always cheaper. Even a simple video stream of the movement of the pupils of buyers is more profitable to buy in turn than to take the cars for each store. It is cheaper to drive traffic over the network, and it is good to load video with pupil movement when viewing goods on the shelves from the “cloud”.
Incident response
The system catches incidents and sends information to those who need to respond. For example, if at 2:14 am a bottle of vodka is in the receipt (and there is no system that prohibits punching such a product), you need to urgently react before Roskomnadzor came to visit. For this, personnel officers are notified (they will fine the cashier for violation), security personnel (they will try to figure out how it happened), senior points and IT people (so that no one tries to erase the transaction if possible, and draw some write-off) . I think it's generally understandable.
Another characteristic incident is a go-ahead for sale. For example, the system knows that if you do not sell 20 yogurts a day, some of them will be overdue. It can automatically be decided like:
- After 3 days, put the goods higher on the shelf (give instructions to the store employees).
- After 8 days, make a 20% discount (update the price and stock base).
- Notify loyal customers about the discount.
- If sales do not grow - to motivate sellers with bonuses for this product.
- If yogurt is more than the forecast for the week before the end of the shelf life - activate the action “buy 3 for the price of one”.
It is clear that such things are considered in real-time - conditions are checked before each action, but I think the general meaning is clear.
Or maybe a very minor incident - a loyal customer has stopped buying milk. It does not take him in the store for 2 months and that's it (as seen on the loyalty card and checks). In this case, you can give him a 15% discount on dairy products at once - and notify about it.
Knowledge base
Business processes can be scaled. Here's another example: in one store, beer sales grew, quite significantly. Through BI found the reason - the owner put the unit, which fries grilled chicken. As a result, this unit took some space, but it paid off itself and increased sales of the next category. It is logical to calculate this mechanic and put it in the base - when designing the next point, you can know for sure how to optimally use the area and what equipment to use. In the case of a distribution network, the rule is entered as “look, we have done this control action, and our sales have increased”, and the system allows us to evaluate all the parameters and transfer experience to other points.

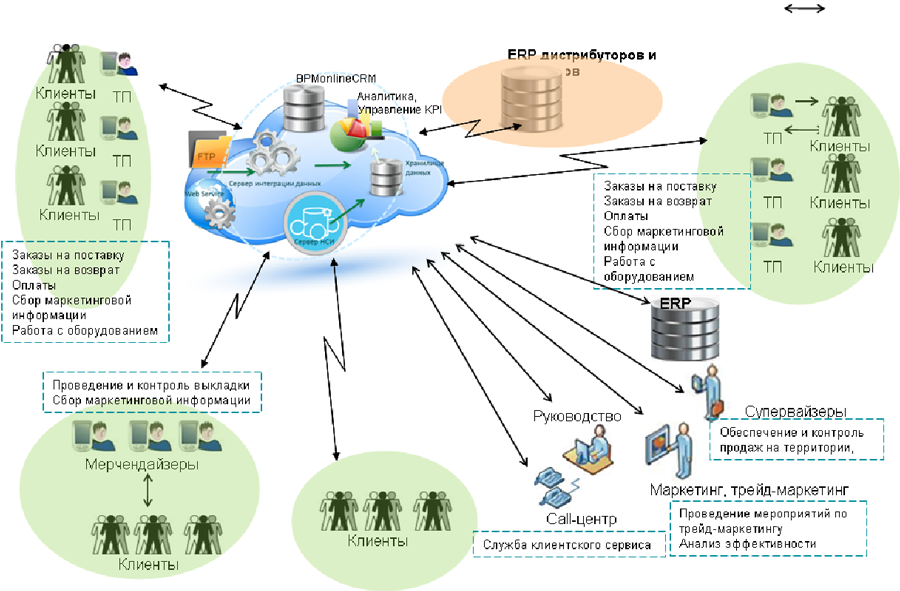
How is this implemented?
All mat. the device lies in our cloud. The complexity of implementing BI systems is usually in data collection and the incredibly complex integration of all this. We have made it as simple as possible - there are connectors to all used systems like 1C, which simply isolate the necessary source data and send for processing. And there is a mat. Appliance that is configured for business tasks. Working with it resembles correctly formulated database queries.
Here is the data path:
- Data is delivered via E-MAIL / FTP / WebServices (data from a point is uploaded to XML via FTP or mail, or a web service is opened allowing data exchange).
- An automated process checks incoming data and populates the repository.
- The business layer of the system filters, aggregates and visualizes data and generates reports.
- Reports hosted on a secure web server are available for viewing by a business user.
- The data coming from distributors is reduced to the standards of a single NSI.
How it works? Well, for example, we give data cleaning tools, but we do not clean the data. We provide a data collection tool, but we do not collect data ourselves. We give the data storage tool, we store this data, the customer himself connects his system, he can use this data himself. The structure is universal for everyone.
There is a set of ready-made modules. We have a tool for creating fixed reports, a tool for creating automated uploads on a schedule, sending by mail - any question tool. If there is no tool, and the customer tells us “make there a super-duper beautiful report”, yes, we will make a report in this case - but we will give the module to all customers. We need a model - not a question, we will make a blank of this model, we will not select the parameters of the model, but we will teach this model basic actions. Regular recalculation of the model will be done by the customer himself. For example, if a customer has new marketing conditions, and the model does not provide for one of the conditions, we will expand it. But if it is necessary to exchange one product for another, the customer will easily do it himself.
Solvable business problems:
- GUI for users far from the console
- Top-down and bottom-up analysis
- Simultaneous analysis of large amounts of information: over large time periods and comparison of aggregated data.
- Control in accordance with the main management tasks: comprehensive data analysis, provision of regulatory reporting, flexible display of key indicators (KPI).
Solved technical problems:
- Data cleansing
- Data aggregation
- Parallel data processing
- Create and manage metadata
- Monitoring data streams
- Flexible regulation of information interaction with sources
- The ability to audit the procedures performed and user work
- Data of different distributors
- Maintain a single NSI
- Managing the attribute composition of reference information
- Ability to connect an unlimited number of directories
- Protection of data transformation rules and connection parameters from unauthorized persons;
- Integration with existing security system;
- Access to transformations and tasks based on security policies;
- Protection of database user details;
- Distribution of roles;
- Monitoring the integrity of data during storage, updating and transmission over communication channels;
- Regular and backup.
In general, there are opportunities to do a lot. So far, the most popular services are data collection, storage, data cleaning, directory consolidation, reporting, and mobile CRM. All this is done easily and quickly - as far as it can be easily and quickly in Big Data. Objectively, you can feel the impact of BI on business in two months.
Price
The base cost is the amount of space consumed. Then - the number of channels to data collection points (that is, by the number of branches or suppliers). Work on the setting - it will be necessary to go on points and connect. Plus, other metrics, but they are not so affected. Other metrics, such as the number of users and their activity, as well as merchandisers, supervisors and the number of mat-models affect, but these are not basic parameters. If you need exactly for your situation - you can ask me in PM or by mail to brahew@croc.ru.
You can write a report with all its logic: we make the most complex report no more than 10 days, and the simplest one - 5 hours. And then count. And separately there is data visualization - many people need visual, almost infographic reports.
The main task so far is the processing of Big Data, for example, following the results of a one-time semi-annual unloading on the topic “what to buy for the New Year”. We have a good case, just like from the advertising of washing powder. Our MPP DBMS on tests, on quite a regular office PC in the amount of 5 pieces, showed comparable performance with SMP DBMS on the HiEnd server (to be more precise, 10 days on SMP versus 2 hours on MPP without optimizing the latter). Problems with the peak of New Year's sales should not be, as well as the nerves of users to receive once a minute the same report and launch the model just in case.
In general, companies - potential customers themselves understand the need for such a tool. Its payback is about 7-9 months. After all, even half a percent additional margin or savings can mean millions of rubles a day (if we are talking about large retail, of course). That is, the service helps to earn and save.
Summary
% User%%, such a system keeps track of you in a number of stores and knows about you, perhaps already more than Google. Of course, solely for your convenience, and then suddenly you forget to buy milk :)
But seriously - the new analyst may already be so much that in some places it scares. If the topic is interesting, I advise you to look at the pieces of examples here on these links:
- Expert systems for sales forecasting ;
- Expert supply chain optimization systems ;
- Procurement forecasting ;
- And a mechanism for building optimal routes for cash collectors to ATMs .
Source: https://habr.com/ru/post/194388/
All Articles