What is silent Gantt chart or why projects are always late
Every time I look at Gantt charts [ 1 ] , I am tormented by the same question. How? Here's how to be sure that resource A will complete task B in 5 days? No, I understand that there is historical data, there is, I am not afraid of this word, statistics. But how can you make confident predictions based on all this? I do not understand.
If for you the terms "interdependence of events" and "statistical deviations" say something not only separately, but also in aggregate, then the article is unlikely to interest you. But if these terms used in the same context do not tell you what the problem of Gantt charts are, then I invite you to the cat, where we will discuss this with a simple example.
For example, take a small company that develops web projects. The company has been operating for a long time, so we will assume that we even have statistics on completed projects for a fairly large period. In the company, in order to increase efficiency, there is a division of labor. Therefore, the order fulfillment process consists of four stages: conclusion of a contract with a customer, design development, project implementation, implementation.
The following assumptions will be made for the demonstration:
All these assumptions allow us to discuss a balanced system. Or, in other words, a system in which at each stage, at least on average takes the same number of days. If everything is arranged in this way for you, then write about it in the comments, I will envy you with white envy, since I have not yet seen organizations without “narrow links”, and you are already working in this.
Everything, with the introduction I finish, I turn to the topic.
Let's build the first Gantt chart. In this diagram, we, knowing that the average time for completing a stage is 5 working days, we will get how long it will take to implement 5 projects:

In this diagram, the classical assumption is expressed that the lag of some stages is compensated by the advance of others, on average, five days. But there is one small nuance. Which one Let's show by example. Let's start with the first stage.

As you can see, the first stage fits into our assumption. Those. the slowdown of some stages, offset by the acceleration of others. But, if we have the mentioned “interdependence of events”, then with the second stage the situation is not so rosy:

Noticed that instead of the thirtieth working day, the second phase of the fifth project ended on the thirty third working day? And then the manager’s dreadful dream emerges: 13, 14, 18, 19, and 20 working days, the employees have nothing to do. Well, the last picture:

Right now, the reader should have the thought: "Yes, he just set up an example of this!". Unfortunately, did not set up. Having carried out the simulation 1000 times, even in such greenhouse conditions, with a mathematical expectation at all stages in 5 working days, the probability of project completion depending on the day looks like this:

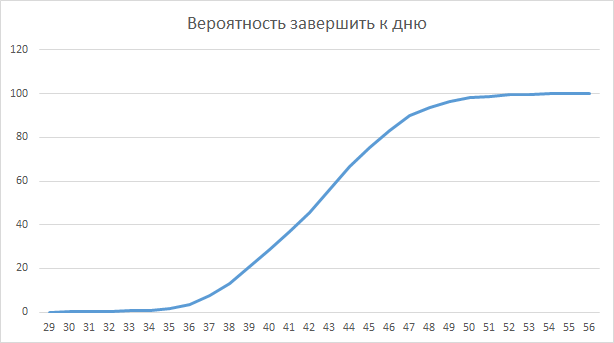
Yes, the most likely value is 44-45 days, but let's also build a schedule, what is the probability of completing projects by a given day:
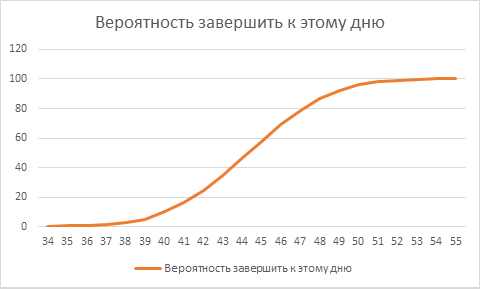
By the fortieth day, the probability of completing projects is approximately equal to 10%. By 44-45 days, the probability of completing all projects is only 50%. That is, if we agree to deceive the customer in terms of not more than once out of five, then we must take 80%, and this is already 48 days. It turns out the deviation from the original plan in 40 days at 20%. And this is in a balanced system, with the assumption that all projects are the same.
The situation is slightly improved when we have the probability of completion distributed under normal law. For example, with a mathematical expectation of 5 and variance [ 5 ] equal to 0.5. In this case, the probability of completing the stage in one of the days from 3 to 7 will be distributed as follows:
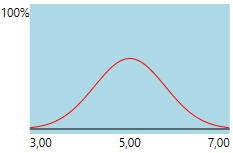
With such a distribution, the probability of completion by a certain day will be:
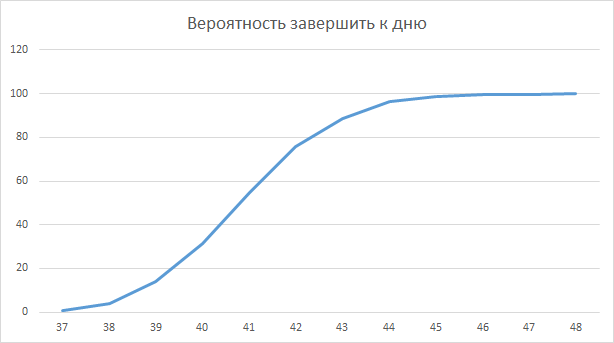
The situation has improved. In the planned 40 days, we will have time to do so with a probability of 30%. And by 43 working day the probability will be 80%. Unfortunately, in real projects such dispersion can be only with very high repeatability. For example, on the assembly line. When developing software, the variance will be much higher, since Most of the projects are unique and the range of labor costs for them can be quite large.
Well and completing, a little sketch for drawing attention to the next article. What do you think will happen with the “ideal” Gantt chart, if at the first, third and fourth stages shift the expectation by 4, in the second stage by 7. That is, Three stages will be faster on average by one day, and one stage is longer by two?
Ps For reading and tips on the article a big thanks to Andrey Potapov and CrazyViper . Happy programmer of you and all readers of Habr!
1. http://en.wikipedia.org/wiki/Gant's chart [ to text ]
2. http://ru.wikipedia.org/wiki/Continuous uniform distribution [ to the text ]
3. http://ru.wikipedia.org/wiki/Normal distribution [ to text ]
4. http://ru.wikipedia.org/wiki/Mathematical expectation [ to the text ]
5. http://ru.wikipedia.org/wiki/Dispersion of a random variable [ to the text ]
If for you the terms "interdependence of events" and "statistical deviations" say something not only separately, but also in aggregate, then the article is unlikely to interest you. But if these terms used in the same context do not tell you what the problem of Gantt charts are, then I invite you to the cat, where we will discuss this with a simple example.
For example, take a small company that develops web projects. The company has been operating for a long time, so we will assume that we even have statistics on completed projects for a fairly large period. In the company, in order to increase efficiency, there is a division of labor. Therefore, the order fulfillment process consists of four stages: conclusion of a contract with a customer, design development, project implementation, implementation.
The following assumptions will be made for the demonstration:
- Each stage takes 3 to 7 days. For example, the marketing department sells our service to the customer and enters into a contract with him. This process takes from three working days (a client with a standard task, signed a standard contract) to seven working days (the customer’s representative went on a business trip, additional approvals were reached on the contract, it is necessary to discuss the extended functionality). Designers carry out an order from three (the customer is not picky, agrees to a standard template, you need to make a logo, add several features) up to seven working days (the designer is ill, the customer does not sign the layout).
- The probability of completing a project on each day is distributed according to the law of continuous uniform distribution [ 2 ] :
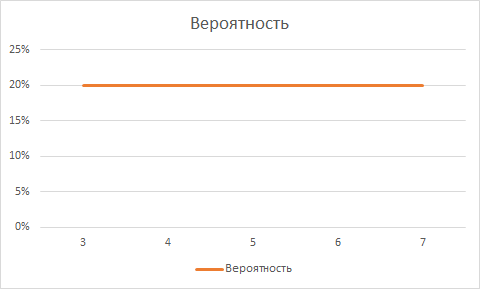
In most cases, this will certainly not be the case; rather, something like a normal distribution will be observed [ 3 ] . - With the original data from points 1 and 2, the expectation [ 4 ] for the term of the conclusion of the contract will be 3 * 0.2 + 4 * 0.2 + 5 * 0.2 + 6 * 0.2 + 7 * 0.2 = 5 business days. Those. on average, each stage is completed in 5 days.
All these assumptions allow us to discuss a balanced system. Or, in other words, a system in which at each stage, at least on average takes the same number of days. If everything is arranged in this way for you, then write about it in the comments, I will envy you with white envy, since I have not yet seen organizations without “narrow links”, and you are already working in this.
Everything, with the introduction I finish, I turn to the topic.
Let's build the first Gantt chart. In this diagram, we, knowing that the average time for completing a stage is 5 working days, we will get how long it will take to implement 5 projects:
In this diagram, the classical assumption is expressed that the lag of some stages is compensated by the advance of others, on average, five days. But there is one small nuance. Which one Let's show by example. Let's start with the first stage.
As you can see, the first stage fits into our assumption. Those. the slowdown of some stages, offset by the acceleration of others. But, if we have the mentioned “interdependence of events”, then with the second stage the situation is not so rosy:
Noticed that instead of the thirtieth working day, the second phase of the fifth project ended on the thirty third working day? And then the manager’s dreadful dream emerges: 13, 14, 18, 19, and 20 working days, the employees have nothing to do. Well, the last picture:
Right now, the reader should have the thought: "Yes, he just set up an example of this!". Unfortunately, did not set up. Having carried out the simulation 1000 times, even in such greenhouse conditions, with a mathematical expectation at all stages in 5 working days, the probability of project completion depending on the day looks like this:
Yes, the most likely value is 44-45 days, but let's also build a schedule, what is the probability of completing projects by a given day:
By the fortieth day, the probability of completing projects is approximately equal to 10%. By 44-45 days, the probability of completing all projects is only 50%. That is, if we agree to deceive the customer in terms of not more than once out of five, then we must take 80%, and this is already 48 days. It turns out the deviation from the original plan in 40 days at 20%. And this is in a balanced system, with the assumption that all projects are the same.
The situation is slightly improved when we have the probability of completion distributed under normal law. For example, with a mathematical expectation of 5 and variance [ 5 ] equal to 0.5. In this case, the probability of completing the stage in one of the days from 3 to 7 will be distributed as follows:
With such a distribution, the probability of completion by a certain day will be:
The situation has improved. In the planned 40 days, we will have time to do so with a probability of 30%. And by 43 working day the probability will be 80%. Unfortunately, in real projects such dispersion can be only with very high repeatability. For example, on the assembly line. When developing software, the variance will be much higher, since Most of the projects are unique and the range of labor costs for them can be quite large.
Well and completing, a little sketch for drawing attention to the next article. What do you think will happen with the “ideal” Gantt chart, if at the first, third and fourth stages shift the expectation by 4, in the second stage by 7. That is, Three stages will be faster on average by one day, and one stage is longer by two?
Gantt Chart and probability complete by day
Impressive? That is, theoretically reducing the development of the project for 1 day, we slowed down the development of 5 projects for 6 days. But, then, if we look at the probability diagram for the completion of 5 projects by a given day, then there:
With a probability of 80%, we will end by 46 days, which is obtained from the Gantt chart. Got attention? Well, well, we will meet in the next article.
Ps For reading and tips on the article a big thanks to Andrey Potapov and CrazyViper . Happy programmer of you and all readers of Habr!
1. http://en.wikipedia.org/wiki/Gant's chart [ to text ]
2. http://ru.wikipedia.org/wiki/Continuous uniform distribution [ to the text ]
3. http://ru.wikipedia.org/wiki/Normal distribution [ to text ]
4. http://ru.wikipedia.org/wiki/Mathematical expectation [ to the text ]
5. http://ru.wikipedia.org/wiki/Dispersion of a random variable [ to the text ]
')
Source: https://habr.com/ru/post/193592/
All Articles