Scaling Zabbix
 Those who use or intend to use Zabbix on an industrial scale are always worried about the question: how much real data can Zabbiks “digest” before it finally chokes and chokes? Part of my recent work was about this issue. The fact is that I have a huge network with more than 32,000 nodes and which can potentially be fully monitored by Zabbiks in the future. The forum has long been discussing how to optimize Zabbix for work on a large scale, but, unfortunately, I still could not find a complete solution.
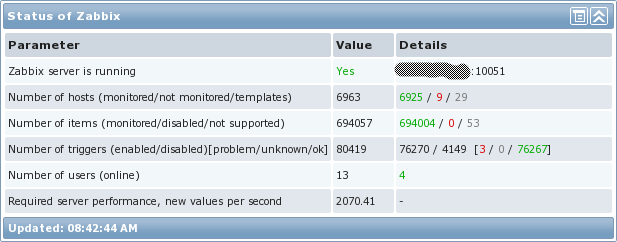
In this article I want to show how I set up my system, capable of processing really a lot of data. So that you understand what this is about, here is just a picture of the system statistics:
')
To begin with, I would like to discuss what the item “Required server performance, new values per second (further NVPS) (Required response speed per second)” really means. So, it does not correspond to how much real data gets into the system per second, but is a simple mathematical calculation of all active data elements taking into account polling intervals. And then it turns out that Zabbix-trapper is not involved in the calculation. In our network, trapper has been used quite actively, so let's see how much NVPS is really in the environment under consideration:
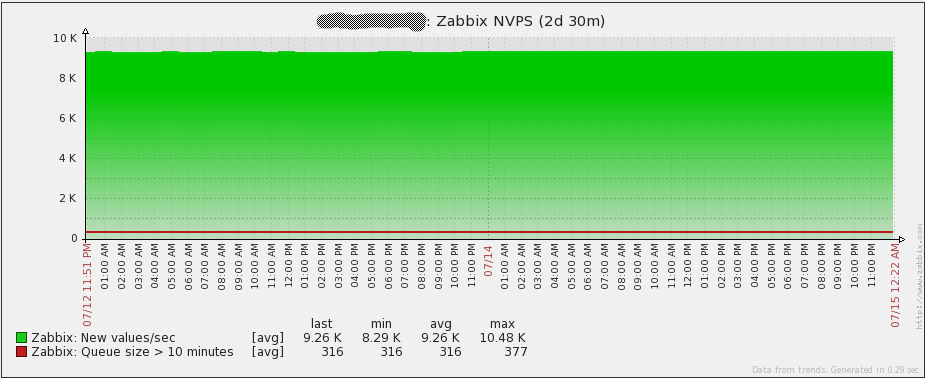
As shown in the graph, on average Zabbix processes about 9260 requests per second. In addition, there were short bursts in the network up to 15000 NVPS , which the server coped with without any problems. Honestly, it's great!
Architecture
The first thing to understand is the architecture of the monitoring system. Should Zabbix be fault tolerant? Will one or two hours of downtime matter? What are the consequences if the database falls? What disks will be required for the base, and which RAID setup? What bandwidth is needed between a Zabbix server and Zabbix proxy? What is the maximum delay? How to collect data? Interrogate the network (passive monitoring) or listen to the network (active monitoring)?
Let's look at each question in detail. To be honest, I did not consider the network issue when deploying the system, which led to problems that were later difficult to diagnose. So, here is a general scheme of the monitoring system architecture:

Iron
Accurately select the correct iron process is not easy. The main thing that I did here was using SAN for data storage, since Zabbix’s database requires a lot of I / O disk system. Simply put, the faster the disks at the database server, the more data Zabbiks can process.
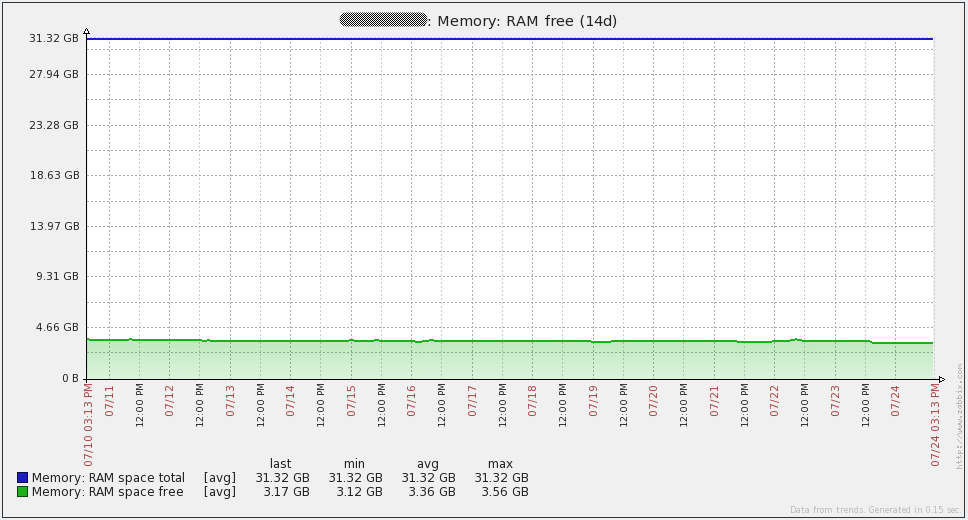
Of course, CPU and memory are also very important for MySQL. A large amount of RAM allows Zabbiks to store frequently read data in memory, which naturally contributes to the speed of the system. Initially, I planned for a database server with 64GB of memory, but everything works fine on 32GB so far.
The servers on which the zabbix_server itself is installed should also have sufficiently fast CPUs, since it is necessary for it to calmly process hundreds of thousands of triggers. 12GB would be enough for the memory as there are not so many processes on the Zabbiks server itself (almost all monitoring goes through a proxy).
Unlike the DBMS and zabbix_server, Zabbix proxies do not require serious hardware, so I used “virtual machines”. Basically, active data elements are collected, so that proxies serve as data collection points, but they themselves practically do not interrogate anything.
Here is the summary table that I used in my system:
| Zabbix server | Zabbix DB | Zabbix proxies | SAN |
|---|---|---|---|
| HP ProLiant BL460c Gen8 12x Intel Xeon E5-2630 16GB memory 128GB disk CentOS 6.2 x64 Zabbix 2.0.6 | HP ProLiant BL460c Gen8 12x Intel Xeon E5-2630 32GB memory 2TB SAN-backed storage (4Gbps FC) CentOS 6.2 x64 MySQL 5.6.12 | VMware Virtual Machine 4x vCPU 8GB memory 50GB disk CentOS 6.2 x64 Zabbix 2.0.6 MySQL 5.5.18 | Hitachi Unified Storage VM 2x 2TB LUN Tiered storage (with 2TB SSD) |
Fault tolerance Zabbix server
Let us return to the architectural issues that I voiced above. In large networks, for obvious reasons, not working monitoring is a real disaster. However, the Zabbiks architecture does not allow running more than one instance of the zabbix server process.
So I decided to use Linux HA with Pacemaker and CMAN. For basic configuration, please look at the RedHat 6.4 manual . Unfortunately, the instruction was changed from the moment I used it, but the end result should be the same. After the basic configuration, I further configured:
- Shared IP address (shared IP address)
- In the case of a faylover, the IP address goes to the server that becomes active
- Since the common IP address is always used by the active Zabbix server, there are three advantages from here:
- It's always easy to find which server is active.
- All connections from Zabbix server are always from the same IP (After setting the SourceIP = parameter in zabbix_server.conf )
- All Zabbix proxies and Zabbix agents simply specify the total IP as the server.
- The zabbix_server process
- in the case of a faylover, zabbix_server will be stopped on the old server and run on the new
- Symlink for cron jobs
- The symlink indicates the directory in which tasks are to be executed only on the active Zabbix server. Crontab must have access to all tasks through this symlink.
- In the case of a faylover, the symlink is deleted on the old server and created on the new
- crond
- In the case of a faylover, the crond stops on the old server and runs on the new active server.
Fault tolerance of the DBMS
Obviously, there is no benefit from the fault tolerance of servers with Zabbix-servers, if the database can fall at any time. For MySQL there are a huge number of ways to create a cluster, I will tell you about the method that I used.
I also used Linux HA with Pacemaker and CMAN and for the database. As it turned out, it has a couple of excellent features for managing MySQL replication. I use (used, see the “open problems” section) replication to synchronize data between the active (master) and standby (slave) MySQL. For a start, just like for Zabbix server servers, we do the basic cluster configuration. Then in the addition I set up:
- Shared IP address (shared IP address)
- In the case of a faylover, the IP address goes to the server that becomes active
- Since the common IP address is always used by the active Zabbix server, there are two advantages from here:
- It's always easy to find which server is active.
- In the case of a file server, no action is required on the Zabbix server itself to indicate the address of the new active MySQL server.
- Common Slave IP Address
- This IP address can be used when a read request to the database occurs. Thus, the request can process the MySQL slave server, if available.
- any of the servers may have an additional address, it depends on the following:
- if the slave server is available and the clock does not lag behind for more than 60 seconds, then the address will be with it
- In the opposite case, the address will be at the MySQL master server.
- mysqld
- In the case of a faylover, the new MySQL server will become active. If after that the old server comes back in operation, it will remain a slave for the already newly-made master.
An example of the configuration file can be found here . Do not forget to edit the pacemaker parameters enclosed in "<>". You may also need to download another MySQL resource agent for use with pacemaker. The link can be found in the MySQL cluster installation documentation with the pacemaker in the Percona github repository . Also for every "fire case" copy is here .
Zabbix proxy
If for some reason you have not heard about Zabbix-proxy, then please urgently look in the documentation . Proxies allow Zabbiks to distribute the monitoring load across multiple machines. After that, each Zabbiks proxy already sends all collected data to the Zabbiks server.
Working with Zabbiks proxy it is important to remember:
- Zabbiks proxies are capable of handling very large amounts of data if they are properly configured. For example, during tests, a proxy (let's call it Proxy A) processed 1500-1750 NVPS without any problems. And this is a virtual machine with two virtual CPUs, 4GB of RAM and a SQLite3 database. In this case, the proxy was on the same site with the server itself, so that the network latency could simply be ignored. Also, almost everything that was collected was the active data elements of the Zabbiks agent.
- I mentioned earlier how important network latency is in monitoring. So, this is true when it comes to large systems. In fact, the amount of data that a proxy can send, without lagging behind, is directly dependent on the network.
The graph below clearly shows how problems accumulate when network latency is not taken into account. A proxy that does not have time:
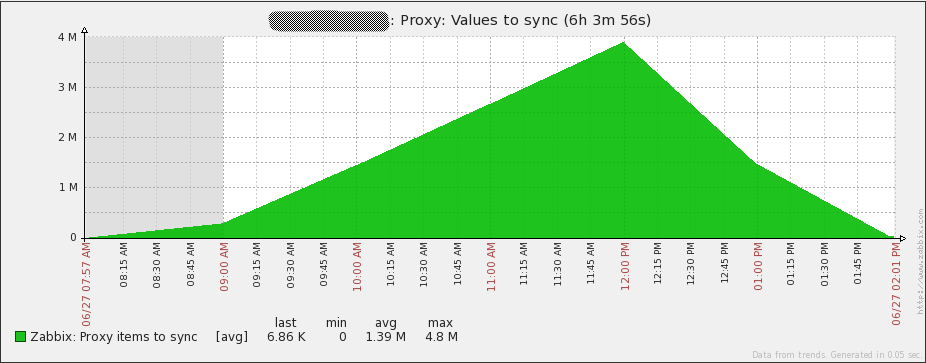
It seems clear enough that the queue of data for transmission should not increase. The schedule refers to another Zabbiks-proxy (Proxy B), which is no different from Proxy A by hardware, but can transfer without problems only 500NVPS and not 1500NVPS, like Proxy A. The difference is that B is in Singapore and server in North America, and the delay between sites about 230ms. This delay has a serious effect, given the way data is sent. In our case, Proxy B can only send 1000 collected items to Zabbiks server every 2-3 seconds. According to my observations, this is what happens:
- Proxy connects to server
- Proxy maximum sends 1000 collected data item values at a time
- Proxy closes connection
This procedure repeats as many times as required. In the case of a large delay, this method has several serious problems:
- Primary connection is very slow. In my case, it occurs in 0.25 seconds. Phew!
- Since the connection is closed after sending 1000 data elements, the TCP connection never lasts long enough to have time to use all the available bandwidth.
Database performance
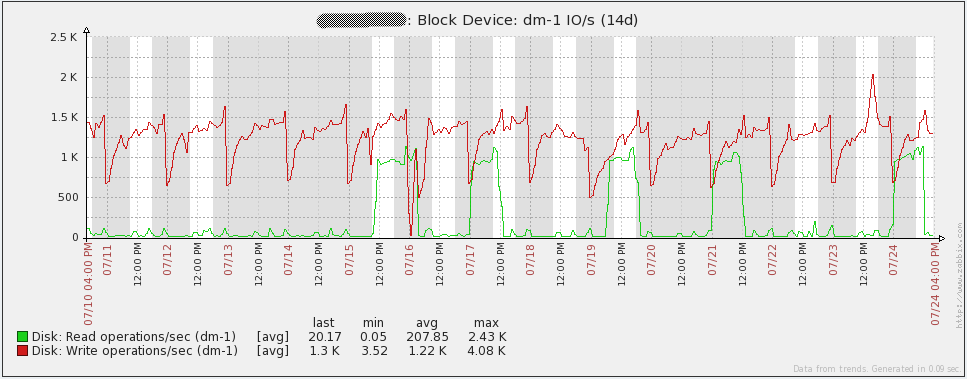
High database performance is key to the monitoring system, since absolutely all collected information goes there. At the same time, given the large number of write operations to the database, disk performance is the first bottleneck you encounter. I was lucky and I had SSD disks at my disposal, but still this is not a guarantee of fast base operation. Here is an example:
- Initially, I used MySQL 5.5.18 on the system. At first, there were no visible performance problems, however, after 700-750, NVPS MySQL started to load the processor 100% and the system literally froze. My further attempts to rectify the situation, twisting the parameters in the configuration file, activating large pages or partitioning, did not lead to anything. My wife suggested a better solution: first upgrade to MySQL 5.6 and then figure it out. To my surprise, a simple update solved all performance problems, which I could not win in 5.5.18. Just in case, here is a copy of my.cnf .
The graph shows the number of requests per second in the database:
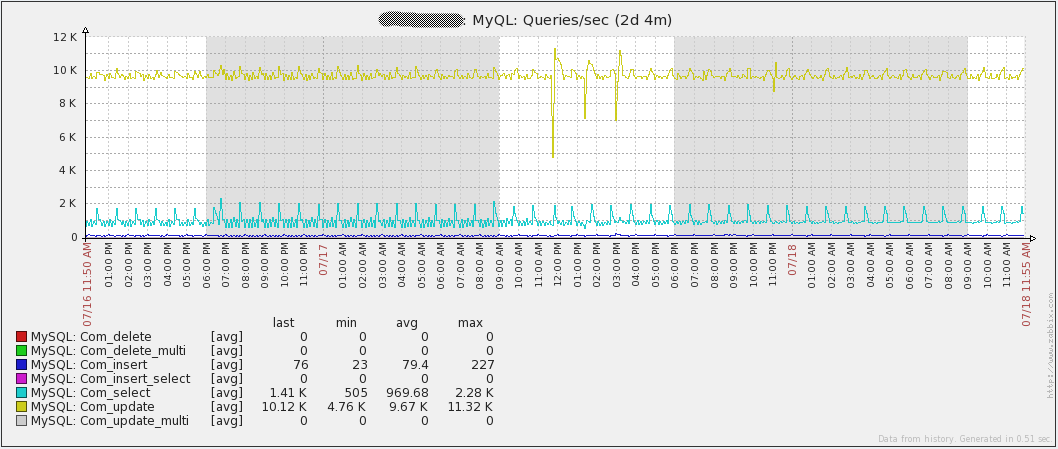
Note that the most “Com_update” requests. The reason lies in the fact that each value obtained results in an Update to the “items” table. Also, the database is basically write operations, so the MySQL query cache does not help. In fact, it may even be detrimental to performance, given that it will constantly have to mark requests as invalid.
Another issue for performance can be Zabbix Housekeeper. In large networks, it is strongly recommended to disable. To do this, set DisableHousekeeping = 1 in the config file. It is clear that without Housekeeping, old data (data elements, events, actions) will not be deleted from the database. Then removal can be organized through partitioning.
However, one of the limitations of MySQL 5.6.12 is that partitioning cannot be used in tables with foreign keys and they are just present almost everywhere in the Zabbiks database. But besides the history tables that we need. Partitioning gives us two advantages:
- All historical data tables are divided by day / week / month / etc. may be in separate files, which allows you to further delete the data without any consequences for the database. It is also very easy to understand how much data is collected for a certain period of time.
- After clearing the tables, InnoDB does not return space to the disk, keeping it for new data. As a result, with InnoDB it is impossible to clear disk space. In the case of partitioning, this is not a problem; space can be freed up by simply deleting old partitions.
About partitioning in Zabbiks it was already written on Habré.
Collect or listen
In Zabbiks, there are two methods for collecting data: active and passive: In the case of passive monitoring, Zabbiks the server itself polls the agents for Zabbiks, and in the case of the active one waits for Zabbix agents to connect to the server themselves. Zabbix trapper also falls under the active monitoring, since the initiation of sending remains on the side of the network node.
The difference in performance can be serious when choosing one or another method as the main one. Passive monitoring requires running processes on the Zabbiks server, which will regularly send a request to the Zabbiks agent and wait for a response, in some cases, waiting can drag on even up to a few seconds. Now multiply this time by at least a thousand servers, and it becomes clear that the “polling” can take time.
In the case of active monitoring of the polling processes, there is no server, and the server is in a state of waiting, when the agents themselves will start connecting to the Zabbix server in order to get a list of the data elements that need to be monitored.
Further, the agent will start collecting data items based on the interval received from the server and send them; the connection will be opened only when the agent has something to send. Thus, there is no need for verification prior to receiving data, which is present during passive monitoring. Conclusion: active monitoring increases the speed of data collection, which is required in our large network.
Monitoring of Zabbiks himself
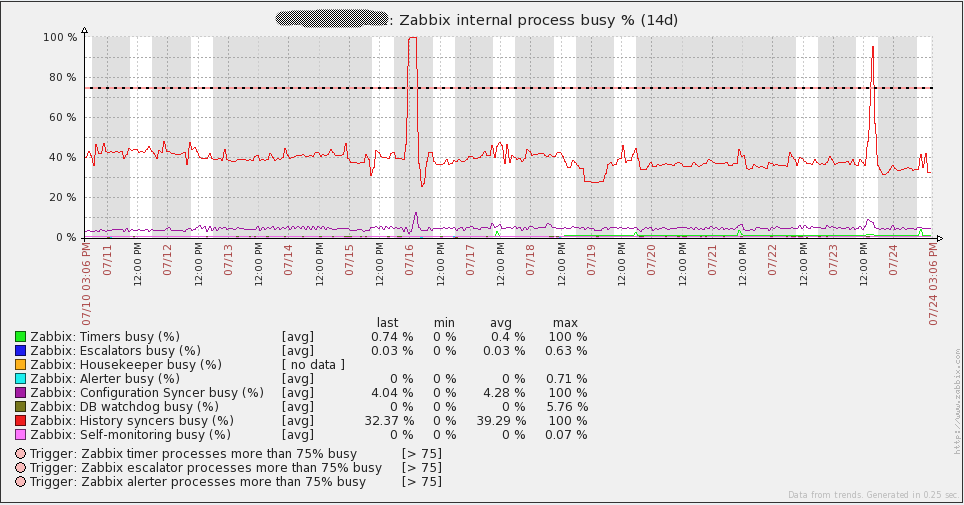
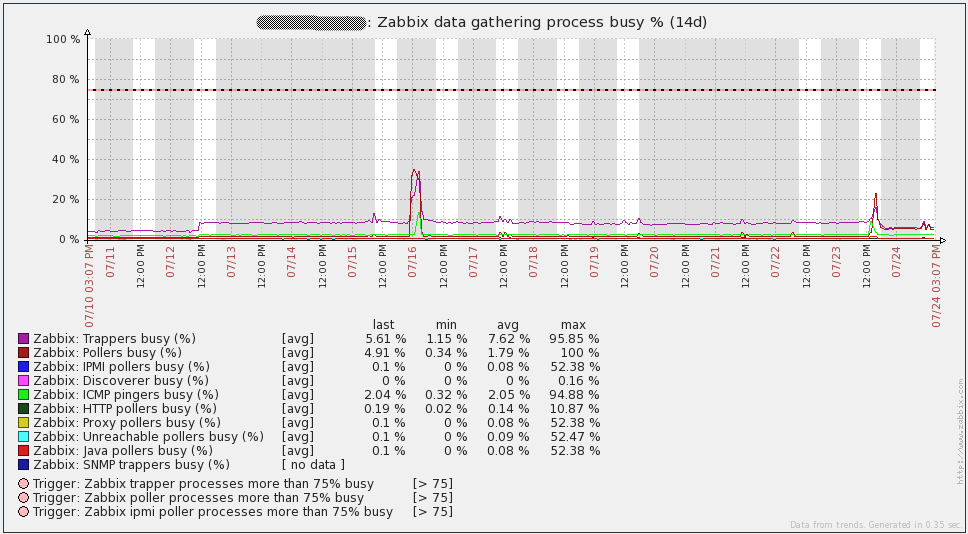
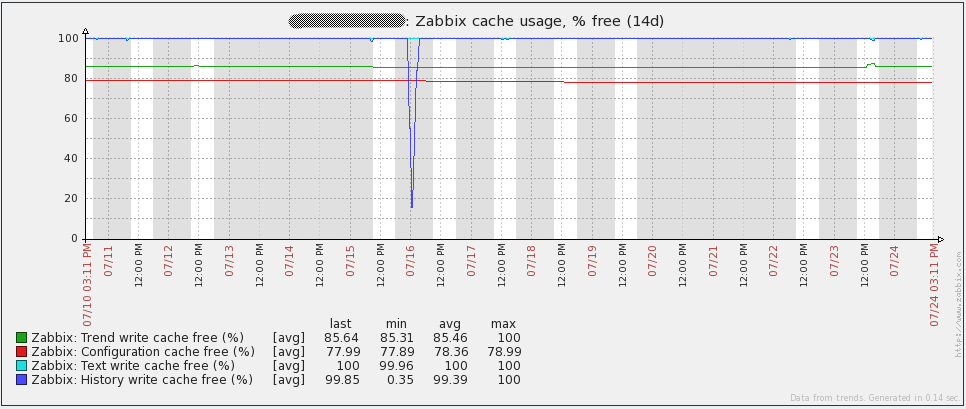
Without monitoring Zabbix itself, the effective operation of a large system is simply not possible - it is critically important to understand where the “plug” will occur when the system refuses to accept new data. Existing data elements for monitoring Zabbiks can be found here . In versions 2.x of Zabbiks, they were kindly assembled into a template for monitoring Zabbix server, provided out of the box. Use!
One useful metric is the free space in History Write Cache (HistoryCacheSize in the server config file). This parameter should always be close to 100%. If the cache is full - this means that Zabbix does not have time to add incoming data to the database.
Unfortunately, this parameter is not supported by Zabbix proxy. In addition, in Zabbix, there is no data item indicating how much data is waiting to be sent to the Zabbix server. However, this data element is easy to do yourself through a SQL query to the proxy database:
SELECT ((SELECT MAX(proxy_history.id) FROM proxy_history)-nextid) FROM ids WHERE field_name='history_lastid'The request will return the required number. If you have SQLite3 as a database for a Zabbix proxy, just add the following command as UserParameter in the Zabbix agent config file installed on the machine where the Zabbix proxy is spinning.
UserParameter=zabbix.proxy.items.sync.remaining,/usr/bin/sqlite3 /path/to/the/sqlite/database "SELECT ((SELECT MAX(proxy_history.id) FROM proxy_history)-nextid) FROM ids WHERE field_name='history_lastid'" 2>&1
Then just put the trigger, which will notify that the proxy can not cope:
{Hostname:zabbix.proxy.items.sync.remaining.min(10m)}>100000Total statistics
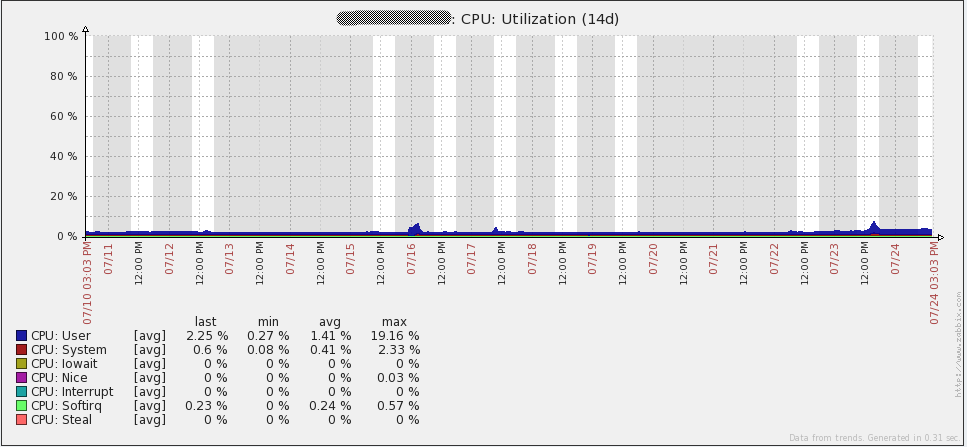
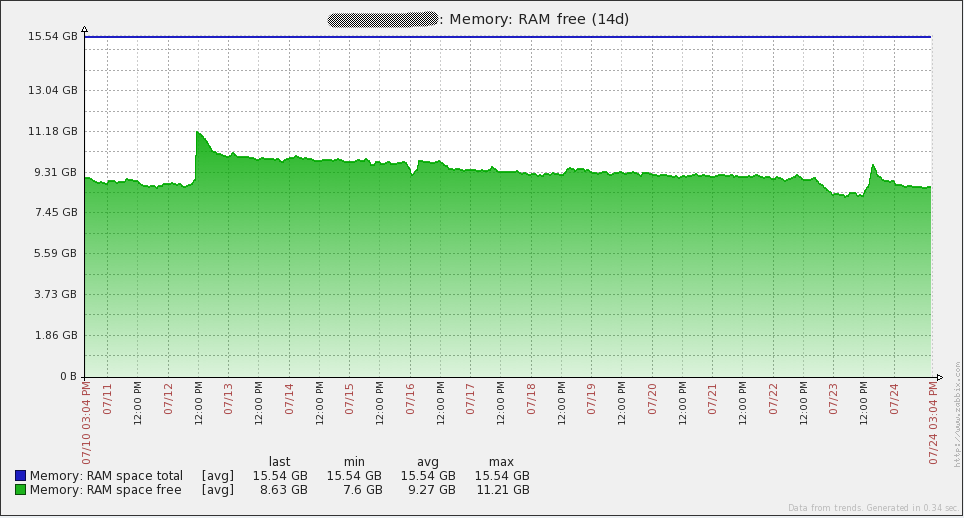
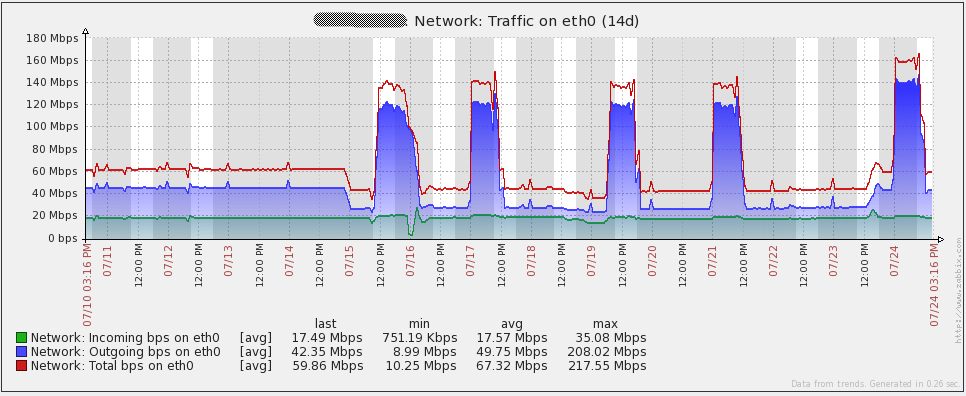
Finally, I suggest the system boot charts. Immediately I say that I do not know what happened on July 16 - I had to re-create all the proxy bases (SQLite at that time) to solve the problem. Since then I transferred all proxies to MySQL and the problem did not recur. The rest of the “irregularities” of the graphs coincide with the time of the load testing. In general, the graphs show that the iron used has a large margin of safety.

But the graphics from the database server. Traffic increments every day correspond to the time taken to dump (mysqldump). Also, the failure of July 16 on the query graph (qps) refers to the same problem that I described above.


Control
In total, the system uses 2 servers for Zabbix servers, 2 servers for MySQL, 16 virtual servers for Zabbix proxies, and thousands of servers monitored with Zabbix agents. With so many hosts, making changes by hands was out of the question. And the solution was a Git repository, to which all servers have access, and where I located all the configuration files, scripts, and everything else that needs to be distributed. Next, I wrote a script that is invoked through the UserParameter in the agent. After running the script, the server connects to the Git repository, downloads all the necessary files and updates, and then reboots the Zabbix agent / proxy / server if the config files have changes. Updating has become no more difficult than running zabbix_get!
Creating new network nodes manually via the web interface is also not our method, with so many servers. Our company has CMDB, which contains information about all the servers and services they provide. Therefore, another magic script collects information from the CMDB every hour and compares it with what is in Zabbix. On the findings of this comparison, the script removes / adds / enables / disables hosts, creates a group host, adds templates to hosts. All that remains to be done manually in this case is the implementation of a new type of trigger or data element. Unfortunately, these scripts are strongly tied to our systems, so I can not share them.
Open problems
Despite all the efforts that I have put in, there remains one significant problem that I just have to solve. The point is that when the system reaches 8000-9000NVPS, the backup MySQL database no longer keeps up with the main one, so in fact there is no fault tolerance.
I have ideas how this problem can be solved, but I have not had time to implement it:
- Use Linux-HA with DRBD for partitioning the database.
- LUN replication to a SAN with replication to another LUN
- Percona XtraDB cluster. In version 5.6 is still unavailable, so this will have to wait (as I wrote, there were performance problems in MySQL 5.5)
Links
- Zip file with all downloads from the article
- Large environment forum thread
- Zabbix server configuration documentation
- Zabbix proxy distributed monitoring documentation
- Zabbix active / passive item documentation
- Zabbix internal item documentation
- Zabbix blogpost on internal items
- Pacemaker / CMAN quickstart guide
- MySQL Pacemaker configuration guide
- MySQL Large Pages
- Partitioning the Zabbix database
Source: https://habr.com/ru/post/193472/
All Articles