Reports and charts for travis-ci and drone.io

In large projects, I have been used to the ci buns for quite some time now: running tests, reports, and automatic deployment. When developing small projects this is not enough. 1 and 3 covers travis-ci (well, or drone.io), but there is no visualization of the result.
And immediately came up with a simple solution:
- run analyzers on the ci side;
- send them to yourself;
- Parse the result and display beautifully.
And all this resulted in a small application - coviolations.io ( server and application sources), now it’s
- works with public and private repositories on github;
- works with travis-ci, drone.io and, if desired, with jenkins;
- can parse the result of pep8, sloccount, python unittest, pip-review and testem;
- can draw status dice
 ;
; - can comment on pool requests to public projects using travis-ci;
- does not know how to work with repositories of organizations.
How to connect to the project?
To connect to the project, you need to add a
.covio.yml file, for example: violations: pep8: pep8 . --exclude='*migrations*' sloccount: sloccount . pip_review: pip-review py_unittest: cat python_tests.txt testem: cat testem.out Where to the left is the name of the analyzer, and to the right is the command to get its output.
')
Include a project in project management and add a call to
covio .For
.travis.yml it will be: after_script: - pip install coviolations_app - covio And for droner.io and jenkins:
pip install coviolations_app COVIO_TOKEN="token" covio token can be obtained on the project page.No parser required analyzer?
If there is no parser needed, it is easy to do. The parser itself is just a function in python:
from tasks.const import STATUS_SUCCESS, STATUS_FAILED from .base import library @library.register(' ') def parse_violation(data): # data['raw'] - data['preview'] = data['raw'][:10] # data['prepared'] = data['raw'] + '!' # data['status'] = STATUS_SUCCESS # STATUS_FAILED, data['plot'] = { # 'lines_count': len(data['raw'].split('\n')), 'random_value': 5, } return data Available parsers are in violations .
What's inside?
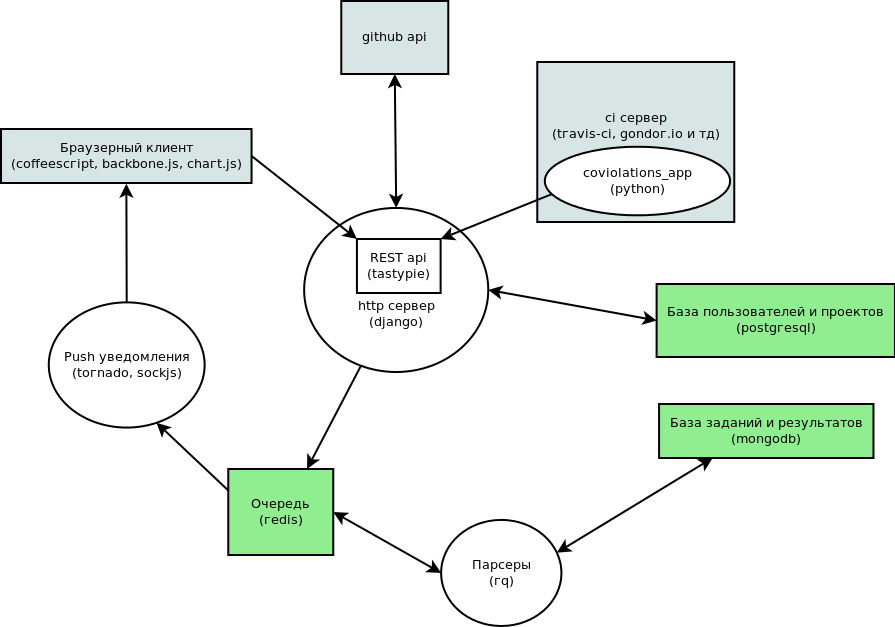
The server part is written in django , api is implemented through tastypie . Processing of the results of the analyzers occurs in a bundle of workers made with rq . All server-side communication takes place via redis . Data is stored in mongodb and postgresql . Browser client is written in coffeescript with backbone.js . Charts are drawn using chart.js . The client communicates with the server via rest api and sockjs .
How to deploy locally?
In order to deploy the local version, it is enough to clone the project, install the fabric and bower:
git clone https://github.com/nvbn/coviolations_web.git pip install fabric npm install bower Copy the settings file from
coviolations_web/settings/dist.py to coviolations_web/settings/local.py and fill it in. My local settings are in local_nvbn.py , the production settings are in local_production.py .And expand everything with:
fab install For verification, you can run tests with:
./manage.py test violations projects tasks services app push To run, you need to run (each command in a separate console):
./manage.py runserver ./manage.py runpush ./manage.py rqworker To send the results from
covio to a locally deployed instance, you need to add to .covio.yml : endpoint: http://localhost:8000/api/v1/tasks/ Plans
Now it is planned to add support for organizations' repositories, check pull requests with automatic commenting, and many-many parsers. I also want to make annotations to the code from the results of the analyzers, but this is most likely unrealistic.
Links
Source: https://habr.com/ru/post/193394/
All Articles