Emotional loyalty in the retail and service industries. Monitoring, diagnostics, management
This article continues a series of publications on the methods of performance management in the retail and service industries. In the article Retail. KPI management. Conversion I talked about the Tachometer Point of Sale concept, which allows to improve the work of sales assistants and increase conversion (the ratio of sales to the number of visitors). In this article I want to talk about the decision of the Loyalty Button , which is designed to improve the quality of customer service, increase their loyalty, and thus increase the number of customers and clients.
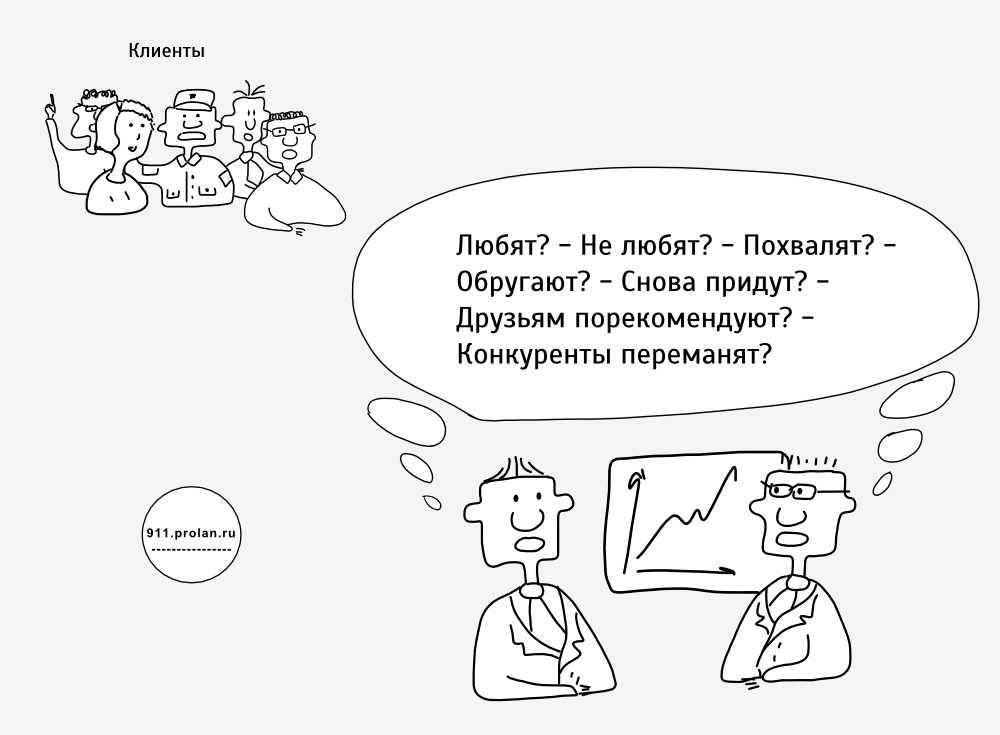
The fact that customer loyalty is important is an axiom. Like the fact that loyalty must be managed. However, loyalty management often understands only the introduction of bonus programs that motivate customers to make repeated purchases (economic loyalty). Raising emotional loyalty (as far as the client is devoted to a brand or company) is given significantly less attention. This is not very correct. First, if a customer buys only because of bonuses, and your competitors offer him the best bonuses, he may stop being your customer. Secondly, managing economic loyalty without controlling emotional loyalty is blindly managing, because Emotional loyalty is a good indicator of the quality of staff performance and the effectiveness of marketing campaigns, including bonus programs. And finally, the third and most important. Such a client will never tell his friends what a good store, bank, salon, clinic, etc. you have. In other words, he will not become a supplier of new customers for your business.
Today, the de facto standard for loyalty management is the concept of the Net Support Index ( Net Promoter Score , NPS) proposed by Fred Reicheld. However, this concept, like other solutions based on mass surveys and questionnaires (CSI, SERVQUAL, etc.), is poorly suited for retail. Therefore, we have taken courage and adapted the concept of NPS for use in the retail and services sector. Unlike NPS solutions, which are, in fact, CRM systems, the Loyalty Button is a monitoring system that can be effectively used to manage both loyalty and customer satisfaction and quality of service. In this article, I will talk about using the Loyalty Button to manage customer loyalty using the example of the ProLAN SLA-ON monitoring system.
')
At the end of the text will be made specific proposals for business and partners.
Quality of Service> Satisfaction> Loyalty
The logical connection between these indicators is as follows. Quality of service is most often understood as a subjective assessment of the quality of staff work. Good quality service is a necessary, but not sufficient condition for customer satisfaction. It is also important to distinguish between the subjective assessment and the actual quality of service: it is not the same thing, but it is necessary to control both. Satisfaction and loyalty are always only subjective assessments. Customer satisfaction is also a necessary, but not sufficient condition for their loyalty. In practice, these concepts are often equated to each other. It is not right. The difference was very well formulated by Geoffrey Gitomer in his book: “Customer satisfaction is nothing, customer loyalty is everything” (Customer Satisfaction is Worthless, Customer Loyalty is Priceless). Here is an excerpt from this wonderful book:
“ Who are satisfied buyers? These are buyers who have nothing against working with you. Their needs are met. The product was normal. The service was good. "Draft" in their souls left. They are satisfied (satisfied) with their purchases. They may or may not tell others about their impressions. May recommend you to other people, and may not recommend it. Their general opinion about you lies in the gap between neutral and positive, you do not associate them with negative impressions. This is not bad, but not good either.
Who are loyal buyers? These are buyers who are FULLY ENTUSED for working with you. Their needs are met and / or more than met. You have shown yourself from the BEST side. The service was GREAT. Buyers are delighted with the purchase. They are happy to talk about it. I am pleased to recommend you to others. Their general opinion of you is wonderful, you made an unforgettable impression. CLASS! "
Obviously, both are important. Customer satisfaction is an absolute comme il faut that is enshrined in ISO 9001: 2000, according to which each company must have a system that allows you to monitor customer satisfaction. Therefore, satisfaction management can be compared to an inflatable circle (or lifejacket) that helps your business stay afloat. But loyalty management is much more. It is an effective tool for increasing the number of customers and successful promotion in the market. Loyalty management can be compared with a motorboat, which not only keeps afloat, but also allows you to move quickly.
If for the same amount you are offered an inflatable circle and Ski Jet, what will you choose? The question is rhetorical. However, judging by the largest Russian banks, the quality of service today is paid much more attention than the management of loyalty or customer satisfaction.

Fig. 1. Question to experts: “How exactly will each of the banks use the information received and for what?”
Maybe they don’t need loyalty and customer satisfaction? Or they just do not know how to measure it?
Measuring Emotional Loyalty
We bring to your attention ProLAN push-button consoles that can be used not only to measure customer satisfaction and quality, but also to measure their emotional loyalty.

Fig.2. ProLAN Pushbutton Consoles
Panels can be desktop and floor, wire and wireless, two-button and three-button. The main thing is the question asked by the client. The client is not asked to “Rate the quality of service”, which is also possible, but “Would you recommend us to your friends?”.
It would seem a trifle, but, as they say in Odessa, two big differences. Readers familiar with the Net Promoter Score (NPS) concept have probably guessed that this is a modification of the key question of the NPS concept: “With what probability would you recommend our company to your friends?” This is a question, but no other. as shown by numerous studies of Fred Reicheld and his colleagues from the company Bain & Company, to the greatest extent (~ 80%) correlates with the economic behavior of the client.
If a client answers that he would recommend your company with a probability of 90% or 100%, then such clients are called promoters . These are customers who are not only fully satisfied with the quality of service (in the broad sense of the word), but will also recommend your company to their friends and acquaintances and, thus, attract new customers to your company. And, of course, most likely, they will come to you again. If with a probability of 60% or less, then such clients are called detractors (critics) . These are negatively-minded customers, who, firstly, they most likely will not come to you, secondly, they will tell their acquaintances about their negative experiences. Detractors - a headache for any company. If with a probability of 80% or 70%, then these are passive clients (neutrals) . To clients who, in general, are satisfied with everything, but are not yet ready to take on the reputational risks of recommending your company to your friends.
The net support index, which determines customer loyalty, is calculated as the share of promoters minus the share of detractors; see Figure 3.

Fig.3. Calculate Net Support Index. From the site www.netpromotersystem.com
As shown by numerous studies, the value of NPS is directly proportional to the profitability of a business. It is known that keeping an old client is about 5 times cheaper than finding a new one. In addition, loyal customers buy more, are less price-critical, require less resources, but most importantly, they are a regular supplier of new customers for your business. I have met very different numbers, what additional profit brings increased customer loyalty in various business areas. Such numbers can be found, for example, in Fred Reicheld’s Loyalty Effect. The numbers are really big. Not sure that Russian companies should use them as reference values. Nevertheless, it is obvious that NPS is the most important indicator, and it needs to be constantly monitored. For reference, NPS leaders of American business, according to Satmerix , range from 60% to 83%. The highest values in the banking sector - 83%, in motor insurance - 74%. Apple Computer Software - 68%. If you are not familiar with the concept of NPS, then I recommend to get acquainted with this concept in the original source (in English). If this is difficult, then I recommend reading the article by I.V. Chichmeli Concept of net support index (Net Promoter Score) . Unfortunately, there the emphasis is only on one component of the NPS concept (measuring), and only for financial retail. But the article is very correct and well written.
The concept of NPS is very widespread in the world, especially in the United States and Western Europe. Anyone who flew Western airlines (for example, EasyJet) or, while in Europe, used the services of a solid car service, must have tested it many times. In Russia, this concept is rarely used so far, and mainly in the form of survey services, where the client is asked, in particular: “With what probability would you recommend our company to your friends?” This is, of course, an important question, but The concept of NPS is not limited to conducting surveys. This, by the way, is a very common misconception. In fact, NPS is a customer relationship management technology based on regular (and on demand, for example, when a customer requests support) interviewing customers. Interviewing allows you to measure NPS, and obtain data to diagnose discontent. Interviewing is important, but not enough. To be effective, the concept of NPS must be embedded in the fabric of business processes. And this is more difficult, and with this we still have problems.
In retail, the concept of NPS is rarely used. This applies to all countries. The reason, in my opinion, is the difficulty of obtaining reliable results. The fact is that when conducting traditional surveys or questionnaires (used in the NSP) in retail, all samples are always shifted towards lower-income groups. It is known that middle class representatives (the most attractive target audience for most retailers) are not easy to motivate to answer questions. Usually when using NPS, questions are asked the next day. In retail, they should be asked immediately after the customer makes a purchase (because the company may not have customer contacts), which further aggravates the situation.
There are a few more questions that I would ask Fred Reicheld. For example, on what internal scale should I estimate the probability of a recommendation, and is this scale the same, for example, for Americans, Europeans, Japanese, and Russians. Or, for example, for a resident of Moscow and the Terrible? Something tells me that no. But after all, if someone makes a mistake of at least 10%, and indicates not 90%, but 80%, or not 70%, but 60%, then he will immediately fall into another category, for example, will not be a promoter, but a passive client . And that means the results are intolerable. How then do benchmarking? It is also not very clear which category should include customers who did not want to take part in the study (answer questions). It is obvious that the more such clients, the less reliable the results of the study. In addition, the refusal to take part in the study - also says something. However, I did not find any concrete and substantiated answers to these questions in the concept of NPS.
Button Loyalty vs. Net Promoter Score
For all these reasons, we took courage and, without changing the main thing, slightly changed the concept of NPS. Rather, they adapted it for use in retail. Adaptation is as follows:
- We believe that in conducting the study it is not enough to take into account only one indicator. In addition to the Emotional Loyalty Index (an analogue of NPS, the share of answers is YES minus the share of answers is NO), it is also necessary to take into account, firstly, what percentage of clients took part in the survey, secondly, what is the reliability of the information received; more details below.
- We believe that in retail, instead of: “How likely would you recommend us to your friends?” It is better to ask: “Would you recommend us to your friends?”. It is easier, and for many more understandable. Three answers: YES - promoter, NO - detractor (critic), DIFFICULT TO ANSWER - passive client (neutral). However, if someone wants to strictly follow the theory, he can use the traditional question; see more at the end of the article.
- The client should be relieved of the need to answer any questions, except one - the main one. First, “harassment” of questions is often perceived negatively. Why annoy a client once again, thereby reducing his loyalty? Secondly, to answer questions, the client needs to think, to strain. Not everyone loves it, especially when shopping. Therefore, it is likely that many will choose the first available answer, and then we wrestle with it ... Finally, it is expensive and difficult, and most importantly, in the retail sector, you can do without it.
When using the Loyalty Button, the client is asked only one main question. In parallel, with the help of special technical means and technologies, factors affecting loyalty (queue length, quality of service, etc.) are controlled. If it turns out that the client is not satisfied, then the subjective assessment of the client is compared with objective information obtained without the involvement of the client.
The Loyalty Button can be used to manage loyalty, as well as to manage customer satisfaction and quality. The transition from quality of service management to loyalty management is not just the replacement of leaflets with a question in an acrylic base that is part of a push-button console. This, above all, the definition of global factors affecting loyalty. For details, see below, in the section “Global factors (why don't they buy?)”.
Sometimes (for example, in financial retail) the Loyalty Button should be considered not as an alternative, but as an addition to traditional NPS systems. The Loyalty Button can be integrated with a CRM system. This will make it an additional source of information about loyalty drivers, which will increase the reactivity of loyalty management. Also, the Loyalty Button can be used as an effective diagnostic tool for "debriefing".
Consider now what constitutes a Loyalty Button from a technical point of view.
How it works

Fig.4. Architecture Loyalty Buttons
As I said earlier, the Loyalty Button is one of the applications of the monitoring system, in this case the ProLAN SLA-ON monitoring system. From the monitoring system familiar to any IT specialist, the Loyalty Button is distinguished by the presence of push-button consoles, software supporting them, a video surveillance system, a visitor counter, and integration with the accounting system. The last two components are important, but not necessary. Video surveillance system and visitor counter in most sales outlets are already available. Thus, by purchasing button consoles and the corresponding software, any monitoring system can be easily turned into a Loyalty Button. For details, see the solution description Loyalty Button .
Reliability, authenticity and once again reliability
Data reliability is a key issue, because if the data is unreliable, we can draw the wrong conclusions and make the wrong decisions. This is especially important in such a delicate area as personnel management. In the classic concept of NPS, accuracy is ensured by careful selection of focus groups — customers to be interviewed. In retail, we cannot prohibit visitors from point of sale from pressing buttons. Suppose a woman came to the bank with a child, the child sees a push-button control and, naturally, begins to press buttons. Or a group of teenagers come to the sports shop who just start making fun and pushing buttons. How should sellers act in such cases? Or another situation. Some seller, in order to increase his rating, asked his friends to take a walk around the store and, without buying anything, press the buttons.
If information received from customers is used to measure loyalty and / or to make management and personnel decisions, then the accuracy of this information should not be in doubt.
This can be done in only one way - by evaluating the reliability of the data obtained. If the accuracy is low, then either eliminate the data from the calculation of integral indicators (NPS, IEL, etc.), or, having reduced the sample, calculate the indicators only from verified data. Any other methods, such as installing video cameras (sellers will be afraid to wind up the results) or using CFM systems (assessment is tied to the ticket), etc., at best, can only reduce the amount of unreliable data.
To assess the credibility in the Loyalty Button metrics are used:
- Representativeness of the sample;
- Expert selection by promoters;
- Reliability of information about promoters;
- Expert sample by detractors;
- Reliability of information about detractors.
The representativeness of the sample is the ratio of the number of visitors to the point of sale who participated in the study (pressing the buttons) to the total number of visitors to the point of sale in the reporting period (determined using the counter of the number of visitors). For different points of sale set different threshold values of this indicator. For example, it can be 70% for a dental clinic, and 7% for a sports store. If the representativeness of the sample is less than the threshold value, then monitoring of emotional loyalty is poorly organized and the IEL results should not be used. The organization of loyalty monitoring should be the responsibility of the point of sale administrator with all the ensuing consequences.
To determine other indicators, the Expert Monitoring technology is used.
Expert Monitoring

Fig.5. The expert sets a confidence rating in the management console window.
At the point of sale installed video surveillance system. When a client, answering a question (“Would you recommend us to your friends?” Or “How did you like it?), Clicks the corresponding button, information about pressing (where, when, which button, etc.) is recorded in the database data. The keypad is located in the visibility of the camera, which saves the client's actions to a video archive. In the video archive image is tied to time.
An expert is used to assess the reliability of the information. This can be a point of sale administrator or an employee of a consulting company. The expert is granted access to the video archive and a special console (see Figure 5), which displays information on all button presses (events). Knowing exactly the time when the event occurred (this time is displayed on the console), and having access to the video archive, the Expert qualifies the corresponding event. If it really took place and does not cause any doubts in the Expert, he assigns it the value 1, otherwise - 0. To assess the reliability of the data there is no need to qualify all the events. It is enough to qualify only a part of them (Expert Sampling).
The number of clicks of the green buttons that the Expert has analyzed is the indicator “Expert selection by promoters”. The number of clicks of the green buttons, which the Expert has qualified as no doubt, is the indicator “Reliability of information about promoters”. For example, if the Expert viewed 30 clicks of the green buttons, and 15 of them didn’t cause him to doubt, the indicator “Expert selection by promoters” = 30, “Reliability of information about promoters” = 50%. Indicators: "Expert sampling by detractors" and "Reliability of information about detractors" are calculated in the same way (instead of pressing the green buttons, pressing the red buttons). The obtained confidence indicators will be automatically applied to all events. In order for information to be considered reliable, Expert sampling must be at least 50, and Reliability of information must be at least 90%.
An example of a tactical report on emotional customer loyalty
Information on all clicks, expert estimates, information on the number of visitors (measured by the visitors counter), information on the number of sales (imported from the accounting system) are automatically recorded in the consolidated database. This information is processed there and various reports are automatically generated. One of the reports supported by all Loyalty Button models is a tactical report in MS Excel format. (Also, strategic reports are supported, when data are statistically processed, Base Lines are built, etc.). An example of a tactical report in MS Excel format is shown below.

Fig.6. Sample Customer Loyalty Report
| Metrics | Description |
|---|---|
| Visitors | The absolute number of visitors during the reporting period (measured by the visitors counter) |
| Sales | The absolute number of sales for the reporting period (imported from the accounting system) |
| IEL (%) | Emotional Loyalty Index (IEL). IEL = 100% * (the proportion of pressing the GREEN buttons - the proportion of pressing the RED buttons) |
| Representative sample | The ratio of the number of clicks of all buttons (RED, GREEN, GRAY) to the total number of visitors to the point of sale during the reporting period |
| Promoters | The absolute number of clicks on the GREEN buttons for the reporting period |
| Detractors (critics) | The absolute number of key presses RED buttons for the reporting period |
| Passive clients (neutrals) | The absolute number of pressing the gray buttons for the reporting period |
| Expert sample by promoter | The absolute number of clicks on the GREEN buttons checked by the Expert during the reporting period. |
| Reliability of information about promoters | The ratio of the number of clicks of the GREEN buttons, recognized by the Expert as reliable, to the total number of clicks of the GREEN buttons, checked by the Expert during the reporting period |
| Expert sample by detractors | The absolute number of clicks on the RED buttons checked by the Expert during the reporting period |
| Reliability of information about detractors | The ratio of the number of clicks of the RED buttons, recognized by the Expert as reliable, to the total number of clicks of the RED buttons, checked by the Expert during the reporting period |
| Share of promoters | The ratio of the number of clicks of the GREEN buttons to the total number of clicks of all the buttons (RED, GREEN, GRAY) for the reporting period |
| Share of detractors | (, , ) |
| (, , ) | |
| / | |
| / | |
| / | |
| / | |
| / | |
| / |

, , , -, , -, . , , , , .
, . , . . , - , , . , , .. 20- . ? , . : CRM- ( ), ( ), .. , , . , .. . ( ..), ? . , , ? . .
, , -, , -, , ( ). , , , .
Fig.7.
. CFM- (Customer Flow Management, , Q-Matic ), ( ), . , , -, , -, «time to value». .
: . . – ProLAN, , . .
| ( ) | |
|---|---|
| (-, ..). , , (, , « » ..) | + |
| ( + - + ) | |
| - - | - + |
| ( ) | |
| + |
, .
1. ( )
– . . – , (. ). – , , , (, ), . , , , , . 0 5 ( 0/1, ). , , 5, – 4, – 3, – 2, – 1. ( , ), 0. , . . , , .
( ..), . .
| Visitors | ( ) |
| ( ), | |
| Sales | , ( ) |
| (%) | (). , , * 100% |
| (%) | (). , , , * 100% |
| , | |
| ( ), | |
| Quality | , |
| (%) | , * 100% |
| ( ), , | |
| . ( ) , ( ), | |
2.
, , , , . ( -) . .
- SelfTrace, , -, , . , . , , -. , , , - -, .. , , , , - CRM- 20 , .
3.
, – . , CFM- ( ). . , CFM- , : + - + . : .
: , , , . , , , , .
, ( ). ProLAN, .. , , . , , . , : . : , , , , . dashboards , . , . , . , .
. , . - , , : « ». .
4. - -
, - - - . -, , , . . -, ProLAN, , , - ( , , .., . – ), - (. ). -, , - -, , , . , , , -, , Internet, .
5.
, , (« »), , , +35 oC .. , , , .
- ( ) , , . , . , , , - , . (, , ), « ». USB-, , , .

Fig.8.
, « », « » « » . Those. , , , . , , «», « » « » . , , - (CRM, ..), « » . , .. «» , , , .
, , , «». , , -, , -, . - -, , ( ) . , - ( ). .
( ?)
– , . , , . , / , , . , , , .
, , , . , NPS, , , , . NPS «close the loop». , -.
, !
. , , , , ( , ..). , 5 , . ProLAN: , , .

.9.
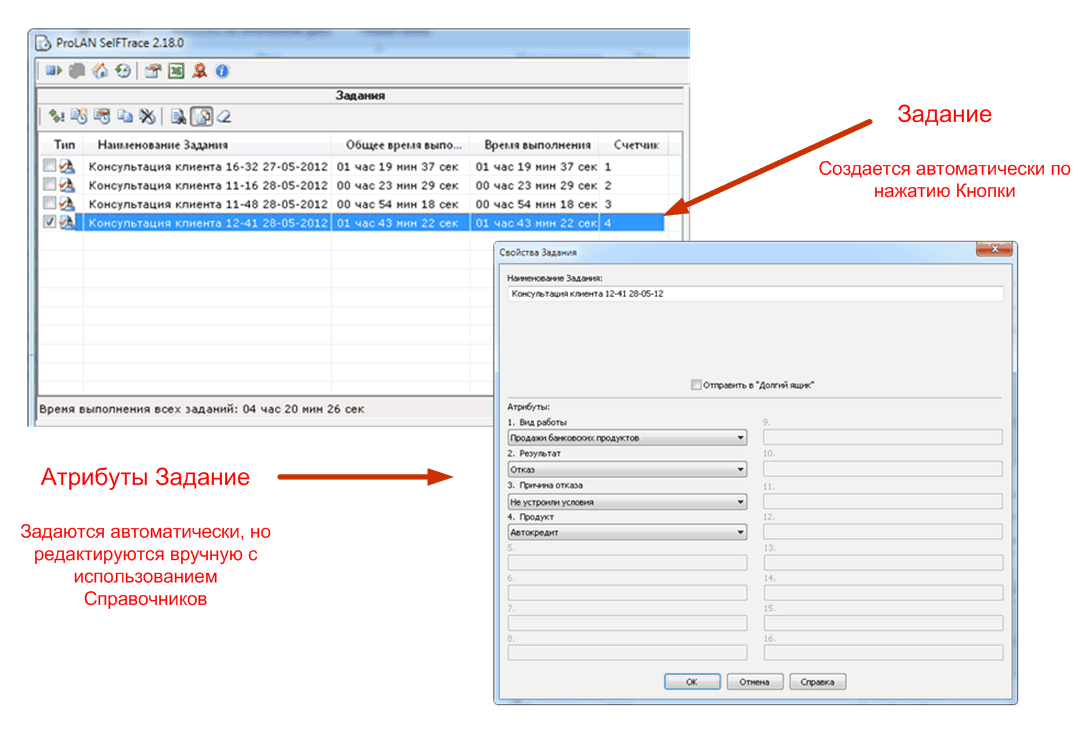
, , , , (, ). EPM-Agent Plus, , , . , . , , – EPM-Agent Plus SelfTrace ( ).
SelfTrace – . EPM-Agent Plus SelfTrace , , , SelfTrace . , , « 12-41 28-05-2012»). , . . , « » : « ». , , .
.10. SelfTrace
, ( ), ( – ), . , , «» (, ). , , «» (, ). , , « » (, ). , . . , , - ( ) , - , , . , . , , Activity Based Costing. -: «» .
«»
«» , «». , NPS, :
- : « ?». , . 11.
- , .

Fig.11. ProLAN-202, NPS
, 60% , SMS- . . , , , . , «» . , , , ( ). . , , , .
NPS. , . , , , ( ). What do you think?
Instead of conclusion

Fig.12. Loyalty Button - Open Solution
The Loyalty Button is more than just a good tool for managing the quality of customer service, customer satisfaction, and satisfaction. It is also an effective tool for the provision of professional services in these areas. To effectively manage the quality of service, satisfaction, loyalty, you need to know not only “as it is”, but also “as it should.” And for this you need benchmarking - comparing the results for different companies of the same type of activity.
Two specific sentences:
- Want to manage the quality of service in your sales offices? Do you want to monitor the subjective assessment of the quality of service of their clients? Want to effectively manage their loyalty? Try our solutions in practice. To do this, fill out the form here or contact us in any other way.
- Do you work in an IT or consulting company? We offer to become our partner. To do this, fill out the form here .
Need help - contact ProLAN.
Source: https://habr.com/ru/post/193066/
All Articles