Business plan template (financial model) studios / agencies
Hi, Habr!
As part of our special project with NetCat for web studios and agencies, we prepared a lot of material on the financial model of the studio with a bunch of KPIs, developed a real sample - and offer to discuss it. This is an exclusive material; I have never published this template anywhere before and have not spoken on this topic.
I do not claim that the approach outlined below is the only correct one and is a “silver bullet”. Of course, there are many other options for organizing a model, but most companies keep their format in the strictest confidence. I personally use such a common organization of a business plan for all my projects in combat conditions - of course, with other KPIs and formulas, detailing, etc.
')
This business plan, despite the fact that it looks quite difficult, in fact, is a very simplified model. We made a number of assumptions and simplifications in order to show in a simple way how the basic values depend on each other. The “combat” financial models of real agencies, of course, are even more complex.
I hope that you will try to “play” with the values - changing the constants and indicators that are fed to the input “by hand” - and see how the dynamics of the company’s development change.
In our model, we consider a small studio of 6 people, which is engaged only in the development of sites and their support. For the year reflected in the plan, our company grows to 15 employees and increases its turnover more than 3 times. One of the goals of our plan was to show that this is quite possible - without monstrous investment in marketing, and without raising the studio price tag by an order of magnitude.
Download sample (xls) >>
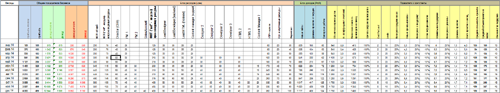
Vertically we have different blocks - total, expenses, income, indicators. The rows contain the development plan of the studio for 1 year, broken down by months. All monetary values are in thousands of rubles.
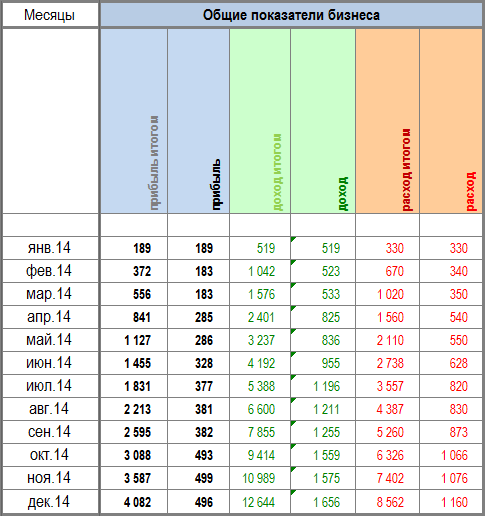
In the first block, the general values are indicated - consumption, income and profit. Consumption and income are obtained by a simple sum of indicators in the corresponding blocks. Everything is clear, we will not dwell in detail.
Let us examine in more detail the main items of expenditure studio:
Thus, from the sum of these indicators we get the total volume of expenses and the volume of production available to us. We give these indicators as a goal - we want to grow to such values in the framework of the plan, while maintaining the company's profitability and having a rigidly fixed marketing budget.
Go to the income unit. It is directly connected with the following block - the main indicators. All items of income of our studio are divided into three types:
Probably one of the most important blocks of the plan. Let's take a closer look at what and how. All these values somehow affect the income unit.
This model is suitable for a simple calculation of the plan of a small studio. It is very important to understand which values we give "at the entrance", and which values we calculate using average indicators and sales funnels.
Now we have applied for input costs (staff growth) and marketing - as a result, we calculated the average cost of the project and the amount of labor costs. Could do the opposite - and count marketing. We could apply marketing and average cost at the entrance - and see what production resources we would need.
Work on the studio's battle plan is in many respects a meditative occupation. You put the coefficients change them, see what comes out, calculate the different options.
Of course, the sample presented is a blank only. The real plan will be more difficult. Something you remove, add something. Remove assumptions that we made in our model.
It is equally important to generate reports on the fact - in many respects, after analyzing them, you will be able to adjust the model, clarify the indicators given by "hands" - and form a suitable combat option that will allow you to effectively develop your digital business.
We also filmed a video lecture on a business plan; it complements this material well. To watch this video (as well as other lectures of the cycle) - register at http://promo.netcat.ru . It's free.
I hope that the discussion in the comments will be even more interesting than the material itself. Write =)
Sincerely, Andrei Terekhov
As part of our special project with NetCat for web studios and agencies, we prepared a lot of material on the financial model of the studio with a bunch of KPIs, developed a real sample - and offer to discuss it. This is an exclusive material; I have never published this template anywhere before and have not spoken on this topic.
I do not claim that the approach outlined below is the only correct one and is a “silver bullet”. Of course, there are many other options for organizing a model, but most companies keep their format in the strictest confidence. I personally use such a common organization of a business plan for all my projects in combat conditions - of course, with other KPIs and formulas, detailing, etc.
')
Introductory
This business plan, despite the fact that it looks quite difficult, in fact, is a very simplified model. We made a number of assumptions and simplifications in order to show in a simple way how the basic values depend on each other. The “combat” financial models of real agencies, of course, are even more complex.
I hope that you will try to “play” with the values - changing the constants and indicators that are fed to the input “by hand” - and see how the dynamics of the company’s development change.
In our model, we consider a small studio of 6 people, which is engaged only in the development of sites and their support. For the year reflected in the plan, our company grows to 15 employees and increases its turnover more than 3 times. One of the goals of our plan was to show that this is quite possible - without monstrous investment in marketing, and without raising the studio price tag by an order of magnitude.
The assumptions I mentioned above:
- Our studio makes projects lasting for 1 month. It is clear that in reality projects last for different times, and the structure of studio services is much more complicated.
- Revenues from support (subscriptions) do not require additional production resources. It is clear that in reality it almost never happens, but again, we simplify the situation a little.
- We have allowed fractional values of the number of projects.
- Our studio has no cash breaks. Everyone pays on time.
- Our studio sells 100% of its resources. So we built our model. We gave “in manual mode” the values of production volume and marketing budget. As a result, the cost of a typical project and the average labor costs for a project became dependent parameters. We just wanted to show that with a 100% production load and a high growth rate, the key indicators will not cause anything catastrophic.
- It was possible to do the opposite - zafikisirovat cost and labor costs for the average project - and run the formula in reverse mode, considering what marketing costs we would need to sell 100% of the resources. We recommend doing this experiment yourself.
- Our studio does not pledge risks.
So, let's analyze our model in detail.
Download sample (xls) >>
Vertically we have different blocks - total, expenses, income, indicators. The rows contain the development plan of the studio for 1 year, broken down by months. All monetary values are in thousands of rubles.
In the first block, the general values are indicated - consumption, income and profit. Consumption and income are obtained by a simple sum of indicators in the corresponding blocks. Everything is clear, we will not dwell in detail.
Expenditure block
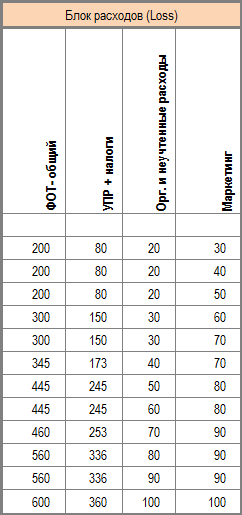
Let us examine in more detail the main items of expenditure studio:
- PHT - non-producing resources . This is the director and managers - those employees whose time we do not sell to the client. At the beginning of the calendar year there are two of them - the director and the project manager, then another project manager and a person for the role of account / sales are added to relieve the director.
In the cells are the salaries of employees "at hand". Rather modest sums suggest that our model is more suitable for a regional studio. - PHT - producing resources . Employees whose time we sell to a customer. We start with a designer, developer, technologist and content manager. During the year, their salaries grow. Also, over the course of the year, two more designers, a developer, a layout designer, and another content manager are added to them.
- Total payroll - the amount of salaries of producing and non-producing employees - the two previous indicators. Detailing on the photo can be minimized so as not to interfere (plus sign above the block).
- UPR + taxes . Some kind of consolidated value, where we lay taxes, office rent, accounting services and other semi-fixed costs. To simplify the model, we put a direct dependence of this indicator on the total payroll of employees (they are, indeed, closely related). We start with a rather low ratio - 40% of the payroll, and by the end of the year our costs increase - and we pay 60% of payroll for this item.
- Organizational and unreported expenses . Put down the values with your hands, based on the overall adequacy of what is happening.
- Marketing In this model, we give the values of the marketing budget by hand. As a result, given the need to sell 100% of the resources, the indicators of the cost of the site and the labor costs of the site change. You can go to the turnover - fix typical costs - and see what kind of marketing budget is required to achieve revenue goals. As you can see in our model, the marketing budget does not grow very quickly: from 30 thousand rubles a month to 100.
Thus, from the sum of these indicators we get the total volume of expenses and the volume of production available to us. We give these indicators as a goal - we want to grow to such values in the framework of the plan, while maintaining the company's profitability and having a rigidly fixed marketing budget.
Income unit
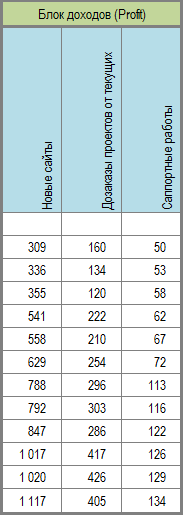
Go to the income unit. It is directly connected with the following block - the main indicators. All items of income of our studio are divided into three types:
- New projects (from new customers who come to us for our marketing activities). The amount is equal to the number of new customers multiplied by the average cost of the site.
- Additional orders from current customers . These are projects that we sold with the help of our adhesive customer service already for current customers who are on our support. The value is equal to the number of additional orders multiplied by the average cost of the site.
- Support Revenue from support subscriptions. Equal to the product of the number of customers on the support of the cost of the subscription.
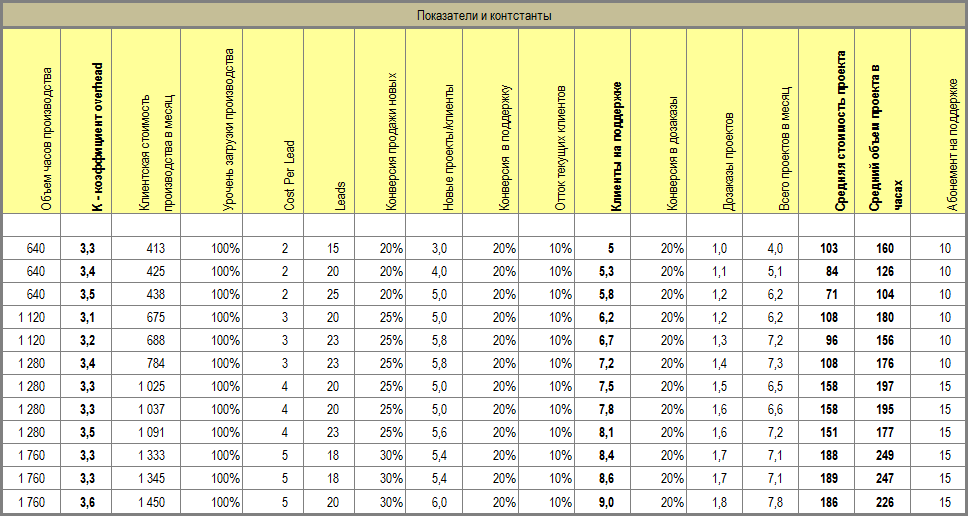
Constants and indicators
Probably one of the most important blocks of the plan. Let's take a closer look at what and how. All these values somehow affect the income unit.
- Production volume (in hours) is an average figure, the number of current producing employees, multiplied by 160 hours per month.
- K - overhead coefficient . One of the most important KPI studios. It shows what ratio we must multiply employee salaries in order to remain in profit. Those. if we pay the designer hands on 1 ruble per hour, and K = 3, then we must sell the client’s hour of this designer for 3 rubles.
It is considered K as follows: We take the total amount of expenses of the company, divide it by the share of the payroll of generating resources and multiply by 1.25 - the desired rate of profit of our company. The coefficient arrived is sewn up a formula and does not change during the year.
It is clearly seen that even with such rapid growth, K is within acceptable limits for the market - in the range from K = 3.3 to K = 3.6. - Customer cost per month . The fact that we need to close the works to sell 100% of our resources. It is considered to be the multiplication of the FOT of the producing resources by the factor K.
- Production load level . In our model - 100%, the value is not specifically used anywhere.
- Cost Per Lead . Begins a block of marketing indicators. The cost of a lead is the average value of the cost of attracting a high-quality client application for our services (with which presale can be continued). The value is handed out and growing throughout the year. The range from 2 to 5 thousand rubles for a quality lead is an entirely achievable indicator for the market (taking into account the low price segment in which our studio operates).
- Leads . The number of these most client applications. Considered by dividing the marketing budget by the cost of the lead.
- Conversion of sales of new customers . So, with what probability we sell the project. Values are served by hands and grow throughout the year (our competence grows). The conversion range of 20% -30% is achievable, given that we only write high-quality customer messages to the leads.
- New projects . Number of new projects / clients per month. It is considered as multiplying the number of leads by the conversion of sales of new customers. For the year, the value doubles - from 3 to 6.
- Conversion in support. So, with what probability the client after the creation of the first project becomes our current one, the subscription will pay and with some probability to order new projects. The value is served by hand. 20% is quite an average figure for a segment.
- Churn Rate is an indicator of churn. What percentage of our current customers will leave us within a month. This is inevitable, and 10% is an acceptable value for the market.
- Customers in support . The number of our current customers. The values of the first month are filed by hands - we start with 5 current clients. Further, the quantity is calculated as follows: We take into account the outflow from the database by the value of the next month (-10% every month) and add the number of new customers. This is one of the most important indicators. We see that according to our plan it grows from 5 to 9 regular customers.
- Conversion to reorder orders . The likelihood that our current client will order a new project for us this month. Served by hand. 20% is a good indicator for the market (slightly optimistic).
- Project reorders . The number of projects from current customers. The product of the number of clients to support for the conversion into additional orders.
- Total projects per month. How much our studio does projects per month. The most important indicator is equal to the sum of new and additional orders. Grows during the year from 4 to 8 projects. It is an achievable figure. Given that we make small sites. Recall that in our assumptions, we believe that the production of the project takes only a month.
- The average cost of the project . We calculate this indicator dynamically, given that we sell 100% of the resources and have a fixed budget for marketing. The cost is equal to the total customer cost per month divided by the number of projects. We see that the range varies from 100 to almost 200 thousand for the project. For a small site in the regions - quite ok.
- The average project size in hours . How well do we work on the project? The value is equal to the total production in hours divided by the number of projects. The range of 160 - 230 hours is quite acceptable (considering the overlapping stages), and we see that labor costs are growing (this, among other things, will allow us to sell more expensive, as the plan requires).
- Subscription support . The minimum amount of funds that current customers pay for the service in our company. Served by hand and grows from 10 to 15 thousand
Application
This model is suitable for a simple calculation of the plan of a small studio. It is very important to understand which values we give "at the entrance", and which values we calculate using average indicators and sales funnels.
Now we have applied for input costs (staff growth) and marketing - as a result, we calculated the average cost of the project and the amount of labor costs. Could do the opposite - and count marketing. We could apply marketing and average cost at the entrance - and see what production resources we would need.
Work on the studio's battle plan is in many respects a meditative occupation. You put the coefficients change them, see what comes out, calculate the different options.
Of course, the sample presented is a blank only. The real plan will be more difficult. Something you remove, add something. Remove assumptions that we made in our model.
It is equally important to generate reports on the fact - in many respects, after analyzing them, you will be able to adjust the model, clarify the indicators given by "hands" - and form a suitable combat option that will allow you to effectively develop your digital business.
Conclusion
We also filmed a video lecture on a business plan; it complements this material well. To watch this video (as well as other lectures of the cycle) - register at http://promo.netcat.ru . It's free.
I hope that the discussion in the comments will be even more interesting than the material itself. Write =)
Sincerely, Andrei Terekhov
Source: https://habr.com/ru/post/192754/
All Articles