Huawei Tecal ES3000: a great combination of price and quality in the PCI-e SSD camp
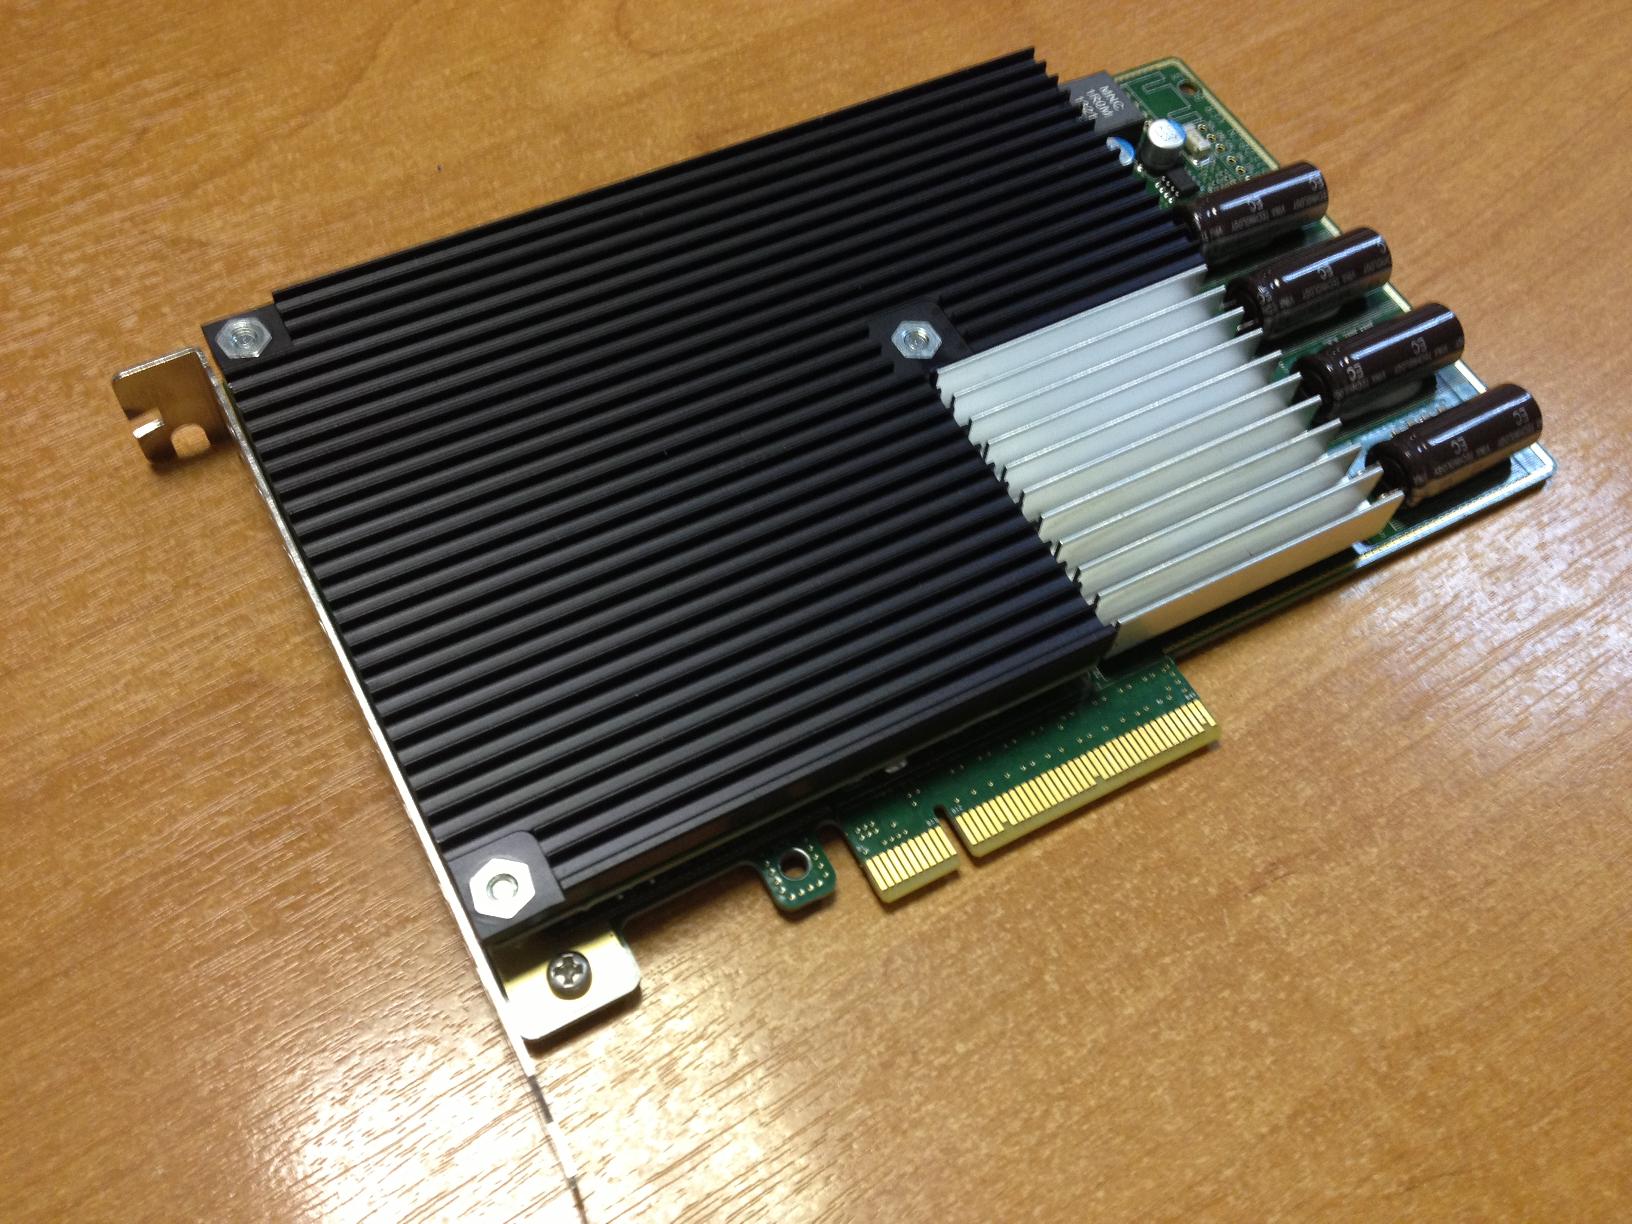
We continue to acquaint you with various PCI-E SSD devices that appear on the market more and more often, which cannot but please the end customer, because the higher the competition, the lower the cost, and each manufacturer tries to somehow distinguish its product from the rest . Today, the Huawei Tecal ES3000 card came to our test, as our communication showed - the card has a number of interesting solutions, and it also showed itself extremely well in tests, when compared with competitors. But first, a few words about the card itself and its "chips".
')
For a start, let's turn to the specifications stated by the manufacturer.
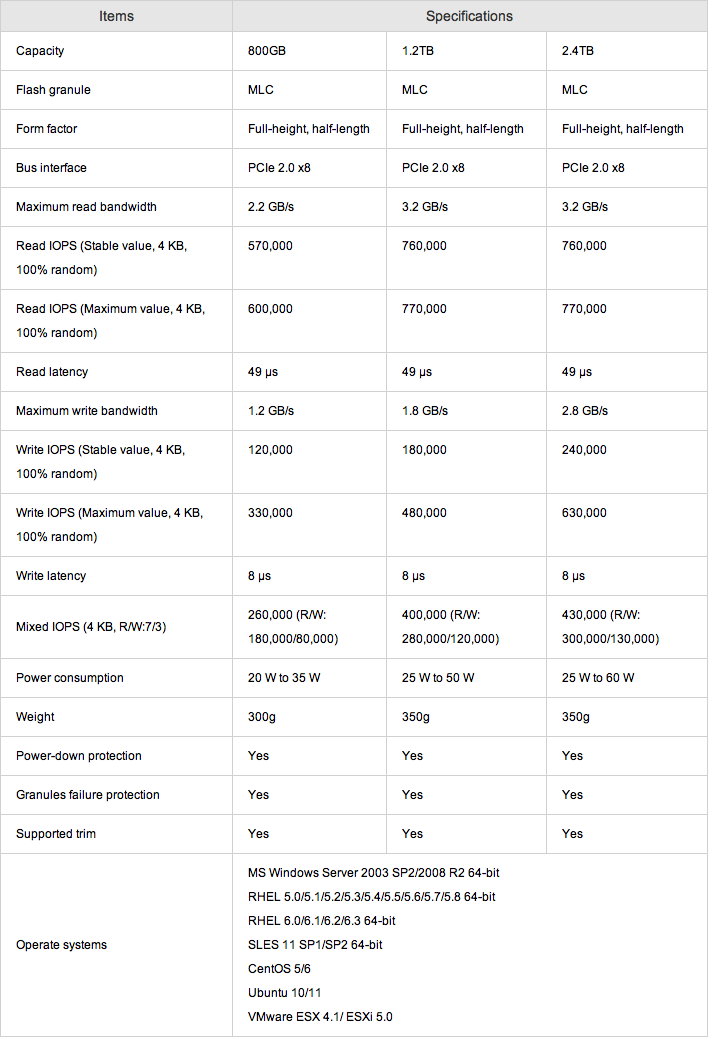
The first thing that catches your eye when looking at the card is four capacitors, which are designed to save data in case of a power failure on the server, which discharge time is about 1 second, which exceeds 100ms needed to clear the data from the buffer.
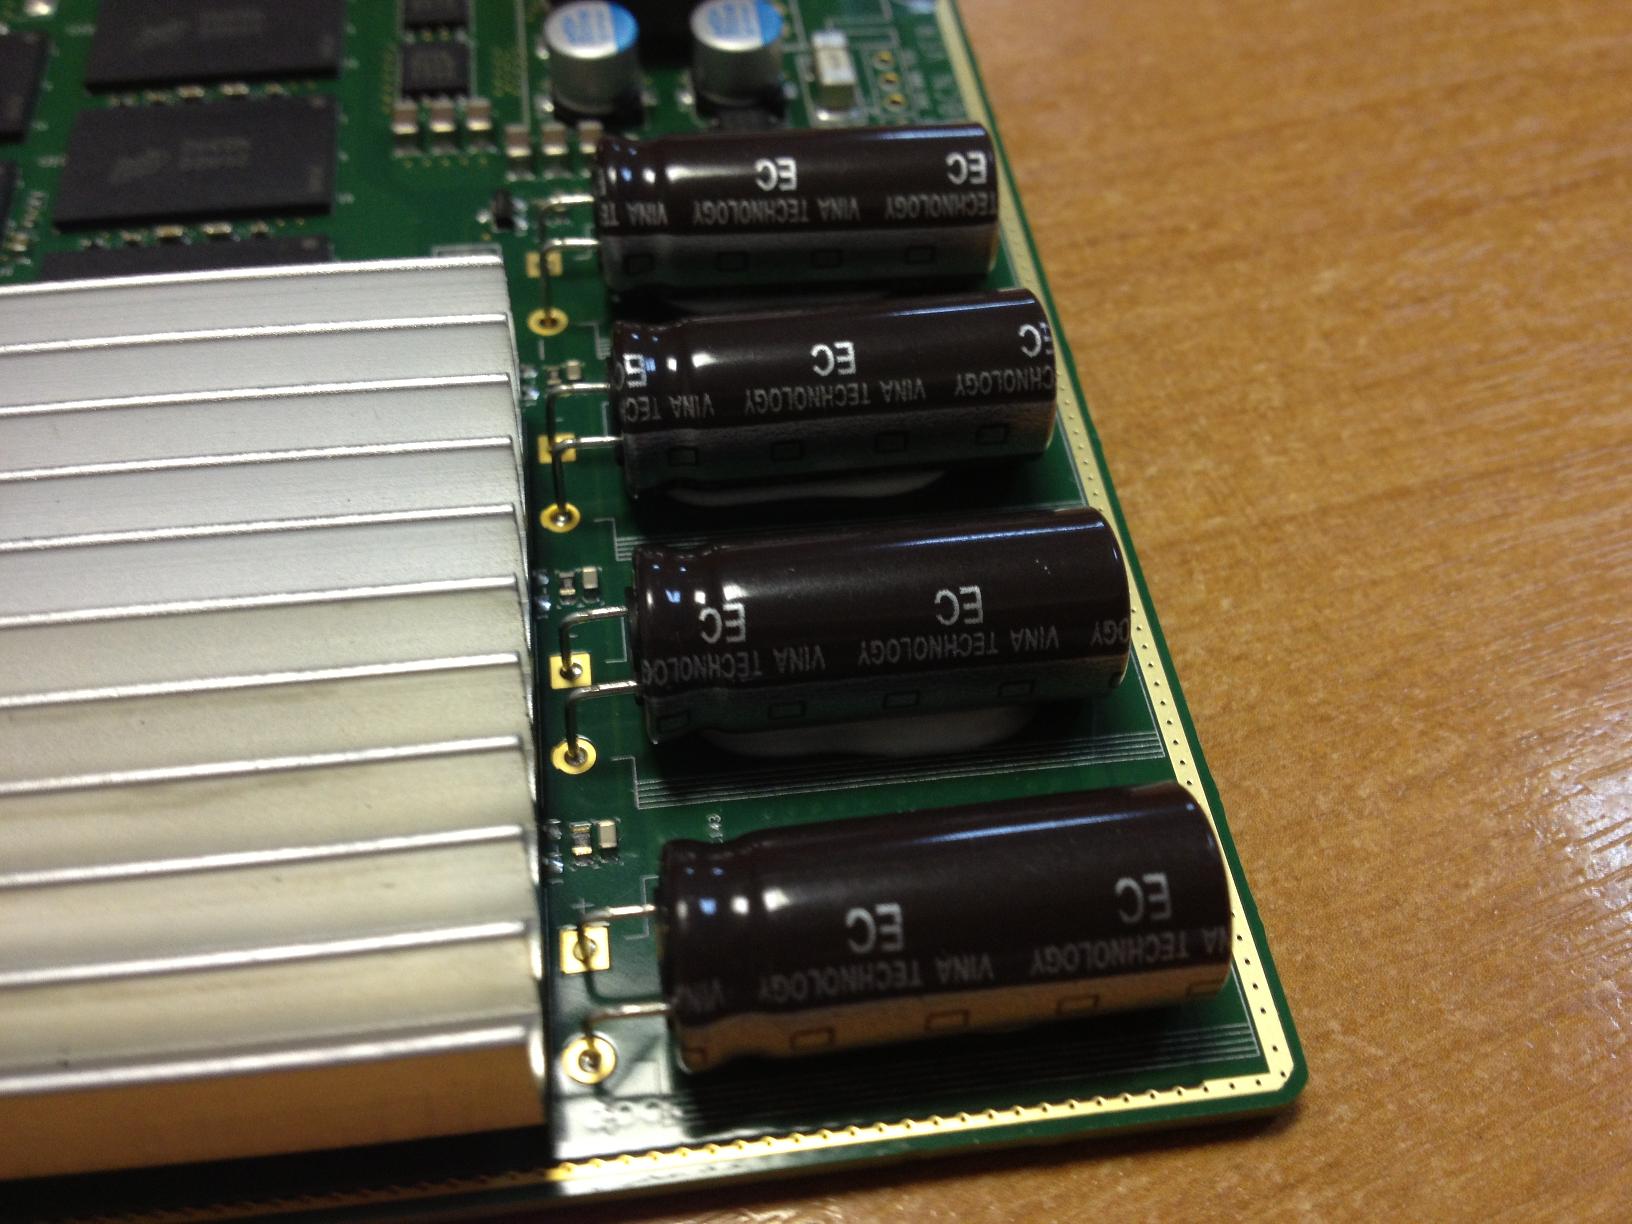
A special feature is the technical performance of the card - it contains three FPGAs, which are located on two boards. The first board carries the PCI-E interface, one controller and a set of memory, as well as capacitors, providing data protection in case of power failure. The second board contains on itself 2 more controllers and two sets of memory.
The board provides the user with a single section consisting of these “sets” of memory and there is no need to use a soft-raid, as would be the case with the ioDrive 2 Duo, in order to get the maximum amount. The card uses Micron memory.

In addition, the card uses ECC and RAID5 technologies to correct errors, which allows to extend the life of the drive. Depending on the size of the drive, the manufacturer guarantees a recording capacity of 6.4PB, 9.5PB and 19.1PB, respectively, for 800GB, 1.2TB and 2.4TB cards. The card also supports TRIM technology.
After getting acquainted with the theoretical part, we already scratched our hands as soon as possible to install the board in our test server and check what it can do in practice, so we turn to the most interesting part - tests.
The configuration of the test stand with us remained the same:
Platform - HP ProLiant DL380 G7
Processor - Xeon E5606
Memory - 8 GB
Hard drives - 3xSAS 146GB 10k
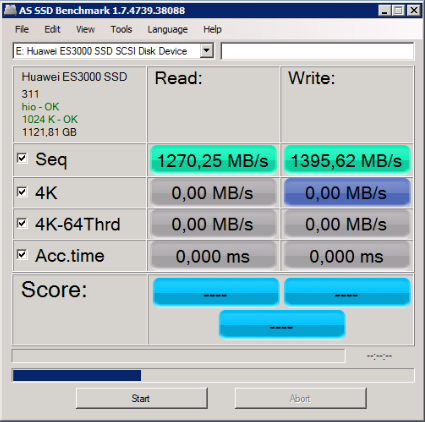
The test suite also did not undergo any changes, except for the fact that the card could not be verified using the AS SSD Benchmark, it completely refused to work further after the sequential write / read test. And in the future we plan to expand our reviews with the help of Sysbench fileio.
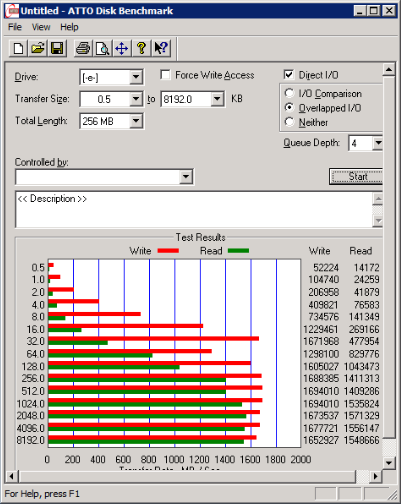
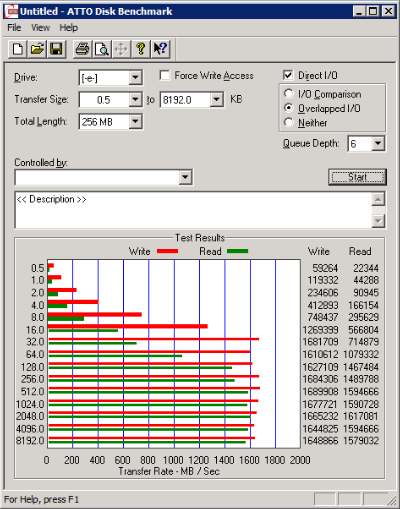
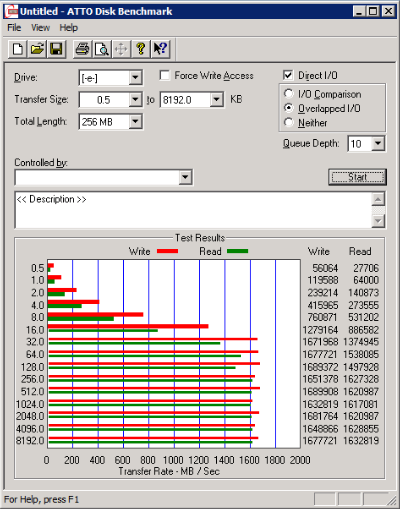
ATTO Disk Benchmark
We carried out testing with parameters:
Total Length = 256 Mb
Queue Depth = 2-10


AS SSD Benchmark
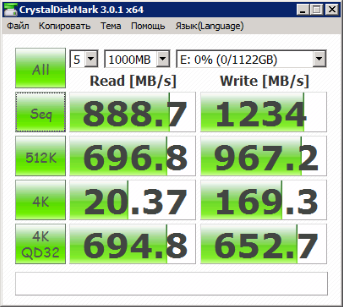
Crystaldiskmark
Iometer
For testing, a set of patterns that we have already tested was chosen:
As results, we chose the maximum values obtained during testing.

Fio
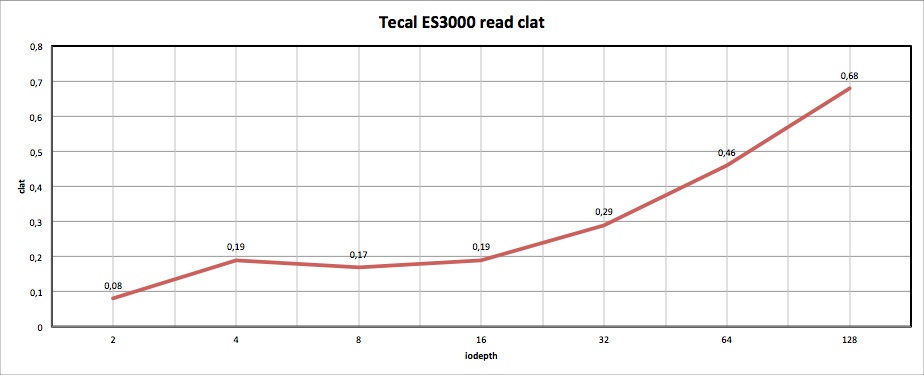


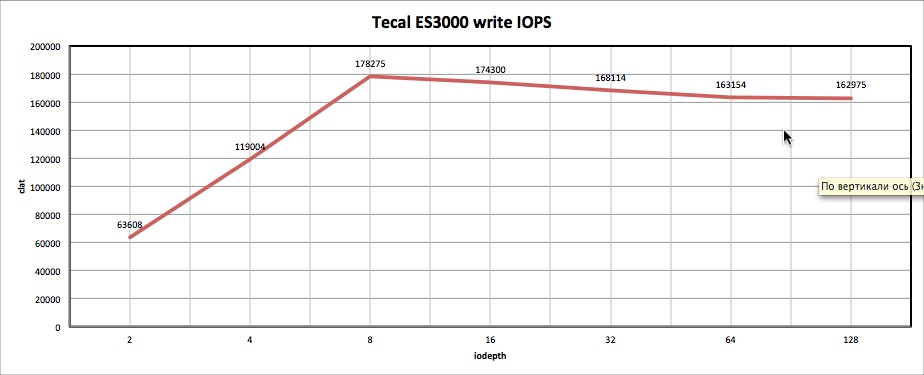
For those who want to see all the numbers with their own eyes, I suggest a test log:
SQLIO


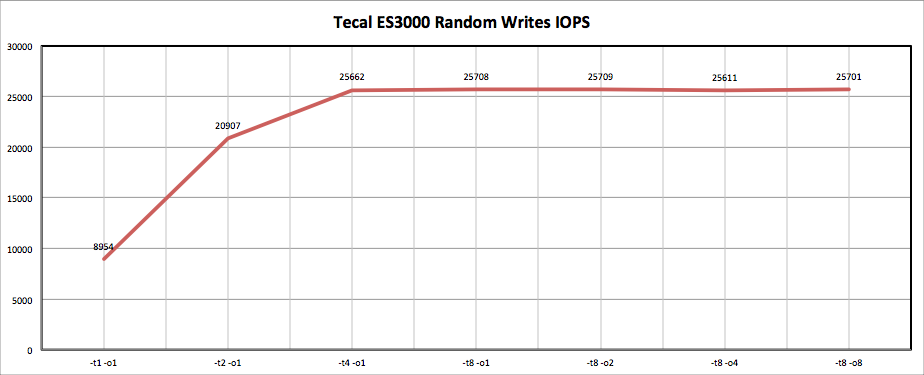


For those who want to see all the numbers with their own eyes, I suggest a test log:
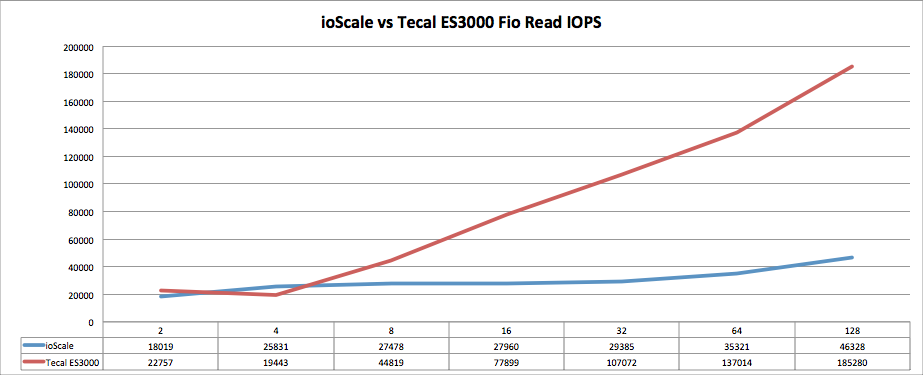
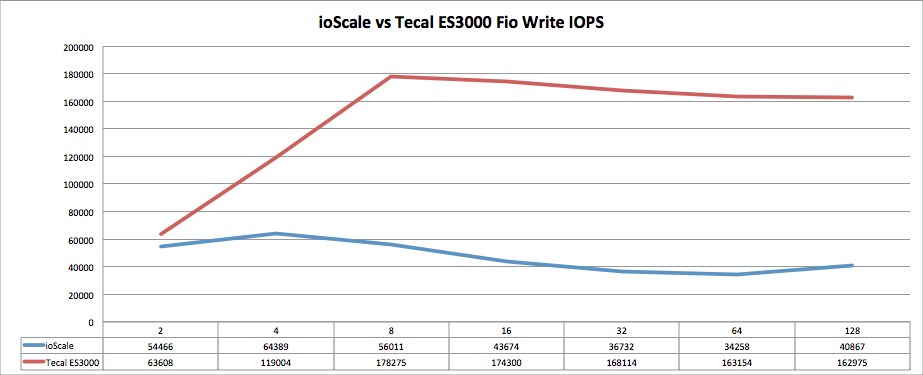
We were pleasantly surprised by such a performance indicator, so we made a graph-comparison with ioScale.
I would also like to highlight the question about software, which is set in almost every article we have - monitoring tools. Here, our test subject is not far away from his fellows in the group and also does not support SMART. All that is - is a small utility for Windows, which gives a certain amount of information and allows you to reflash the card.

The card also supports the SNMP protocol. On the technical side, I would also like to note that the card requires high-quality cooling. Even if at the moment it is not used, but simply connected - the heating of the radiator is strong enough (you can hold no more than 10 seconds in your hand), so you need to pay special attention to the quality of the server cooling (for example, put the maximum number of coolers if this has not been done ).
Summing up, perhaps, we can say that the Huawei Tecal ES3000 card is one of the best in class, one of those who have visited us for testing. But not only with its technical indicators we are pleased with the map, it is also a leader in terms of price / quality ratio in this niche of devices.

The warranty on the device is 3 years, but there is also the possibility of acquiring an extension of the warranty to the required level.
Options for additional warranty programs.

Despite the fact that the Huawei brand is more associated with network equipment, their solution has proven to be extremely successful and has several technological features that pleasantly distinguish it from the competitors in this class of equipment.
We remind you that you can get this card to DEMO, or we will provide a remote server with an installed card, configured for your purposes, and you will be able to test remotely. To purchase Huawei or request DEMO, please contact the head of the direction Kotov Alexey .
By KorP
')
For a start, let's turn to the specifications stated by the manufacturer.
The first thing that catches your eye when looking at the card is four capacitors, which are designed to save data in case of a power failure on the server, which discharge time is about 1 second, which exceeds 100ms needed to clear the data from the buffer.
A special feature is the technical performance of the card - it contains three FPGAs, which are located on two boards. The first board carries the PCI-E interface, one controller and a set of memory, as well as capacitors, providing data protection in case of power failure. The second board contains on itself 2 more controllers and two sets of memory.
The board provides the user with a single section consisting of these “sets” of memory and there is no need to use a soft-raid, as would be the case with the ioDrive 2 Duo, in order to get the maximum amount. The card uses Micron memory.
In addition, the card uses ECC and RAID5 technologies to correct errors, which allows to extend the life of the drive. Depending on the size of the drive, the manufacturer guarantees a recording capacity of 6.4PB, 9.5PB and 19.1PB, respectively, for 800GB, 1.2TB and 2.4TB cards. The card also supports TRIM technology.
After getting acquainted with the theoretical part, we already scratched our hands as soon as possible to install the board in our test server and check what it can do in practice, so we turn to the most interesting part - tests.
The configuration of the test stand with us remained the same:
Platform - HP ProLiant DL380 G7
Processor - Xeon E5606
Memory - 8 GB
Hard drives - 3xSAS 146GB 10k
The test suite also did not undergo any changes, except for the fact that the card could not be verified using the AS SSD Benchmark, it completely refused to work further after the sequential write / read test. And in the future we plan to expand our reviews with the help of Sysbench fileio.
ATTO Disk Benchmark
We carried out testing with parameters:
Total Length = 256 Mb
Queue Depth = 2-10
AS SSD Benchmark
Crystaldiskmark
Iometer
For testing, a set of patterns that we have already tested was chosen:
- Database
- File server
- Workstation
- Webserver
As results, we chose the maximum values obtained during testing.
Fio
For those who want to see all the numbers with their own eyes, I suggest a test log:
iodepth = 2.txt
Jobs: 2 (f = 2): [rw] [100.0% done] [49268K / 259.2M / 0K / s] [12.4K / 66.4K / 0 iops] [eta 00m: 00s]
readtest: (groupid = 0, jobs = 1): err = 0: pid = 1554: Tue Aug 20 16:50:23 2013
read: io = 320033MB, bw = 91032KB / s, iops = 22757, runt = 3600001msec
slat (usec): min = 4, max = 339, avg = 6.26, stdev = 1.53
clat (usec): min = 1, max = 3712, avg = 78.73, stdev = 183.19
lat (usec): min = 20, max = 3719, avg = 85.29, stdev = 183.25
clat percentiles (usec):
| 1.00th = [19], 5.00th = [20], 10.00th = [21], 20.00th = [23],
| 30.00th = [24], 40.00th = [27], 50.00th = [30], 60.00th = [35],
| 70.00th = [97], 80.00th = [108], 90.00th = [116], 95.00th = [124],
| 99.00th = [1192], 99.50th = [1624], 99.90th = [2096], 99.95th = [2160],
| 99.99th = [2256]
bw (KB / s): min = 46464, max = 199048, per = 100.00%, avg = 91050.66, stdev = 41261.48
lat (usec): 2 = 0.01%, 4 = 0.01%, 10 = 0.01%, 20 = 2.09%, 50 = 63.87%
lat (usec): 100 = 7.40%, 250 = 24.06%, 500 = 0.58%, 750 = 0.55%, 1000 = 0.27%
lat (msec): 2 = 1.03%, 4 = 0.16%
cpu: usr = 11.17%, sys = 22.53%, ctx = 60379444, majf = 0, minf = 30
IO depths: 1 = 0.1%, 2 = 100.0%, 4 = 0.0%, 8 = 0.0%, 16 = 0.0%, 32 = 0.0%,> = 64 = 0.0%
submit: 0 = 0.0%, 4 = 100.0%, 8 = 0.0%, 16 = 0.0%, 32 = 0.0%, 64 = 0.0%,> = 64 = 0.0%
complete: 0 = 0.0%, 4 = 100.0%, 8 = 0.0%, 16 = 0.0%, 32 = 0.0%, 64 = 0.0%,> = 64 = 0.0%
issued: total = r = 81928562 / w = 0 / d = 0, short = r = 0 / w = 0 / d = 0
writetest: (groupid = 0, jobs = 1): err = 0: pid = 1555: Tue Aug 20 16:50:23 2013
write: io = 894492MB, bw = 254433KB / s, iops = 63608, runt = 3600001msec
slat (usec): min = 5, max = 337, avg = 6.57, stdev = 1.46
clat (usec): min = 1, max = 3298, avg = 22.30, stdev = 6.88
lat (usec): min = 15, max = 3305, avg = 29.16, stdev = 6.91
clat percentiles (usec):
| 1.00th = [10], 5.00th = [11], 10.00th = [16], 20.00th = [18],
| 30.00th = [19], 40.00th = [20], 50.00th = [21], 60.00th = [22],
| 70.00th = [23], 80.00th = [27], 90.00th = [31], 95.00th = [38],
| 99.00th = [42], 99.50th = [43], 99.90th = [47], 99.95th = [49],
| 99.99th = [135]
bw (KB / s): min = 232112, max = 267808, per = 100.00%, avg = 254436.56, stdev = 10041.23
lat (usec): 2 = 0.01%, 4 = 0.01%, 10 = 0.17%, 20 = 37.68%, 50 = 62.10%
lat (usec): 100 = 0.03%, 250 = 0.02%, 500 = 0.01%, 750 = 0.01%, 1000 = 0.01%
lat (msec): 2 = 0.01%, 4 = 0.01%
cpu: usr = 27.53%, sys = 56.05%, ctx = 105077576, majf = 0, minf = 26
IO depths: 1 = 0.1%, 2 = 100.0%, 4 = 0.0%, 8 = 0.0%, 16 = 0.0%, 32 = 0.0%,> = 64 = 0.0%
submit: 0 = 0.0%, 4 = 100.0%, 8 = 0.0%, 16 = 0.0%, 32 = 0.0%, 64 = 0.0%,> = 64 = 0.0%
complete: 0 = 0.0%, 4 = 100.0%, 8 = 0.0%, 16 = 0.0%, 32 = 0.0%, 64 = 0.0%,> = 64 = 0.0%
issued: total = r = 0 / w = 228989861 / d = 0, short = r = 0 / w = 0 / d = 0
Run status group 0 (all jobs):
READ: io = 320033MB, aggrb = 91031KB / s, minb = 91031KB / s, maxb = 91031KB / s, mint = 3600001msec, maxt = 3600001msec
WRITE: io = 894492MB, aggrb = 254433KB / s, minb = 254433KB / s, maxb = 254433KB / s, mint = 3600001msec, maxt = 3600001msec
Disk stats (read / write):
hioa: ios = 81926750/228984220, merge = 0/0, ticks = 6008271/4115020, in_queue = 11804978, util = 100.00%
iodepth = 4.txt
readtest: (groupid = 0, jobs = 1): err = 0: pid = 5689: Wed Aug 21 10:14:15 2013
read: io = 273421MB, bw = 77773KB / s, iops = 19443, runt = 3600001msec
slat (usec): min = 2, max = 175, avg = 5.97, stdev = 1.72
clat (usec): min = 1, max = 6205, avg = 197.18, stdev = 323.44
lat (usec): min = 23, max = 6210, avg = 203.43, stdev = 323.35
clat percentiles (usec):
| 1.00th = [92], 5.00th = [95], 10.00th = [96], 20.00th = [98],
| 30.00th = [100], 40.00th = [108], 50.00th = [111], 60.00th = [113],
| 70.00th = [116], 80.00th = [122], 90.00th = [219], 95.00th = [804],
| 99.00th = [1848], 99.50th = [2064], 99.90th = [2320], 99.95th = [2608],
| 99.99th = [3536]
bw (KB / s): min = 19088, max = 137856, per = 100.00%, avg = 77783.92, stdev = 41827.69
lat (usec): 2 = 0.01%, 4 = 0.01%, 10 = 0.01%, 20 = 0.01%, 50 = 0.01%
lat (usec): 100 = 27.95%, 250 = 62.47%, 500 = 2.36%, 750 = 1.93%, 1000 = 1.06%
lat (msec): 2 = 3.56%, 4 = 0.65%, 10 = 0.01%
cpu: usr = 8.24%, sys = 17.79%, ctx = 48408103, majf = 0, minf = 29
IO depths: 1 = 0.1%, 2 = 0.1%, 4 = 100.0%, 8 = 0.0%, 16 = 0.0%, 32 = 0.0%,> = 64 = 0.0%
submit: 0 = 0.0%, 4 = 100.0%, 8 = 0.0%, 16 = 0.0%, 32 = 0.0%, 64 = 0.0%,> = 64 = 0.0%
complete: 0 = 0.0%, 4 = 100.0%, 8 = 0.0%, 16 = 0.0%, 32 = 0.0%, 64 = 0.0%,> = 64 = 0.0%
issued: total = r = 69995684 / w = 0 / d = 0, short = r = 0 / w = 0 / d = 0
writetest: (groupid = 0, jobs = 1): err = 0: pid = 5690: Wed Aug 21 10:14:15 2013
write: io = 1121.9GB, bw = 476018KB / s, iops = 119004, runt = 2471139msec
slat (usec): min = 2, max = 340, avg = 5.20, stdev = 1.87
clat (usec): min = 1, max = 2680, avg = 26.67, stdev = 6.32
lat (usec): min = 13, max = 2689, avg = 32.11, stdev = 6.92
clat percentiles (usec):
| 1.00th = [13], 5.00th = [17], 10.00th = [18], 20.00th = [21],
| 30.00th = [24], 40.00th = [26], 50.00th = [28], 60.00th = [28],
| 70.00th = [29], 80.00th = [31], 90.00th = [35], 95.00th = [37],
| 99.00th = [40], 99.50th = [43], 99.90th = [48], 99.95th = [51],
| 99.99th = [149]
bw (KB / s): min = 429408, max = 497760, per = 100.00%, avg = 476022.59, stdev = 14215.05
lat (usec): 2 = 0.01%, 4 = 0.01%, 10 = 0.01%, 20 = 14.58%, 50 = 85.35%
lat (usec): 100 = 0.05%, 250 = 0.02%, 500 = 0.01%, 750 = 0.01%, 1000 = 0.01%
lat (msec): 2 = 0.01%, 4 = 0.01%
cpu: usr = 30.75%, sys = 65.47%, ctx = 23021202, majf = 0, minf = 27
IO depths: 1 = 0.1%, 2 = 0.1%, 4 = 100.0%, 8 = 0.0%, 16 = 0.0%, 32 = 0.0%,> = 64 = 0.0%
submit: 0 = 0.0%, 4 = 100.0%, 8 = 0.0%, 16 = 0.0%, 32 = 0.0%, 64 = 0.0%,> = 64 = 0.0%
complete: 0 = 0.0%, 4 = 100.0%, 8 = 0.0%, 16 = 0.0%, 32 = 0.0%, 64 = 0.0%,> = 64 = 0.0%
issued: total = r = 0 / w = 294076416 / d = 0, short = r = 0 / w = 0 / d = 0
Run status group 0 (all jobs):
READ: io = 273421MB, aggrb = 77772KB / s, minb = 77772KB / s, maxb = 77772KB / s, mint = 3600001msec, maxt = 3600001msec
WRITE: io = 1121.9GB, aggrb = 476017KB / s, minb = 476017KB / s, maxb = 476017KB / s, mint = 2471139msec, maxt = 2471139msec
Disk stats (read / write):
hioa: ios = 69987336/294076416, merge = 0/0, ticks = 13631836/5845410, in_queue = 21021050, util = 100.00%
iodepth = 8.txt
readtest: (groupid = 0, jobs = 1): err = 0: pid = 6172: Wed Aug 21 12:07:47 2013
read: io = 630280MB, bw = 179280KB / s, iops = 44819, runt = 3600001msec
slat (usec): min = 2, max = 354, avg = 5.64, stdev = 1.67
clat (usec): min = 0, max = 9261, avg = 170.62, stdev = 270.59
lat (usec): min = 22, max = 9265, avg = 176.53, stdev = 270.24
clat percentiles (usec):
| 1.00th = [91], 5.00th = [94], 10.00th = [96], 20.00th = [99],
| 30.00th = [103], 40.00th = [108], 50.00th = [111], 60.00th = [114],
| 70.00th = [116], 80.00th = [122], 90.00th = [145], 95.00th = [486],
| 99.00th = [1704], 99.50th = [1960], 99.90th = [2288], 99.95th = [2480],
| 99.99th = [3408]
bw (KB / s): min = 37136, max = 269272, per = 100.00%, avg = 179292.55, stdev = 98012.47
lat (usec): 2 = 0.01%, 4 = 0.01%, 10 = 0.01%, 20 = 0.01%, 50 = 0.01%
lat (usec): 100 = 21.39%, 250 = 72.07%, 500 = 1.60%, 750 = 1.30%, 1000 = 0.75%
lat (msec): 2 = 2.43%, 4 = 0.45%, 10 = 0.01%
cpu: usr = 15.29%, sys = 34.15%, ctx = 68413484, majf = 0, minf = 35
IO depths: 1 = 0.1%, 2 = 0.1%, 4 = 0.1%, 8 = 100.0%, 16 = 0.0%, 32 = 0.0%,> = 64 = 0.0%
submit: 0 = 0.0%, 4 = 100.0%, 8 = 0.0%, 16 = 0.0%, 32 = 0.0%, 64 = 0.0%,> = 64 = 0.0%
complete: 0 = 0.0%, 4 = 100.0%, 8 = 0.1%, 16 = 0.0%, 32 = 0.0%, 64 = 0.0%,> = 64 = 0.0%
issued: total = r = 161351713 / w = 0 / d = 0, short = r = 0 / w = 0 / d = 0
writetest: (groupid = 0, jobs = 1): err = 0: pid = 6173: Wed Aug 21 12:07:47 2013
write: io = 1121.9GB, bw = 713103KB / s, iops = 178275, runt = 1649560msec
slat (usec): min = 2, max = 243, avg = 3.81, stdev = 1.20
clat (usec): min = 7, max = 6220, avg = 39.86, stdev = 19.62
lat (usec): min = 13, max = 6235, avg = 43.84, stdev = 19.65
clat percentiles (usec):
| 1.00th = [27], 5.00th = [31], 10.00th = [32], 20.00th = [35],
| 30.00th = [38], 40.00th = [38], 50.00th = [39], 60.00th = [40],
| 70.00th = [42], 80.00th = [44], 90.00th = [46], 95.00th = [49],
| 99.00th = [63], 99.50th = [66], 99.90th = [75], 99.95th = [143],
| 99.99th = [972]
bw (KB / s): min = 502376, max = 736512, per = 100.00%, avg = 713109.81, stdev = 37391.00
lat (usec): 10 = 0.01%, 20 = 0.01%, 50 = 95.11%, 100 = 4.82%, 250 = 0.04%
lat (usec): 500 = 0.01%, 750 = 0.01%, 1000 = 0.01%
lat (msec): 2 = 0.01%, 4 = 0.01%, 10 = 0.01%
cpu: usr = 31.79%, sys = 67.68%, ctx = 42454, majf = 0, minf = 25
IO depths: 1 = 0.1%, 2 = 0.1%, 4 = 0.1%, 8 = 100.0%, 16 = 0.0%, 32 = 0.0%,> = 64 = 0.0%
submit: 0 = 0.0%, 4 = 100.0%, 8 = 0.0%, 16 = 0.0%, 32 = 0.0%, 64 = 0.0%,> = 64 = 0.0%
complete: 0 = 0.0%, 4 = 100.0%, 8 = 0.1%, 16 = 0.0%, 32 = 0.0%, 64 = 0.0%,> = 64 = 0.0%
issued: total = r = 0 / w = 294076416 / d = 0, short = r = 0 / w = 0 / d = 0
Run status group 0 (all jobs):
READ: io = 630280MB, aggrb = 179279KB / s, minb = 179279KB / s, maxb = 179279KB / s, mint = 3600001msec, maxt = 3600001msec
WRITE: io = 1121.9GB, aggrb = 713102KB / s, minb = 713102KB / s, maxb = 713102KB / s, mint = 1649560msec, maxt = 1649560msec
Disk stats (read / write):
hioa: ios = 161345301/294076416, merge = 0/0, ticks = 26954841/6379390, in_queue = 34949868, util = 100.00%
iodepth = 16.txt
readtest: (groupid = 0, jobs = 1): err = 0: pid = 6666: Wed Aug 21 14:14:19 2013
read: io = 1069.9GB, bw = 311600KB / s, iops = 77899, runt = 3600001msec
slat (usec): min = 2, max = 323, avg = 5.34, stdev = 1.75
clat (usec): min = 0, max = 7901, avg = 198.13, stdev = 287.72
lat (usec): min = 22, max = 7904, avg = 203.71, stdev = 287.39
clat percentiles (usec):
| 1.00th = [97], 5.00th = [105], 10.00th = [112], 20.00th = [119],
| 30.00th = [123], 40.00th = [127], 50.00th = [131], 60.00th = [133],
| 70.00th = [139], 80.00th = [145], 90.00th = [179], 95.00th = [620],
| 99.00th = [1768], 99.50th = [2008], 99.90th = [2320], 99.95th = [2608],
| 99.99th = [3536]
bw (KB / s): min = 74240, max = 458832, per = 100.00%, avg = 311602.05, stdev = 155866.17
lat (usec): 2 = 0.01%, 4 = 0.01%, 10 = 0.01%, 20 = 0.01%, 50 = 0.01%
lat (usec): 100 = 1.94%, 250 = 90.36%, 500 = 1.95%, 750 = 1.52%, 1000 = 0.87%
lat (msec): 2 = 2.84%, 4 = 0.52%, 10 = 0.01%
cpu: usr = 20.27%, sys = 47.10%, ctx = 38705878, majf = 0, minf = 41
IO depths: 1 = 0.1%, 2 = 0.1%, 4 = 0.1%, 8 = 0.1%, 16 = 100.0%, 32 = 0.0%,> = 64 = 0.0%
submit: 0 = 0.0%, 4 = 100.0%, 8 = 0.0%, 16 = 0.0%, 32 = 0.0%, 64 = 0.0%,> = 64 = 0.0%
complete: 0 = 0.0%, 4 = 100.0%, 8 = 0.0%, 16 = 0.1%, 32 = 0.0%, 64 = 0.0%,> = 64 = 0.0%
issued: total = r = 280439835 / w = 0 / d = 0, short = r = 0 / w = 0 / d = 0
writetest: (groupid = 0, jobs = 1): err = 0: pid = 6667: Wed Aug 21 14:14:19 2013
write: io = 1121.9GB, bw = 697203KB / s, iops = 174300, runt = 1687179msec
slat (usec): min = 2, max = 202, avg = 3.92, stdev = 1.29
clat (usec): min = 18, max = 5687, avg = 86.66, stdev = 28.76
lat (usec): min = 21, max = 5690, avg = 90.75, stdev = 28.82
clat percentiles (usec):
| 1.00th = [70], 5.00th = [75], 10.00th = [77], 20.00th = [80],
| 30.00th = [82], 40.00th = [83], 50.00th = [85], 60.00th = [87],
| 70.00th = [89], 80.00th = [91], 90.00th = [94], 95.00th = [97],
| 99.00th = [135], 99.50th = [143], 99.90th = [189], 99.95th = [298],
| 99.99th = [1592]
bw (KB / s): min = 510752, max = 727504, per = 100.00%, avg = 697209.70, stdev = 34525.65
lat (usec): 20 = 0.01%, 50 = 0.01%, 100 = 96.19%, 250 = 3.75%, 500 = 0.01%
lat (usec): 750 = 0.01%, 1000 = 0.01%
lat (msec): 2 = 0.02%, 4 = 0.01%, 10 = 0.01%
cpu: usr = 31.62%, sys = 67.82%, ctx = 13254, majf = 0, minf = 27
IO depths: 1 = 0.1%, 2 = 0.1%, 4 = 0.1%, 8 = 0.1%, 16 = 100.0%, 32 = 0.0%,> = 64 = 0.0%
submit: 0 = 0.0%, 4 = 100.0%, 8 = 0.0%, 16 = 0.0%, 32 = 0.0%, 64 = 0.0%,> = 64 = 0.0%
complete: 0 = 0.0%, 4 = 100.0%, 8 = 0.0%, 16 = 0.1%, 32 = 0.0%, 64 = 0.0%,> = 64 = 0.0%
issued: total = r = 0 / w = 294076416 / d = 0, short = r = 0 / w = 0 / d = 0
Run status group 0 (all jobs):
READ: io = 1069.9GB, aggrb = 311599KB / s, minb = 311599KB / s, maxb = 311599KB / s, mint = 3600001msec, maxt = 3600001msec
WRITE: io = 1121.9GB, aggrb = 697202KB / s, minb = 697202KB / s, maxb = 697202KB / s, mint = 1687179msec, maxt = 1687179msec
Disk stats (read / write):
hioa: ios = 280416729/294076416, merge = 0/0, ticks = 50346429/6393813, in_queue = 59670941, util = 100.00%
iodepth = 32.txt
readtest: (groupid = 0, jobs = 1): err = 0: pid = 7036: Wed Aug 21 15:31:44 2013
read: io = 1121.9GB, bw = 428289KB / s, iops = 107072, runt = 2746524msec
slat (usec): min = 2, max = 259, avg = 3.88, stdev = 1.44
clat (usec): min = 1, max = 8424, avg = 293.57, stdev = 384.12
lat (usec): min = 22, max = 8431, avg = 297.63, stdev = 384.15
clat percentiles (usec):
| 1.00th = [97], 5.00th = [106], 10.00th = [114], 20.00th = [133],
| 30.00th = [147], 40.00th = [157], 50.00th = [167], 60.00th = [187],
| 70.00th = [215], 80.00th = [249], 90.00th = [604], 95.00th = [1272],
| 99.00th = [2008], 99.50th = [2160], 99.90th = [2640], 99.95th = [3120],
| 99.99th = [4016]
bw (KB / s): min = 145288, max = 736104, per = 100.00%, avg = 428270.00, stdev = 192355.37
lat (usec): 2 = 0.01%, 10 = 0.01%, 20 = 0.01%, 50 = 0.01%, 100 = 1.95%
lat (usec): 250 = 78.41%, 500 = 8.42%, 750 = 2.95%, 1000 = 1.73%
lat (msec): 2 = 5.50%, 4 = 1.04%, 10 = 0.01%
cpu: usr = 20.50%, sys = 48.80%, ctx = 43848496, majf = 0, minf = 57
IO depths: 1 = 0.1%, 2 = 0.1%, 4 = 0.1%, 8 = 0.1%, 16 = 0.1%, 32 = 100.0%,> = 64 = 0.0%
submit: 0 = 0.0%, 4 = 100.0%, 8 = 0.0%, 16 = 0.0%, 32 = 0.0%, 64 = 0.0%,> = 64 = 0.0%
complete: 0 = 0.0%, 4 = 100.0%, 8 = 0.0%, 16 = 0.0%, 32 = 0.1%, 64 = 0.0%,> = 64 = 0.0%
issued: total = r = 294076416 / w = 0 / d = 0, short = r = 0 / w = 0 / d = 0
writetest: (groupid = 0, jobs = 1): err = 0: pid = 7037: Wed Aug 21 15:31:44 2013
write: io = 1121.9GB, bw = 672457KB / s, iops = 168114, runt = 1749264msec
slat (usec): min = 2, max = 233, avg = 4.07, stdev = 1.41
clat (usec): min = 28, max = 6005, avg = 185.02, stdev = 43.06
lat (usec): min = 33, max = 6008, avg = 189.26, stdev = 43.17
clat percentiles (usec):
| 1.00th = [163], 5.00th = [167], 10.00th = [171], 20.00th = [175],
| 30.00th = [177], 40.00th = [179], 50.00th = [183], 60.00th = [185],
| 70.00th = [187], 80.00th = [191], 90.00th = [197], 95.00th = [201],
| 99.00th = [286], 99.50th = [302], 99.90th = [414], 99.95th = [1012],
| 99.99th = [2192]
bw (KB / s): min = 494208, max = 710120, per = 100.00%, avg = 672465.71, stdev = 32089.17
lat (usec): 50 = 0.01%, 100 = 0.01%, 250 = 98.23%, 500 = 1.68%, 750 = 0.02%
lat (usec): 1000 = 0.02%
lat (msec): 2 = 0.04%, 4 = 0.01%, 10 = 0.01%
cpu: usr = 31.03%, sys = 68.42%, ctx = 13573, majf = 0, minf = 27
IO depths: 1 = 0.1%, 2 = 0.1%, 4 = 0.1%, 8 = 0.1%, 16 = 0.1%, 32 = 100.0%,> = 64 = 0.0%
submit: 0 = 0.0%, 4 = 100.0%, 8 = 0.0%, 16 = 0.0%, 32 = 0.0%, 64 = 0.0%,> = 64 = 0.0%
complete: 0 = 0.0%, 4 = 100.0%, 8 = 0.0%, 16 = 0.0%, 32 = 0.1%, 64 = 0.0%,> = 64 = 0.0%
issued: total = r = 0 / w = 294076416 / d = 0, short = r = 0 / w = 0 / d = 0
Run status group 0 (all jobs):
READ: io = 1121.9GB, aggrb = 428288KB / s, minb = 428288KB / s, maxb = 428288KB / s, mint = 2746524msec, maxt = 2746524msec
WRITE: io = 1121.9GB, aggrb = 672457KB / s, minb = 672457KB / s, maxb = 672457KB / s, mint = 1749264msec, maxt = 1749264msec
Disk stats (read / write):
hioa: ios = 294061020/294076416, merge = 0/0, ticks = 72823490/6433110, in_queue = 83767095, util = 100.00%
iodepth = 64.txt
readtest: (groupid = 0, jobs = 1): err = 0: pid = 7386: Wed Aug 21 16:47:49 2013
read: io = 1121.9GB, bw = 548058KB / s, iops = 137014, runt = 2146316msec
slat (usec): min = 2, max = 341, avg = 3.59, stdev = 1.40
clat (usec): min = 7, max = 11049, avg = 462.19, stdev = 499.68
lat (usec): min = 22, max = 11052, avg = 465.95, stdev = 499.74
clat percentiles (usec):
| 1.00th = [100], 5.00th = [113], 10.00th = [123], 20.00th = [153],
| 30.00th = [191], 40.00th = [245], 50.00th = [306], 60.00th = [322],
| 70.00th = [338], 80.00th = [604], 90.00th = [1256], 95.00th = [1688],
| 99.00th = [2192], 99.50th = [2352], 99.90th = [3280], 99.95th = [3696],
| 99.99th = [4384]
bw (KB / s): min = 269888, max = 783664, per = 100.00%, avg = 548040.34, stdev = 150613.08
lat (usec): 10 = 0.01%, 20 = 0.01%, 50 = 0.01%, 100 = 0.99%, 250 = 39.65%
lat (usec): 500 = 36.88%, 750 = 5.78%, 1000 = 3.74%
lat (msec): 2 = 10.73%, 4 = 2.20%, 10 = 0.03%, 20 = 0.01%
cpu: usr = 22.98%, sys = 57.80%, ctx = 28745789, majf = 0, minf = 89
IO depths: 1 = 0.1%, 2 = 0.1%, 4 = 0.1%, 8 = 0.1%, 16 = 0.1%, 32 = 0.1%,> = 64 = 100.0%
submit: 0 = 0.0%, 4 = 100.0%, 8 = 0.0%, 16 = 0.0%, 32 = 0.0%, 64 = 0.0%,> = 64 = 0.0%
complete: 0 = 0.0%, 4 = 100.0%, 8 = 0.0%, 16 = 0.0%, 32 = 0.0%, 64 = 0.1%,> = 64 = 0.0%
issued: total = r = 294076416 / w = 0 / d = 0, short = r = 0 / w = 0 / d = 0
writetest: (groupid = 0, jobs = 1): err = 0: pid = 7387: Wed Aug 21 16:47:49 2013
write: io = 1121.9GB, bw = 652619KB / s, iops = 163154, runt = 1802438msec
slat (usec): min = 2, max = 976, avg = 4.17, stdev = 1.53
clat (usec): min = 25, max = 8361, avg = 386.78, stdev = 72.02
lat (usec): min = 28, max = 8367, avg = 391.13, stdev = 72.15
clat percentiles (usec):
| 1.00th = [346], 5.00th = [354], 10.00th = [358], 20.00th = [366],
| 30.00th = [374], 40.00th = [378], 50.00th = [382], 60.00th = [386],
| 70.00th = [390], 80.00th = [394], 90.00th = [402], 95.00th = [410],
| 99.00th = [588], 99.50th = [628], 99.90th = [1432], 99.95th = [1992],
| 99.99th = [3024]
bw (KB / s): min = 453352, max = 690536, per = 100.00%, avg = 652628.16, stdev = 33290.43
lat (usec): 50 = 0.01%, 100 = 0.01%, 250 = 0.01%, 500 = 97.75%, 750 = 2.04%
lat (usec): 1000 = 0.05%
lat (msec): 2 = 0.11%, 4 = 0.05%, 10 = 0.01%
cpu: usr = 30.10%, sys = 69.24%, ctx = 15632, majf = 0, minf = 27
IO depths: 1 = 0.1%, 2 = 0.1%, 4 = 0.1%, 8 = 0.1%, 16 = 0.1%, 32 = 0.1%,> = 64 = 100.0%
submit: 0 = 0.0%, 4 = 100.0%, 8 = 0.0%, 16 = 0.0%, 32 = 0.0%, 64 = 0.0%,> = 64 = 0.0%
complete: 0 = 0.0%, 4 = 100.0%, 8 = 0.0%, 16 = 0.0%, 32 = 0.0%, 64 = 0.1%,> = 64 = 0.0%
issued: total = r = 0 / w = 294076416 / d = 0, short = r = 0 / w = 0 / d = 0
Run status group 0 (all jobs):
READ: io = 1121.9GB, aggrb = 548058KB / s, minb = 548058KB / s, maxb = 548058KB / s, mint = 2146316msec, maxt = 2146316msec
WRITE: io = 1121.9GB, aggrb = 652619KB / s, minb = 652619KB / s, maxb = 652619KB / s, mint = 1802438msec, maxt = 1802438msec
Disk stats (read / write):
hioa: ios = 294036760/294076416, merge = 0/0, ticks = 111488349/8157809, in_queue = 126392114, util = 100.00%
iodepth = 128.txt
readtest: (groupid = 0, jobs = 1): err = 0: pid = 11370: Thu Aug 22 09:47:12 2013
read: io = 1121.9GB, bw = 741121KB / s, iops = 185280, runt = 1587197msec
slat (usec): min = 2, max = 227, avg = 3.50, stdev = 1.46
clat (usec): min = 18, max = 23463, avg = 686.08, stdev = 472.74
lat (usec): min = 21, max = 23466, avg = 689.75, stdev = 472.74
clat percentiles (usec):
| 1.00th = [153], 5.00th = [258], 10.00th = [322], 20.00th = [398],
| 30.00th = [450], 40.00th = [494], 50.00th = [540], 60.00th = [580],
| 70.00th = [636], 80.00th = [836], 90.00th = [1416], 95.00th = [1848],
| 99.00th = [2320], 99.50th = [2448], 99.90th = [2704], 99.95th = [3024],
| 99.99th = [4192]
bw (KB / s): min = 620536, max = 755536, per = 100.00%, avg = 741126.44, stdev = 14459.92
lat (usec): 20 = 0.01%, 50 = 0.01%, 100 = 0.03%, 250 = 4.48%, 500 = 36.63%
lat (usec): 750 = 36.78%, 1000 = 5.78%
lat (msec): 2 = 12.96%, 4 = 3.33%, 10 = 0.01%, 20 = 0.01%, 50 = 0.01%
cpu: usr = 26.85%, sys = 72.48%, ctx = 781809, majf = 0, minf = 153
IO depths: 1 = 0.1%, 2 = 0.1%, 4 = 0.1%, 8 = 0.1%, 16 = 0.1%, 32 = 0.1%,> = 64 = 100.0%
submit: 0 = 0.0%, 4 = 100.0%, 8 = 0.0%, 16 = 0.0%, 32 = 0.0%, 64 = 0.0%,> = 64 = 0.0%
complete: 0 = 0.0%, 4 = 100.0%, 8 = 0.0%, 16 = 0.0%, 32 = 0.0%, 64 = 0.0%,> = 64 = 0.1%
issued: total = r = 294076416 / w = 0 / d = 0, short = r = 0 / w = 0 / d = 0
writetest: (groupid = 0, jobs = 1): err = 0: pid = 11371: Thu Aug 22 09:47:12 2013
write: io = 1121.9GB, bw = 651904KB / s, iops = 162975, runt = 1804416msec
slat (usec): min = 2, max = 234, avg = 4.23, stdev = 1.56
clat (usec): min = 19, max = 19162, avg = 779.86, stdev = 57.41
lat (usec): min = 22, max = 19165, avg = 784.27, stdev = 57.54
clat percentiles (usec):
| 1.00th = [684], 5.00th = [692], 10.00th = [700], 20.00th = [772],
| 30.00th = [780], 40.00th = [780], 50.00th = [788], 60.00th = [796],
| 70.00th = [796], 80.00th = [804], 90.00th = [812], 95.00th = [820],
| 99.00th = [844], 99.50th = [892], 99.90th = [932], 99.95th = [980],
| 99.99th = [1288]
bw (KB / s): min = 573864, max = 733784, per = 100.00%, avg = 651894.62, stdev = 28749.69
lat (usec): 20 = 0.01%, 50 = 0.01%, 100 = 0.01%, 250 = 0.01%, 500 = 0.01%
lat (usec): 750 = 14.15%, 1000 = 85.81%
lat (msec): 2 = 0.03%, 4 = 0.01%, 10 = 0.01%, 20 = 0.01%
cpu: usr = 29.86%, sys = 70.09%, ctx = 2444, majf = 0, minf = 27
IO depths: 1 = 0.1%, 2 = 0.1%, 4 = 0.1%, 8 = 0.1%, 16 = 0.1%, 32 = 0.1%,> = 64 = 100.0%
submit: 0 = 0.0%, 4 = 100.0%, 8 = 0.0%, 16 = 0.0%, 32 = 0.0%, 64 = 0.0%,> = 64 = 0.0%
complete: 0 = 0.0%, 4 = 100.0%, 8 = 0.0%, 16 = 0.0%, 32 = 0.0%, 64 = 0.0%,> = 64 = 0.1%
issued: total = r = 0 / w = 294076416 / d = 0, short = r = 0 / w = 0 / d = 0
Run status group 0 (all jobs):
READ: io = 1121.9GB, aggrb = 741121KB / s, minb = 741121KB / s, maxb = 741121KB / s, mint = 1587197msec, maxt = 1587197msec
WRITE: io = 1121.9GB, aggrb = 651903KB / s, minb = 651903KB / s, maxb = 651903KB / s, mint = 1804416msec, maxt = 1804416msec
Disk stats (read / write):
hioa: ios = 294076499/294047419, merge = 0/0, ticks = 104004141/6709023, in_queue = 120968585, util = 100.00%
SQLIO
For those who want to see all the numbers with their own eyes, I suggest a test log:
Random Reads Test.txt
E: \ sqlio.exe -BH -kR -fsequential -t1 -o1 -s600 -b64 -FE: \ param.txt
sqlio v1.5.SG
Parameter file used: E: \ param.txt
file E: \ testfile.dat with 1 thread (0) using mask 0x0 (0)
1 thread reading for 600 secs from file E: \ testfile.dat
using 64KB sequential IOs
enabling multiple I / Os per thread with 1 outstanding
hardware backup cache (but not file cache)
using specified size: 10000 MB for file: E: \ testfile.dat
initialization done
CUMULATIVE DATA:
throughput metrics:
IOs / sec: 3862.49
MBs / sec: 241.40
E: \ sqlio.exe -BH -kR -fsequential -t2 -o1 -s600 -b64 -FE: \ param.txt
sqlio v1.5.SG
Parameter file used: E: \ param.txt
file E: \ testfile.dat with 2 threads (0-1) using mask 0x0 (0)
2 threads reading for 600 secs from file E: \ testfile.dat
using 64KB sequential IOs
enabling multiple I / Os per thread with 1 outstanding
hardware backup cache (but not file cache)
using specified size: 10000 MB for file: E: \ testfile.dat
initialization done
CUMULATIVE DATA:
throughput metrics:
IOs / sec: 7274.67
MBs / sec: 454.66
E: \ sqlio.exe -BH -kR -fsequential -t4 -o1 -s600 -b64 -FE: \ param.txt
sqlio v1.5.SG
Parameter file used: E: \ param.txt
file E: \ testfile.dat with 4 threads (0-3) using mask 0x0 (0)
4 threads reading for 600 secs from file E: \ testfile.dat
using 64KB sequential IOs
enabling multiple I / Os per thread with 1 outstanding
hardware backup cache (but not file cache)
using specified size: 10000 MB for file: E: \ testfile.dat
initialization done
CUMULATIVE DATA:
throughput metrics:
IOs / sec: 15136.69
MBs / sec: 946.04
E: \ sqlio.exe -BH -kR -frandom -t8 -o2 -s600 -b64 -FE: \ param.txt
sqlio v1.5.SG
Parameter file used: E: \ param.txt
file E: \ testfile.dat with 8 threads (0-7) using mask 0x0 (0)
8 threads reading for 600 secs from file E: \ testfile.dat
using 64KB random IOs
enabling multiple I / Os per thread with 2 outstanding
hardware backup cache (but not file cache)
using specified size: 10000 MB for file: E: \ testfile.dat
initialization done
CUMULATIVE DATA:
throughput metrics:
IOs / sec: 25457.72
MBs / sec: 1591.10
E: \ sqlio.exe -BH -kR -frandom -t8 -o4 -s600 -b64 -FE: \ param.txt
sqlio v1.5.SG
Parameter file used: E: \ param.txt
file E: \ testfile.dat with 8 threads (0-7) using mask 0x0 (0)
8 threads reading for 600 secs from file E: \ testfile.dat
using 64KB random IOs
enabling multiple I / Os per thread with 4 outstanding
hardware backup cache (but not file cache)
using specified size: 10000 MB for file: E: \ testfile.dat
initialization done
CUMULATIVE DATA:
throughput metrics:
IOs / sec: 25473.46
MBs / sec: 1592.09
E: \ sqlio.exe -BH -kR -frandom -t8 -o8 -s600 -b64 -FE: \ param.txt
sqlio v1.5.SG
Parameter file used: E: \ param.txt
file E: \ testfile.dat with 8 threads (0-7) using mask 0x0 (0)
8 threads reading for 600 secs from file E: \ testfile.dat
using 64KB random IOs
enabling multiple I / Os per thread with 8 outstanding
hardware backup cache (but not file cache)
using specified size: 10000 MB for file: E: \ testfile.dat
initialization done
CUMULATIVE DATA:
throughput metrics:
IOs / sec: 25474.25
MBs / sec: 1592.14
sqlio v1.5.SG
Parameter file used: E: \ param.txt
file E: \ testfile.dat with 1 thread (0) using mask 0x0 (0)
1 thread reading for 600 secs from file E: \ testfile.dat
using 64KB sequential IOs
enabling multiple I / Os per thread with 1 outstanding
hardware backup cache (but not file cache)
using specified size: 10000 MB for file: E: \ testfile.dat
initialization done
CUMULATIVE DATA:
throughput metrics:
IOs / sec: 3862.49
MBs / sec: 241.40
E: \ sqlio.exe -BH -kR -fsequential -t2 -o1 -s600 -b64 -FE: \ param.txt
sqlio v1.5.SG
Parameter file used: E: \ param.txt
file E: \ testfile.dat with 2 threads (0-1) using mask 0x0 (0)
2 threads reading for 600 secs from file E: \ testfile.dat
using 64KB sequential IOs
enabling multiple I / Os per thread with 1 outstanding
hardware backup cache (but not file cache)
using specified size: 10000 MB for file: E: \ testfile.dat
initialization done
CUMULATIVE DATA:
throughput metrics:
IOs / sec: 7274.67
MBs / sec: 454.66
E: \ sqlio.exe -BH -kR -fsequential -t4 -o1 -s600 -b64 -FE: \ param.txt
sqlio v1.5.SG
Parameter file used: E: \ param.txt
file E: \ testfile.dat with 4 threads (0-3) using mask 0x0 (0)
4 threads reading for 600 secs from file E: \ testfile.dat
using 64KB sequential IOs
enabling multiple I / Os per thread with 1 outstanding
hardware backup cache (but not file cache)
using specified size: 10000 MB for file: E: \ testfile.dat
initialization done
CUMULATIVE DATA:
throughput metrics:
IOs / sec: 15136.69
MBs / sec: 946.04
E: \ sqlio.exe -BH -kR -frandom -t8 -o2 -s600 -b64 -FE: \ param.txt
sqlio v1.5.SG
Parameter file used: E: \ param.txt
file E: \ testfile.dat with 8 threads (0-7) using mask 0x0 (0)
8 threads reading for 600 secs from file E: \ testfile.dat
using 64KB random IOs
enabling multiple I / Os per thread with 2 outstanding
hardware backup cache (but not file cache)
using specified size: 10000 MB for file: E: \ testfile.dat
initialization done
CUMULATIVE DATA:
throughput metrics:
IOs / sec: 25457.72
MBs / sec: 1591.10
E: \ sqlio.exe -BH -kR -frandom -t8 -o4 -s600 -b64 -FE: \ param.txt
sqlio v1.5.SG
Parameter file used: E: \ param.txt
file E: \ testfile.dat with 8 threads (0-7) using mask 0x0 (0)
8 threads reading for 600 secs from file E: \ testfile.dat
using 64KB random IOs
enabling multiple I / Os per thread with 4 outstanding
hardware backup cache (but not file cache)
using specified size: 10000 MB for file: E: \ testfile.dat
initialization done
CUMULATIVE DATA:
throughput metrics:
IOs / sec: 25473.46
MBs / sec: 1592.09
E: \ sqlio.exe -BH -kR -frandom -t8 -o8 -s600 -b64 -FE: \ param.txt
sqlio v1.5.SG
Parameter file used: E: \ param.txt
file E: \ testfile.dat with 8 threads (0-7) using mask 0x0 (0)
8 threads reading for 600 secs from file E: \ testfile.dat
using 64KB random IOs
enabling multiple I / Os per thread with 8 outstanding
hardware backup cache (but not file cache)
using specified size: 10000 MB for file: E: \ testfile.dat
initialization done
CUMULATIVE DATA:
throughput metrics:
IOs / sec: 25474.25
MBs / sec: 1592.14
Random Writes Test.txt
E: \ sqlio.exe -BH -kW -frandom -t1 -o1 -s600 -b64 -FE: \ param.txt
sqlio v1.5.SG
Parameter file used: E: \ param.txt
file E: \ testfile.dat with 1 thread (0) using mask 0x0 (0)
1 thread writing for 600 secs to file E: \ testfile.dat
using 64KB random IOs
enabling multiple I / Os per thread with 1 outstanding
hardware backup cache (but not file cache)
using specified size: 102400 MB for file: E: \ testfile.dat
initialization done
CUMULATIVE DATA:
throughput metrics:
IOs / sec: 8954.36
MBs / sec: 559.64
C: \ Users \ Administrator> E: \ sqlio.exe -BH -kW -frandom -t2 -o1 -s600 -b64 -FE: \ par
am.txt
sqlio v1.5.SG
Parameter file used: E: \ param.txt
file E: \ testfile.dat with 2 threads (0-1) using mask 0x0 (0)
2 threads writing for 600 secs to file E: \ testfile.dat
using 64KB random IOs
enabling multiple I / Os per thread with 1 outstanding
hardware backup cache (but not file cache)
using specified size: 102400 MB for file: E: \ testfile.dat
initialization done
CUMULATIVE DATA:
throughput metrics:
IOs / sec: 20906.67
MBs / sec: 1306.66
C: \ Users \ Administrator> E: \ sqlio.exe -BH -kW -frandom -t4 -o1 -s600 -b64 -FE: \ par
am.txt
sqlio v1.5.SG
Parameter file used: E: \ param.txt
file E: \ testfile.dat with 4 threads (0-3) using mask 0x0 (0)
4 threads writing for 600 secs to file E: \ testfile.dat
using 64KB random IOs
enabling multiple I / Os per thread with 1 outstanding
hardware backup cache (but not file cache)
using specified size: 102400 MB for file: E: \ testfile.dat
initialization done
CUMULATIVE DATA:
throughput metrics:
IOs / sec: 25662.05
MBs / sec: 1603.87
C: \ Users \ Administrator> E: \ sqlio.exe -BH -kW -frandom -t8 -o1 -s600 -b64 -FE: \ par
am.txt
sqlio v1.5.SG
Parameter file used: E: \ param.txt
file E: \ testfile.dat with 8 threads (0-7) using mask 0x0 (0)
8 threads writing for 600 secs to file E: \ testfile.dat
using 64KB random IOs
enabling multiple I / Os per thread with 1 outstanding
hardware backup cache (but not file cache)
using specified size: 102400 MB for file: E: \ testfile.dat
initialization done
CUMULATIVE DATA:
throughput metrics:
IOs / sec: 25707.68
MBs / sec: 1606.73
C: \ Users \ Administrator> E: \ sqlio.exe -BH -kW -frandom -t8 -o2 -s600 -b64 -FE: \ par
am.txt
sqlio v1.5.SG
Parameter file used: E: \ param.txt
file E: \ testfile.dat with 8 threads (0-7) using mask 0x0 (0)
8 threads writing for 600 secs to file E: \ testfile.dat
using 64KB random IOs
enabling multiple I / Os per thread with 2 outstanding
hardware backup cache (but not file cache)
using specified size: 102400 MB for file: E: \ testfile.dat
initialization done
CUMULATIVE DATA:
throughput metrics:
IOs / sec: 25709.19
MBs / sec: 1606.82
C: \ Users \ Administrator> E: \ sqlio.exe -BH -kW -frandom -t8 -o4 -s600 -b64 -FE: \ par
am.txt
sqlio v1.5.SG
Parameter file used: E: \ param.txt
file E: \ testfile.dat with 8 threads (0-7) using mask 0x0 (0)
8 threads writing for 600 secs to file E: \ testfile.dat
using 64KB random IOs
enabling multiple I / Os per thread with 4 outstanding
hardware backup cache (but not file cache)
using specified size: 102400 MB for file: E: \ testfile.dat
initialization done
CUMULATIVE DATA:
throughput metrics:
IOs / sec: 25711.34
MBs / sec: 1606.95
C: \ Users \ Administrator> E: \ sqlio.exe -BH -kW -frandom -t8 -o8 -s600 -b64 -FE: \ par
am.txt
sqlio v1.5.SG
Parameter file used: E: \ param.txt
file E: \ testfile.dat with 8 threads (0-7) using mask 0x0 (0)
8 threads writing for 600 secs to file E: \ testfile.dat
using 64KB random IOs
enabling multiple I / Os per thread with 8 outstanding
hardware backup cache (but not file cache)
using specified size: 102400 MB for file: E: \ testfile.dat
initialization done
CUMULATIVE DATA:
throughput metrics:
IOs / sec: 25701.29
MBs / sec: 1606.33
sqlio v1.5.SG
Parameter file used: E: \ param.txt
file E: \ testfile.dat with 1 thread (0) using mask 0x0 (0)
1 thread writing for 600 secs to file E: \ testfile.dat
using 64KB random IOs
enabling multiple I / Os per thread with 1 outstanding
hardware backup cache (but not file cache)
using specified size: 102400 MB for file: E: \ testfile.dat
initialization done
CUMULATIVE DATA:
throughput metrics:
IOs / sec: 8954.36
MBs / sec: 559.64
C: \ Users \ Administrator> E: \ sqlio.exe -BH -kW -frandom -t2 -o1 -s600 -b64 -FE: \ par
am.txt
sqlio v1.5.SG
Parameter file used: E: \ param.txt
file E: \ testfile.dat with 2 threads (0-1) using mask 0x0 (0)
2 threads writing for 600 secs to file E: \ testfile.dat
using 64KB random IOs
enabling multiple I / Os per thread with 1 outstanding
hardware backup cache (but not file cache)
using specified size: 102400 MB for file: E: \ testfile.dat
initialization done
CUMULATIVE DATA:
throughput metrics:
IOs / sec: 20906.67
MBs / sec: 1306.66
C: \ Users \ Administrator> E: \ sqlio.exe -BH -kW -frandom -t4 -o1 -s600 -b64 -FE: \ par
am.txt
sqlio v1.5.SG
Parameter file used: E: \ param.txt
file E: \ testfile.dat with 4 threads (0-3) using mask 0x0 (0)
4 threads writing for 600 secs to file E: \ testfile.dat
using 64KB random IOs
enabling multiple I / Os per thread with 1 outstanding
hardware backup cache (but not file cache)
using specified size: 102400 MB for file: E: \ testfile.dat
initialization done
CUMULATIVE DATA:
throughput metrics:
IOs / sec: 25662.05
MBs / sec: 1603.87
C: \ Users \ Administrator> E: \ sqlio.exe -BH -kW -frandom -t8 -o1 -s600 -b64 -FE: \ par
am.txt
sqlio v1.5.SG
Parameter file used: E: \ param.txt
file E: \ testfile.dat with 8 threads (0-7) using mask 0x0 (0)
8 threads writing for 600 secs to file E: \ testfile.dat
using 64KB random IOs
enabling multiple I / Os per thread with 1 outstanding
hardware backup cache (but not file cache)
using specified size: 102400 MB for file: E: \ testfile.dat
initialization done
CUMULATIVE DATA:
throughput metrics:
IOs / sec: 25707.68
MBs / sec: 1606.73
C: \ Users \ Administrator> E: \ sqlio.exe -BH -kW -frandom -t8 -o2 -s600 -b64 -FE: \ par
am.txt
sqlio v1.5.SG
Parameter file used: E: \ param.txt
file E: \ testfile.dat with 8 threads (0-7) using mask 0x0 (0)
8 threads writing for 600 secs to file E: \ testfile.dat
using 64KB random IOs
enabling multiple I / Os per thread with 2 outstanding
hardware backup cache (but not file cache)
using specified size: 102400 MB for file: E: \ testfile.dat
initialization done
CUMULATIVE DATA:
throughput metrics:
IOs / sec: 25709.19
MBs / sec: 1606.82
C: \ Users \ Administrator> E: \ sqlio.exe -BH -kW -frandom -t8 -o4 -s600 -b64 -FE: \ par
am.txt
sqlio v1.5.SG
Parameter file used: E: \ param.txt
file E: \ testfile.dat with 8 threads (0-7) using mask 0x0 (0)
8 threads writing for 600 secs to file E: \ testfile.dat
using 64KB random IOs
enabling multiple I / Os per thread with 4 outstanding
hardware backup cache (but not file cache)
using specified size: 102400 MB for file: E: \ testfile.dat
initialization done
CUMULATIVE DATA:
throughput metrics:
IOs / sec: 25711.34
MBs / sec: 1606.95
C: \ Users \ Administrator> E: \ sqlio.exe -BH -kW -frandom -t8 -o8 -s600 -b64 -FE: \ par
am.txt
sqlio v1.5.SG
Parameter file used: E: \ param.txt
file E: \ testfile.dat with 8 threads (0-7) using mask 0x0 (0)
8 threads writing for 600 secs to file E: \ testfile.dat
using 64KB random IOs
enabling multiple I / Os per thread with 8 outstanding
hardware backup cache (but not file cache)
using specified size: 102400 MB for file: E: \ testfile.dat
initialization done
CUMULATIVE DATA:
throughput metrics:
IOs / sec: 25701.29
MBs / sec: 1606.33
Sequential Reads Test.txt
C: \ Users \ Administrator> E: \ sqlio.exe -BH -kR -fsequential -t1 -o1 -s600 -b64 -FE:
\ param.txt
sqlio v1.5.SG
Parameter file used: E: \ param.txt
file E: \ testfile.dat with 1 thread (0) using mask 0x0 (0)
1 thread reading for 600 secs from file E: \ testfile.dat
using 64KB sequential IOs
enabling multiple I / Os per thread with 1 outstanding
buffering set to use hardware disk cache (but not file cache)
using specified size: 102400 MB for file: E:\testfile.dat
initialization done
CUMULATIVE DATA:
throughput metrics:
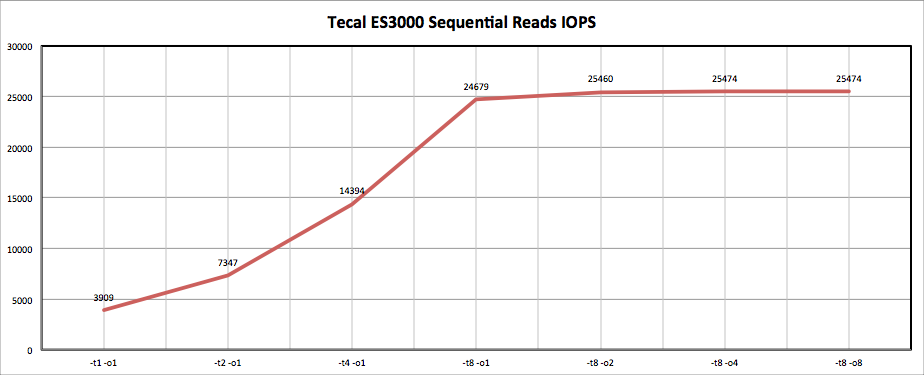
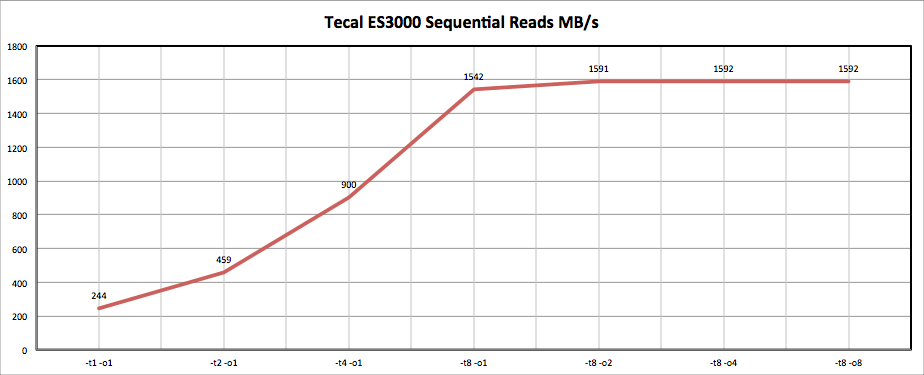
IOs/sec: 3908.71
MBs/sec: 244.29
C:\Users\>E:\sqlio.exe -BH -kR -fsequential -t2 -o1 -s600 -b64 -FE:
\param.txt
sqlio v1.5.SG
parameter file used: E:\param.txt
file E:\testfile.dat with 2 threads (0-1) using mask 0x0 (0)
2 threads reading for 600 secs from file E:\testfile.dat
using 64KB sequential IOs
enabling multiple I/Os per thread with 1 outstanding
buffering set to use hardware disk cache (but not file cache)
using specified size: 102400 MB for file: E:\testfile.dat
initialization done
CUMULATIVE DATA:
throughput metrics:
IOs/sec: 7347.13
MBs/sec: 459.19
C:\Users\>E:\sqlio.exe -BH -kR -fsequential -t4 -o1 -s600 -b64 -FE:
\param.txt
sqlio v1.5.SG
parameter file used: E:\param.txt
file E:\testfile.dat with 4 threads (0-3) using mask 0x0 (0)
4 threads reading for 600 secs from file E:\testfile.dat
using 64KB sequential IOs
enabling multiple I/Os per thread with 1 outstanding
buffering set to use hardware disk cache (but not file cache)
using specified size: 102400 MB for file: E:\testfile.dat
initialization done
CUMULATIVE DATA:
throughput metrics:
IOs/sec: 14394.25
MBs/sec: 899.64
C:\Users\>E:\sqlio.exe -BH -kR -fsequential -t8 -o1 -s600 -b64 -FE:
\param.txt
sqlio v1.5.SG
parameter file used: E:\param.txt
file E:\testfile.dat with 8 threads (0-7) using mask 0x0 (0)
8 threads reading for 600 secs from file E:\testfile.dat
using 64KB sequential IOs
enabling multiple I/Os per thread with 1 outstanding
buffering set to use hardware disk cache (but not file cache)
using specified size: 102400 MB for file: E:\testfile.dat
initialization done
CUMULATIVE DATA:
throughput metrics:
IOs/sec: 24678.71
MBs/sec: 1542.41
C:\Users\>E:\sqlio.exe -BH -kR -fsequential -t8 -o2 -s600 -b64 -FE:
\param.txt
sqlio v1.5.SG
parameter file used: E:\param.txt
file E:\testfile.dat with 8 threads (0-7) using mask 0x0 (0)
8 threads reading for 600 secs from file E:\testfile.dat
using 64KB sequential IOs
enabling multiple I/Os per thread with 2 outstanding
buffering set to use hardware disk cache (but not file cache)
using specified size: 102400 MB for file: E:\testfile.dat
initialization done
CUMULATIVE DATA:
throughput metrics:
IOs/sec: 25459.87
MBs/sec: 1591.24
C:\Users\>E:\sqlio.exe -BH -kR -fsequential -t8 -o4 -s600 -b64 -FE:
\param.txt
sqlio v1.5.SG
parameter file used: E:\param.txt
file E:\testfile.dat with 8 threads (0-7) using mask 0x0 (0)
8 threads reading for 600 secs from file E:\testfile.dat
using 64KB sequential IOs
enabling multiple I/Os per thread with 4 outstanding
buffering set to use hardware disk cache (but not file cache)
using specified size: 102400 MB for file: E:\testfile.dat
initialization done
CUMULATIVE DATA:
throughput metrics:
IOs/sec: 25474.61
MBs/sec: 1592.16
C:\Users\>E:\sqlio.exe -BH -kR -fsequential -t8 -o8 -s600 -b64 -FE:
\param.txt
sqlio v1.5.SG
parameter file used: E:\param.txt
file E:\testfile.dat with 8 threads (0-7) using mask 0x0 (0)
8 threads reading for 600 secs from file E:\testfile.dat
using 64KB sequential IOs
enabling multiple I/Os per thread with 8 outstanding
buffering set to use hardware disk cache (but not file cache)
using specified size: 102400 MB for file: E:\testfile.dat
initialization done
CUMULATIVE DATA:
throughput metrics:
IOs/sec: 25474.79
MBs/sec: 1592.17
\ param.txt
sqlio v1.5.SG
Parameter file used: E: \ param.txt
file E: \ testfile.dat with 1 thread (0) using mask 0x0 (0)
1 thread reading for 600 secs from file E: \ testfile.dat
using 64KB sequential IOs
enabling multiple I / Os per thread with 1 outstanding
buffering set to use hardware disk cache (but not file cache)
using specified size: 102400 MB for file: E:\testfile.dat
initialization done
CUMULATIVE DATA:
throughput metrics:
IOs/sec: 3908.71
MBs/sec: 244.29
C:\Users\>E:\sqlio.exe -BH -kR -fsequential -t2 -o1 -s600 -b64 -FE:
\param.txt
sqlio v1.5.SG
parameter file used: E:\param.txt
file E:\testfile.dat with 2 threads (0-1) using mask 0x0 (0)
2 threads reading for 600 secs from file E:\testfile.dat
using 64KB sequential IOs
enabling multiple I/Os per thread with 1 outstanding
buffering set to use hardware disk cache (but not file cache)
using specified size: 102400 MB for file: E:\testfile.dat
initialization done
CUMULATIVE DATA:
throughput metrics:
IOs/sec: 7347.13
MBs/sec: 459.19
C:\Users\>E:\sqlio.exe -BH -kR -fsequential -t4 -o1 -s600 -b64 -FE:
\param.txt
sqlio v1.5.SG
parameter file used: E:\param.txt
file E:\testfile.dat with 4 threads (0-3) using mask 0x0 (0)
4 threads reading for 600 secs from file E:\testfile.dat
using 64KB sequential IOs
enabling multiple I/Os per thread with 1 outstanding
buffering set to use hardware disk cache (but not file cache)
using specified size: 102400 MB for file: E:\testfile.dat
initialization done
CUMULATIVE DATA:
throughput metrics:
IOs/sec: 14394.25
MBs/sec: 899.64
C:\Users\>E:\sqlio.exe -BH -kR -fsequential -t8 -o1 -s600 -b64 -FE:
\param.txt
sqlio v1.5.SG
parameter file used: E:\param.txt
file E:\testfile.dat with 8 threads (0-7) using mask 0x0 (0)
8 threads reading for 600 secs from file E:\testfile.dat
using 64KB sequential IOs
enabling multiple I/Os per thread with 1 outstanding
buffering set to use hardware disk cache (but not file cache)
using specified size: 102400 MB for file: E:\testfile.dat
initialization done
CUMULATIVE DATA:
throughput metrics:
IOs/sec: 24678.71
MBs/sec: 1542.41
C:\Users\>E:\sqlio.exe -BH -kR -fsequential -t8 -o2 -s600 -b64 -FE:
\param.txt
sqlio v1.5.SG
parameter file used: E:\param.txt
file E:\testfile.dat with 8 threads (0-7) using mask 0x0 (0)
8 threads reading for 600 secs from file E:\testfile.dat
using 64KB sequential IOs
enabling multiple I/Os per thread with 2 outstanding
buffering set to use hardware disk cache (but not file cache)
using specified size: 102400 MB for file: E:\testfile.dat
initialization done
CUMULATIVE DATA:
throughput metrics:
IOs/sec: 25459.87
MBs/sec: 1591.24
C:\Users\>E:\sqlio.exe -BH -kR -fsequential -t8 -o4 -s600 -b64 -FE:
\param.txt
sqlio v1.5.SG
parameter file used: E:\param.txt
file E:\testfile.dat with 8 threads (0-7) using mask 0x0 (0)
8 threads reading for 600 secs from file E:\testfile.dat
using 64KB sequential IOs
enabling multiple I/Os per thread with 4 outstanding
buffering set to use hardware disk cache (but not file cache)
using specified size: 102400 MB for file: E:\testfile.dat
initialization done
CUMULATIVE DATA:
throughput metrics:
IOs/sec: 25474.61
MBs/sec: 1592.16
C:\Users\>E:\sqlio.exe -BH -kR -fsequential -t8 -o8 -s600 -b64 -FE:
\param.txt
sqlio v1.5.SG
parameter file used: E:\param.txt
file E:\testfile.dat with 8 threads (0-7) using mask 0x0 (0)
8 threads reading for 600 secs from file E:\testfile.dat
using 64KB sequential IOs
enabling multiple I/Os per thread with 8 outstanding
buffering set to use hardware disk cache (but not file cache)
using specified size: 102400 MB for file: E:\testfile.dat
initialization done
CUMULATIVE DATA:
throughput metrics:
IOs/sec: 25474.79
MBs/sec: 1592.17
Sequential Writes Test.txt
C:\Users\>E:\sqlio.exe -BH -kW -fsequential -t1 -o1 -s600 -b64 -FE:
\param.txt
sqlio v1.5.SG
parameter file used: E:\param.txt
file E:\testfile.dat with 1 thread (0) using mask 0x0 (0)
1 thread writing for 600 secs to file E:\testfile.dat
using 64KB sequential IOs
enabling multiple I/Os per thread with 1 outstanding
buffering set to use hardware disk cache (but not file cache)
using specified size: 102400 MB for file: E:\testfile.dat
initialization done
CUMULATIVE DATA:
throughput metrics:
IOs/sec: 8432.26
MBs/sec: 527.01
C:\Users\>E:\sqlio.exe -BH -kW -fsequential -t2 -o1 -s600 -b64 -FE:
\param.txt
sqlio v1.5.SG
parameter file used: E:\param.txt
file E:\testfile.dat with 2 threads (0-1) using mask 0x0 (0)
2 threads writing for 600 secs to file E:\testfile.dat
using 64KB sequential IOs
enabling multiple I/Os per thread with 1 outstanding
buffering set to use hardware disk cache (but not file cache)
using specified size: 102400 MB for file: E:\testfile.dat
initialization done
CUMULATIVE DATA:
throughput metrics:
IOs/sec: 20731.04
MBs/sec: 1295.69
C:\Users\>E:\sqlio.exe -BH -kW -fsequential -t4 -o1 -s600 -b64 -FE:
\param.txt
sqlio v1.5.SG
parameter file used: E:\param.txt
file E:\testfile.dat with 4 threads (0-3) using mask 0x0 (0)
4 threads writing for 600 secs to file E:\testfile.dat
using 64KB sequential IOs
enabling multiple I/Os per thread with 1 outstanding
buffering set to use hardware disk cache (but not file cache)
using specified size: 102400 MB for file: E:\testfile.dat
initialization done
CUMULATIVE DATA:
throughput metrics:
IOs/sec: 25352.71
MBs/sec: 1584.54
C:\Users\>E:\sqlio.exe -BH -kW -fsequential -t8 -o1 -s600 -b64 -FE:
\param.txt
sqlio v1.5.SG
parameter file used: E:\param.txt
file E:\testfile.dat with 8 threads (0-7) using mask 0x0 (0)
8 threads writing for 600 secs to file E:\testfile.dat
using 64KB sequential IOs
enabling multiple I/Os per thread with 1 outstanding
buffering set to use hardware disk cache (but not file cache)
using specified size: 102400 MB for file: E:\testfile.dat
initialization done
CUMULATIVE DATA:
throughput metrics:
IOs/sec: 25420.63
MBs/sec: 1588.78
C:\Users\>E:\sqlio.exe -BH -kW -fsequential -t8 -o2 -s600 -b64 -FE:
\param.txt
sqlio v1.5.SG
parameter file used: E:\param.txt
file E:\testfile.dat with 8 threads (0-7) using mask 0x0 (0)
8 threads writing for 600 secs to file E:\testfile.dat
using 64KB sequential IOs
enabling multiple I/Os per thread with 2 outstanding
buffering set to use hardware disk cache (but not file cache)
using specified size: 102400 MB for file: E:\testfile.dat
initialization done
CUMULATIVE DATA:
throughput metrics:
IOs/sec: 25415.93
MBs/sec: 1588.49
C:\Users\>E:\sqlio.exe -BH -kW -fsequential -t8 -o4 -s600 -b64 -FE:
\param.txt
sqlio v1.5.SG
parameter file used: E:\param.txt
file E:\testfile.dat with 8 threads (0-7) using mask 0x0 (0)
8 threads writing for 600 secs to file E:\testfile.dat
using 64KB sequential IOs
enabling multiple I/Os per thread with 4 outstanding
buffering set to use hardware disk cache (but not file cache)
using specified size: 102400 MB for file: E:\testfile.dat
initialization done
CUMULATIVE DATA:
throughput metrics:
IOs/sec: 25419.91
MBs/sec: 1588.74
C:\Users\>E:\sqlio.exe -BH -kW -fsequential -t8 -o8 -s600 -b64 -FE:
\param.txt
sqlio v1.5.SG
parameter file used: E:\param.txt
file E:\testfile.dat with 8 threads (0-7) using mask 0x0 (0)
8 threads writing for 600 secs to file E:\testfile.dat
using 64KB sequential IOs
enabling multiple I/Os per thread with 8 outstanding
buffering set to use hardware disk cache (but not file cache)
using specified size: 102400 MB for file: E:\testfile.dat
initialization done
CUMULATIVE DATA:
throughput metrics:
IOs/sec: 25418.53
MBs/sec: 1588.65
\param.txt
sqlio v1.5.SG
parameter file used: E:\param.txt
file E:\testfile.dat with 1 thread (0) using mask 0x0 (0)
1 thread writing for 600 secs to file E:\testfile.dat
using 64KB sequential IOs
enabling multiple I/Os per thread with 1 outstanding
buffering set to use hardware disk cache (but not file cache)
using specified size: 102400 MB for file: E:\testfile.dat
initialization done
CUMULATIVE DATA:
throughput metrics:
IOs/sec: 8432.26
MBs/sec: 527.01
C:\Users\>E:\sqlio.exe -BH -kW -fsequential -t2 -o1 -s600 -b64 -FE:
\param.txt
sqlio v1.5.SG
parameter file used: E:\param.txt
file E:\testfile.dat with 2 threads (0-1) using mask 0x0 (0)
2 threads writing for 600 secs to file E:\testfile.dat
using 64KB sequential IOs
enabling multiple I/Os per thread with 1 outstanding
buffering set to use hardware disk cache (but not file cache)
using specified size: 102400 MB for file: E:\testfile.dat
initialization done
CUMULATIVE DATA:
throughput metrics:
IOs/sec: 20731.04
MBs/sec: 1295.69
C:\Users\>E:\sqlio.exe -BH -kW -fsequential -t4 -o1 -s600 -b64 -FE:
\param.txt
sqlio v1.5.SG
parameter file used: E:\param.txt
file E:\testfile.dat with 4 threads (0-3) using mask 0x0 (0)
4 threads writing for 600 secs to file E:\testfile.dat
using 64KB sequential IOs
enabling multiple I/Os per thread with 1 outstanding
buffering set to use hardware disk cache (but not file cache)
using specified size: 102400 MB for file: E:\testfile.dat
initialization done
CUMULATIVE DATA:
throughput metrics:
IOs/sec: 25352.71
MBs/sec: 1584.54
C:\Users\>E:\sqlio.exe -BH -kW -fsequential -t8 -o1 -s600 -b64 -FE:
\param.txt
sqlio v1.5.SG
parameter file used: E:\param.txt
file E:\testfile.dat with 8 threads (0-7) using mask 0x0 (0)
8 threads writing for 600 secs to file E:\testfile.dat
using 64KB sequential IOs
enabling multiple I/Os per thread with 1 outstanding
buffering set to use hardware disk cache (but not file cache)
using specified size: 102400 MB for file: E:\testfile.dat
initialization done
CUMULATIVE DATA:
throughput metrics:
IOs/sec: 25420.63
MBs/sec: 1588.78
C:\Users\>E:\sqlio.exe -BH -kW -fsequential -t8 -o2 -s600 -b64 -FE:
\param.txt
sqlio v1.5.SG
parameter file used: E:\param.txt
file E:\testfile.dat with 8 threads (0-7) using mask 0x0 (0)
8 threads writing for 600 secs to file E:\testfile.dat
using 64KB sequential IOs
enabling multiple I/Os per thread with 2 outstanding
buffering set to use hardware disk cache (but not file cache)
using specified size: 102400 MB for file: E:\testfile.dat
initialization done
CUMULATIVE DATA:
throughput metrics:
IOs/sec: 25415.93
MBs/sec: 1588.49
C:\Users\>E:\sqlio.exe -BH -kW -fsequential -t8 -o4 -s600 -b64 -FE:
\param.txt
sqlio v1.5.SG
parameter file used: E:\param.txt
file E:\testfile.dat with 8 threads (0-7) using mask 0x0 (0)
8 threads writing for 600 secs to file E:\testfile.dat
using 64KB sequential IOs
enabling multiple I/Os per thread with 4 outstanding
buffering set to use hardware disk cache (but not file cache)
using specified size: 102400 MB for file: E:\testfile.dat
initialization done
CUMULATIVE DATA:
throughput metrics:
IOs/sec: 25419.91
MBs/sec: 1588.74
C:\Users\>E:\sqlio.exe -BH -kW -fsequential -t8 -o8 -s600 -b64 -FE:
\param.txt
sqlio v1.5.SG
parameter file used: E:\param.txt
file E:\testfile.dat with 8 threads (0-7) using mask 0x0 (0)
8 threads writing for 600 secs to file E:\testfile.dat
using 64KB sequential IOs
enabling multiple I/Os per thread with 8 outstanding
buffering set to use hardware disk cache (but not file cache)
using specified size: 102400 MB for file: E:\testfile.dat
initialization done
CUMULATIVE DATA:
throughput metrics:
IOs/sec: 25418.53
MBs/sec: 1588.65
We were pleasantly surprised by such a performance indicator, so we made a graph-comparison with ioScale.
I would also like to highlight the question about software, which is set in almost every article we have - monitoring tools. Here, our test subject is not far away from his fellows in the group and also does not support SMART. All that is - is a small utility for Windows, which gives a certain amount of information and allows you to reflash the card.
The card also supports the SNMP protocol. On the technical side, I would also like to note that the card requires high-quality cooling. Even if at the moment it is not used, but simply connected - the heating of the radiator is strong enough (you can hold no more than 10 seconds in your hand), so you need to pay special attention to the quality of the server cooling (for example, put the maximum number of coolers if this has not been done ).
Summing up, perhaps, we can say that the Huawei Tecal ES3000 card is one of the best in class, one of those who have visited us for testing. But not only with its technical indicators we are pleased with the map, it is also a leader in terms of price / quality ratio in this niche of devices.
The warranty on the device is 3 years, but there is also the possibility of acquiring an extension of the warranty to the required level.
Options for additional warranty programs.
Despite the fact that the Huawei brand is more associated with network equipment, their solution has proven to be extremely successful and has several technological features that pleasantly distinguish it from the competitors in this class of equipment.
We remind you that you can get this card to DEMO, or we will provide a remote server with an installed card, configured for your purposes, and you will be able to test remotely. To purchase Huawei or request DEMO, please contact the head of the direction Kotov Alexey .
By KorP
Source: https://habr.com/ru/post/192482/
All Articles