Spiceworks. Part 1: Online Inventory

Good afternoon, habro-community. I would like to devote my first article to a very interesting free product - Spiceworks, which was released a couple of days ago in a new, 7.0, release (at the moment, it is a release candidate).
Spiceworks is a convenient and powerful system that allows you to collect and structure information about your network: hardware, installed software, event logs, network equipment inventory, up to and including the consumption of cartridges in network printers, and much more. And this is not only an inventory system, but also HelpDesk, and now MDM (Mobile Device Manager) in one person.
The rest is probably hidden under the cat, otherwise I can not stop. Who is interested - welcome.
I would not like to stop at the installation, because everything happens at the “Next-Next-Ready” level, and there are enough manuals on the network on this topic anyway.
One caveat - you certainly need a Windows (from XP to 2008 Server), as the main OS.
')
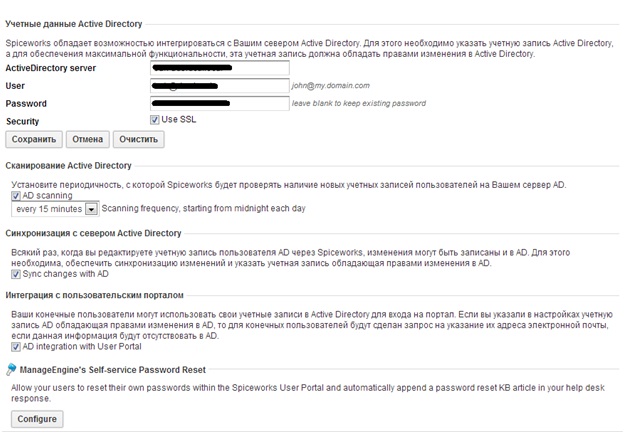
And another important point, it is logical that spiceworks can be integrated with AD. The screenshot shows that you can work with AD from spiceworks, as well as use AD users to register them with spiceworks. In principle, everything seems to be clear here and there should be no problems. Naturally, the account must have domain admin privileges.
Network scan
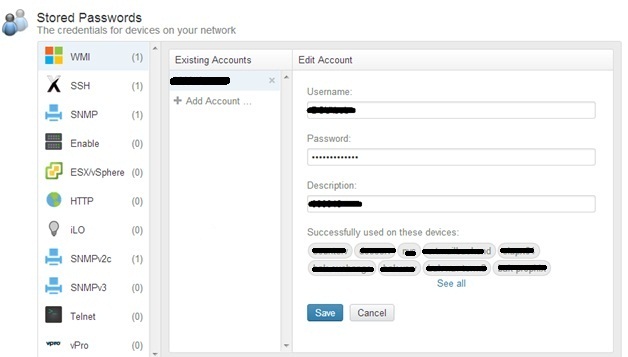
Spiceworks does not require agents or additional software to scan. All that is required of you is to feed the domain admin account with its settings with which it will go through the network (in this case, you can select different credentials for different services that spiceworks will use)
Before scanning, the program needs to set the intervals within which it will have to keep itself (IT resources-Settings-Network Scan). These intervals can be found by scanning the entire network, and then removing unnecessary subnets. I went the easiest way - I unloaded all computers I had from the internal DNS, and on the basis of this list I made a breakdown of the scan intervals.
In version 7.0, it became possible to exclude some computers from scanning within the selected subnet (interval), but these exceptions specify specific ip addresses, not intervals, which is not very convenient.
Scanning just over 1000 computers (approximately 25 subnets) takes about 10-11 hours.
In version 7.0, the developers added an interface that shows the scan results in general. Unfortunately, it is terribly slow (2-3 minutes open), and somewhat uncomfortable. Scanned machines are visible here, but the main thing is scanning errors. In version 7.0 they were classified grouped. Login errors, ping errors, “access denied” errors - all this can be seen here. Here you can also fix - add a personal Admin account for this device, or read interesting instructions ...
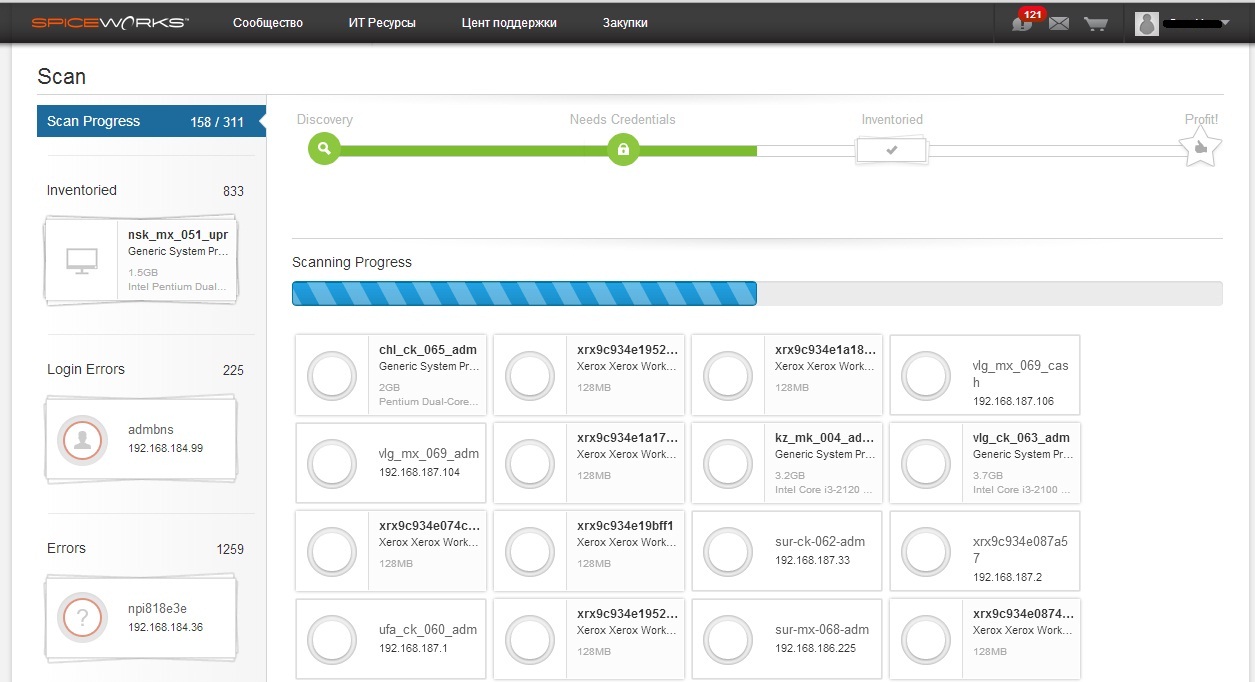
Sorry, inconvenient, there is no exact time of fixing the error. The scanning process can only be monitored on a running percentage line.
Scan results
The results are displayed on the main panel, the composition of which you can customize yourself as you like.
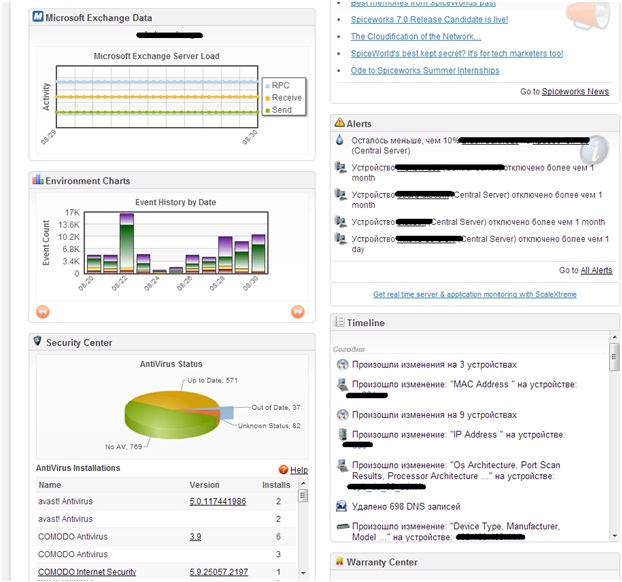
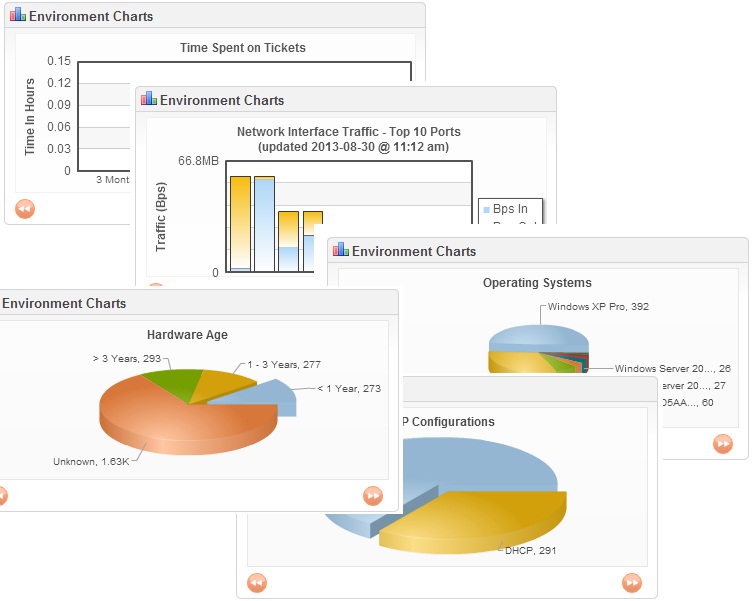
The Environment Events window can show different equipment states on the network:
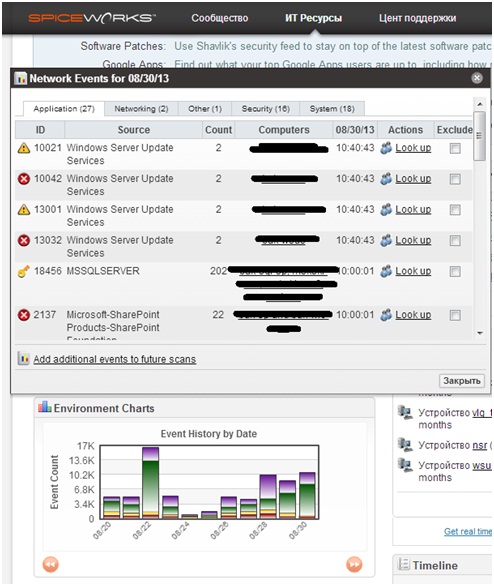
- Events History by Date - errors and alerts from event logs are displayed here. The schedule is set up, you can remove certain events and errors in the exceptions by pointing to the column with the mouse and checking the “Delete” checkbox. For each event, a description is entered in the community, but it is not always complete (and sometimes completely absent). Perhaps this is the most interesting "state" of the Environment Events window.
- Time spend on Ticket - I suspect this is the time spent on requests from HelpDesk. We do not use this function, so for now I can’t say anything concrete here.
- Network Interface Traffic - the name speaks for itself.
- Operating System - the percentage of different operating systems in the company.
- Manufacturers - the percentage of various iron manufacturers in the company.
- Ip Configurations - the percentage of who got his IP.
- Hardware Age - how old is the hardware?
- Open ticket by user - something incomprehensible. Apparently who has opened as many applications as a percentage (in terms of users).
Frankly, I feel the need only in the first state of the window, namely in the Events History by Date . Monitoring and excluding events (eventid.net turned out to be indispensable in this regard, where descriptions were found for almost all events) are quite convenient.
Window Alerts
The system warnings are displayed, mainly for company resources: computers / servers, printers, and so on. These alerts can be configured so that they will come to you in the mail. (The function is somewhat meaningless, in my opinion). Which alerts are worth attention, you can also customize (IT Resources-Settings-Monitors and Alerts). In version 7.0 there was an opportunity to include in this list and events, and therefore, to send letters of happiness, in the case of a specific event.
To expand the Alerts window , click on “Go to All Alerts”. In this case, we get to the Equipment window, which is described below.
AntiVirus Status window
This state is also in the Environment Events window. Different antivir in percentage. Everything is clickable, i.e. by clicking on one or another product, after just a few minutes you can see on which computers it stands.
Timeline window
It shows various changes in the system, installing software and services, changing IP / MAC and iron in general, and so on. For a common understanding of the situation, so to speak.
Mysterious Exchange window displays mysterious non-clickable traffic statistics sent-received-RPC without vertical scale.
Building reports
The scan results allow us not only to see beautiful colored “cheese” circles on the main panel, but also to build some interesting reports (IT Resources-Reports).
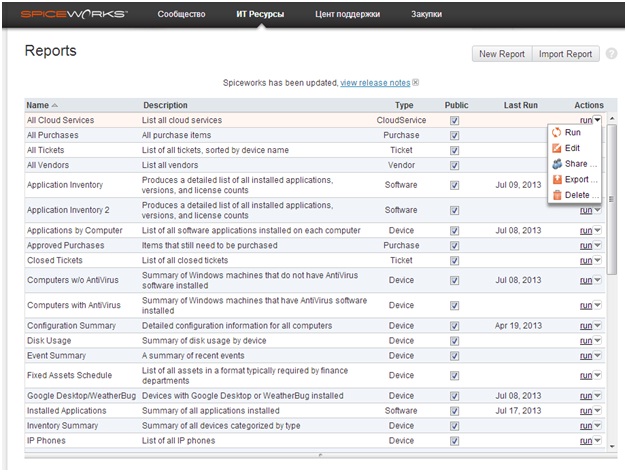
There are a lot of reports, their fields can be configured (the Edit button), and the result is uploaded to a pdf, xls or csv file.
For example, Application Inventory can be done in the context of computers (that is, on which computers is this or that application), but it is possible in the context of applications (that is, on how many computers - without their indication - this or that set of applications). Yes, this is not always convenient, sometimes you have to “finish” the obtained result with Excel-macros - especially if there is a lot of data - but on the whole a very good and positive tool.
I also want to note that in order to compile some reports, you must first enter the information into the system. Those. In the sample application report there is a “license” column. Spiceworks does not know whether this or that software is paid for; it needs to “tell” it first. It is routine and long, but, such moments, as a rule, are one-time.
The list of reports can be supplemented from the Extension Center.
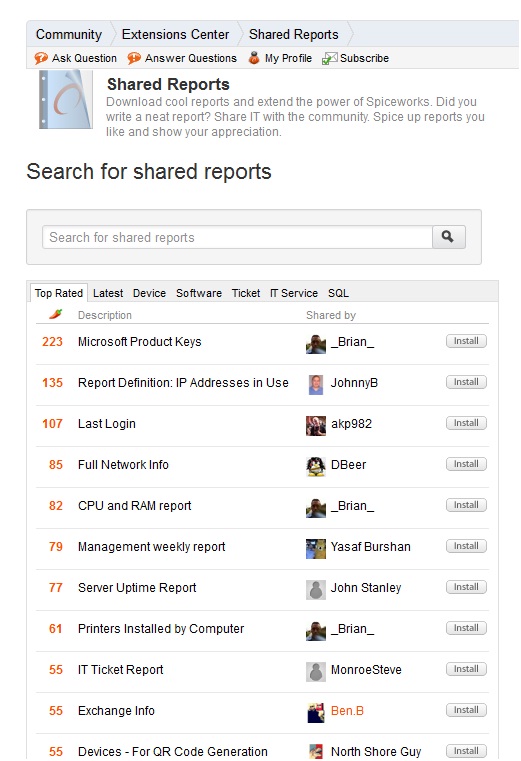
Where they (reports) are structured and categorized. What is convenient - you only need to register once in the community, and you can directly install reports, plugins and extensions on your local server directly from community.spiceworks.com.
All add-ons are written by a free community of programmers, as well as, in fact, by the spiceworks development team. The community itself has about half a million different it-involved people and continues to grow actively.
Equipment
In spiceworks, a fairly flexible system for viewing equipment (IT Resources-Equipment). Those. the information that was collected during the scan can be selectively viewed, depending on what you need.
In other words, this tab is convenient for those who know
For example, the equipment itself is divided into types (Servers / Computers / Printers / Network equipment, etc.) or groups AD, in which it consists. Next, you can select the "property" of this or that equipment. From the installed program to the last login of a specific user. The network equipment, of course, has its own selection parameters and "properties".
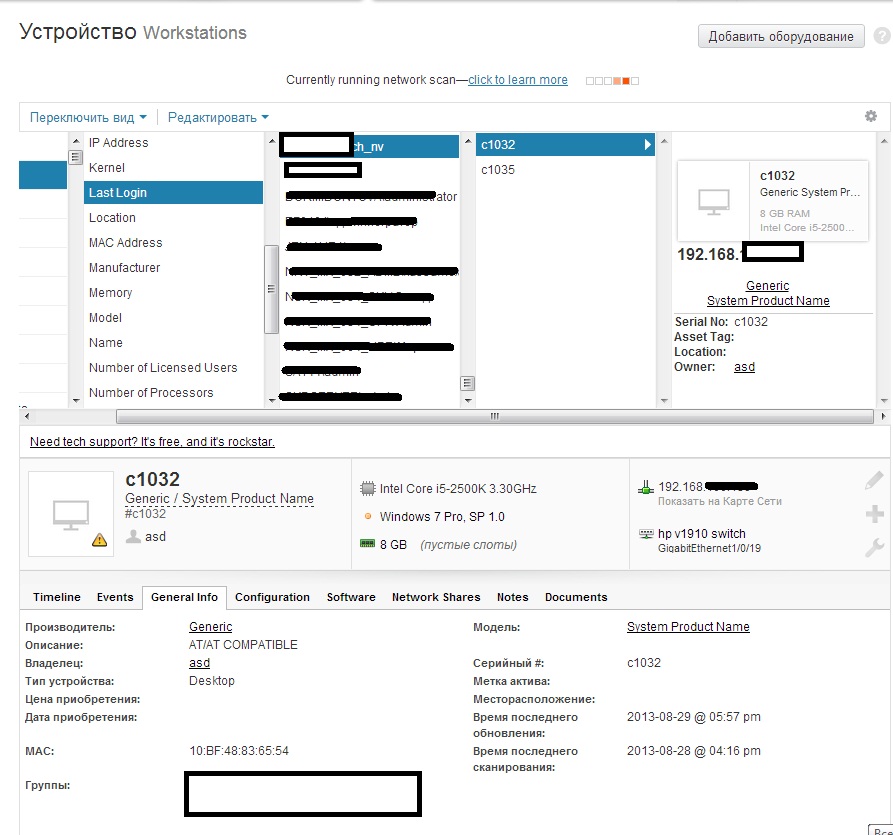
Convenient and practical.
Also in this window you can see Alerts, events, installed applications, etc. in the context of computers in more detail. If you go from Go to All Alerts - you can see all the alerts, then you can narrow the filter.
Network map
After scanning, spiceworks can build some kind of network map.
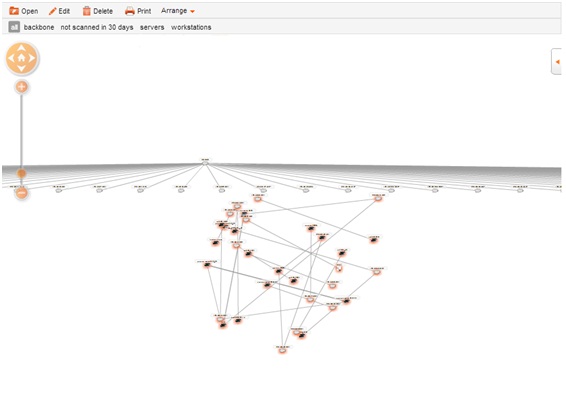
I cannot say that I liked it very much and made it clear, but the fact is a fact - there is such a function. The map is absolutely clickable in every sense. It can be edited, printed, saved and deleted.
Summarize
I would like to summarize spiceworks as a monitoring and inventory system. Since article only about these functions, then the pros / cons will be discussed in the appropriate way
pros
1. The first and main plus is of course open source. The program is currently completely free, which only affects the form of a banner with ads on the main panel (which you can peek at the browser settings).
2. A fairly complete inventory of hardware and software on the network.
3. Supplemental improvements of the free community.
4. Event logs in one place, customizable for critical events for you .
Minuses
1. There is no correlation of events. In general, very little attention is paid to their setting.
2. Requires some routine investment of information.
3. Web interface brakes.
At this point I’ll probably finish the article for today, although there were a lot more plans, and I’m afraid I’m not able to describe all Spiceworks inventory tools.
If it is claimed - I will write a small series of articles - I still have not covered MDM and HelpDesk, at least.
I will be glad to your comments.
Source: https://habr.com/ru/post/192280/
All Articles