Performance obsession or profiling experience in a virtual environment
Let's be frank: an inefficiently working application causes discomfort to most developers. Sometimes the pursuit of performance has an almost sporty nature, not related to direct duties. On Habré, as in the lives of many of us, there are many impressive examples of victories over inefficiency of various kinds . In general, a good developer is familiar with the tools and techniques of profiling. In this same article, I would like to review the profiling process in the virtual environment of Parallels Desktop 9 for Mac and VMWare Fusion 5. Test cases, debriefing and hypervisor insides are waiting for you under the cat in the most brutal form.
This is the very first question that may arise when reading this article. Of course, with the help of simple devices you can turn a loaf of white (or black) bread into a trolley bus ... but who, in fact, may need to run profiling inside a virtual machine? It's time to recall the happy owners of Macs, who, as a matter of duty, have to develop under Windows or Linux. Mac OS, of course, in this case will not interfere with the developer: VMWareFusion is installed on the machine, and Visual Studio is inside the Windows virtual machine, so, in principle, the development is on and there are no problems. Exactly until the question of profiling applications arises. I think you are familiar with the cycle of articles from Intel on optimization based on data collected by the Intel VTune Amplifier profiler ( one of them , for example), and if not, now is the time. So, having armed with VTune installed inside the virtual machine, let's proceed to profiling.
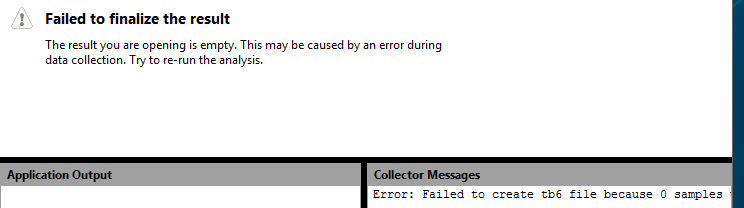
So, VTune Amplifier is installed in the virtual machine, and it was decided to analyze the component for optimal memory handling. Analysis launched, and voila:
')
No results. The reason for this is that the profiler relies on a set of hardware performance counters, also known as the Performance Monitoring Unit, in its work. Each of the counters can be configured for a certain processor event (for example, a processor tick or a cache miss), when it occurs, it increases by one. A unique feature of the collection of performance indicators using counters in comparison with software instrumentation is the completeness of information. You find not only frequently executed code, but also code that causes, for example, frequent cache misses. The value of the counters can be recognized by continuous polling, and you can configure the generation of an interrupt when the counter exceeds a certain threshold value. The latter is more popular among profilers, and a simplified scheme of work often looks like this (in the figure we have a single core processor, and the profiler is executed at the initial moment of time):
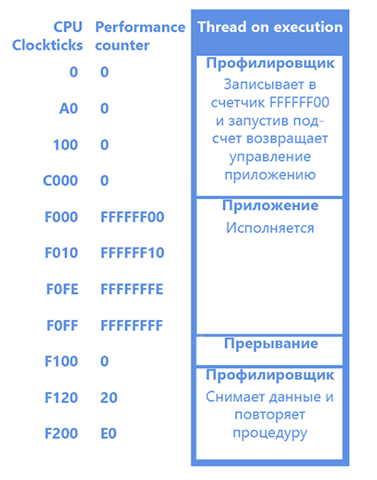
Having received an interrupt on the counter overflow, we will know that 0xFF events have occurred since the installation of the counter. After that, we add the Instruction Pointer of the profiled application on which the interruption occurred, and we believe that the instruction pointed to by this same IP caused 0xFF events. So we collect statistics.
Cheating! The fact that events were caused not only by this single instruction, but by the whole block that was in execution between the two interruptions, did not escape the attentive reader’s gaze. Nevertheless, the results of profiling do not lose their relevance for two main reasons: the number of events between two interruptions is chosen small enough to obtain adequate statistics, and the results can always be improved by increasing the sample (longer we profile - more accurate results). In addition, there is a technology Precise Event Based Sampling, which allows you to collect accurate statistics on some events.
Inside the virtual machine, it’s not possible to access the counters, because, obviously, access to them must be emulated (if we give access to them directly, then the guest and host operating systems will erase each other’s data, and profiling will not work). Having received the error described above, we conclude: PMU is not virtualized in VMWare Fusion. This would be the end of the article, but ...
... if you are the proud owner of VMWareFusion 5, then in the CPU settings you can tick the “Virtualize CPU Performance Counters”, after which the profiler can work inside the virtual machine, relying on emulated performance counters.
Consider the component that will be analyzed using the profiler inside the VM. It consists of the following: a data structure of type tSharedData, on which the two threads together perform some operations. Two semaphores are used for synchronization, and the streams are in turn written into shared data. At the same time, the third stream is running, which reads the value of the Time Stamp Counter, and transmits it to the structure mentioned above.
The code of two worker threads (nThreadNum determines the number of the thread):
Third Stream Code:
In general, it is a rather synthetic example, but it is possible to see quite clearly the effects that occur when profiling in a virtualized environment. We carry out the analysis for 20 seconds, and we get:
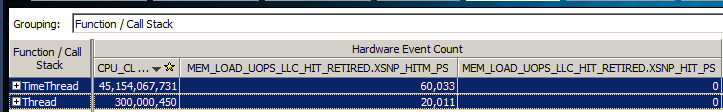
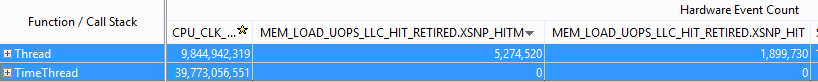
The second column in this table is the number of processor ticks spent on executing functions from the first column. But we are more interested in the following two columns: MEM_LOAD_UOPS_LLC_HIT_RETIRED.XSNP_HIT (M) - the number of performed (RETIRED) operations (OUPS) load (LOAD) data (MEM), which turned out to be (HIT) in LLC (M) modified (Hereinafter cache misses are misses first two levels of caches). And we see the following result: both threads roughly equally vigorously cause the process of synchronization of caches of different cores of the last level, thereby causing performance problems. In principle, the result is expected: all three threads are constantly accessing shared memory, so synchronization of caches is an inevitable thing if the data are not properly aligned. It remains only to take a deep breath, start optimizing. Still, we performed profiling in a virtualized environment, and I can easily verify the results by examining this code on a real machine that VMware Workstation was working on. And the results ...
... differ dramatically. As you can see, the stream that read the TSC values caused a scanty amount of LLC downloads of data (both modified and not modified), compared to the first two streams. So inside the virtual machine, we intend confusing data. A natural question arises:
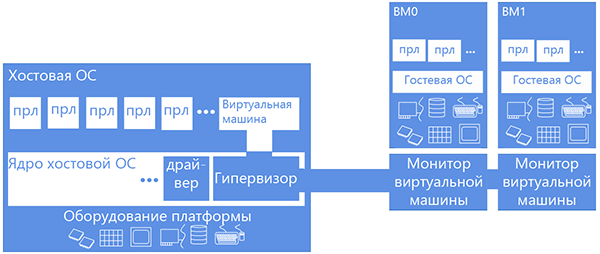
Gain more air in the chest: to answer this question, we will have to dive a bit into the details of how virtual machines work, specifically virtual machines that use hardware virtualization using the example of Intel Virtualization Technology or VT-x. This technology adds another processor mode — the non-root mode. When operating in this mode, accessing equipment / system resources (such as a page conversion table or interrupt table) causes switching to a specially installed handler, running in the “normal”, root mode on the zero ring. The virtual component containing this handler is usually called the virtual machine monitor. The trick is that the VT-x technology allows you to configure whether the guest system will be given direct access to the resource or this access will be emulated. For example, let the guest read the real time-stamp counter, but in no case will we let him dig into the page conversion table, and we will get him his own (shadow) - let him pick it up.
So, PMU virtualization is basically the virtualization of an impressive number of counters that we either emulate or give to the guest in full use (while carefully keeping the context of the native (host) OS). If we consider that the first is a lot of the same type of code multiplied by the inefficiency of private root / non-root switching (each call to the counter will cause the VM monitor to intervene), then the choice of virtual machine developers is obvious - let the guest own the counters unhindered. This was done first in KVM, but profiling the guest TCP stack gave an unexpectedly meager percentage of time to work with the equipment. For work went in the monitor, outside the profiled guest who did not have access to the hardware. And then their heads were visited by a bright idea: what if we take into account the events that occurred in the monitor? No sooner said than done. Now equipment operations have become weighted.
BUT!
At the same time, weighting is caused not by taking into account the overhead costs from the equipment, but by taking into account the additional load from virtualization, which generally does not correlate well with the load from the equipment. So we are even further away from reality, although in some cases the results of profiling look more “plausible.” On the movement of thoughts of developers can be read here .
VMWare Fusion 5 developers also tackled similar questions about PMU virtualization: They slightly changed the concept of virtualization: all events were divided into “non-speculative” (such as the number of instructions executed, the number of branchings, and other metrics that have a “deterministic” nature: how many instructions are there in the code or conditional transitions - so many of them will be counted), and “speculative” (such as cache misses and incorrectly predicted branches). At the same time, “speculative” events were calculated taking into account the hypervisor load, and “non-speculative” ones - without (a more complete description of the concept here ). Understanding this logic is not difficult: when there are only 20 instructions in the function code, and measurements show that 220 (due to the fact that the operation of the virtual machine monitor is taken into account), then, as it is not difficult to guess, such results can be confusing. But at the same time, by measuring the “speculative” metrics, we can still meet the results of measurements that we should not rely on when optimizing, as we saw above.
Now we can answer the question of where such a difference in the results. The function of time subtraction calls the RDTSC instruction, which is emulated, and has a complicated work logic (timekeeping in virtual machines is generally a sore subject for hypervisor developers). From here and the mass of cache misses: there is much more work than expected on the RDTSC call.
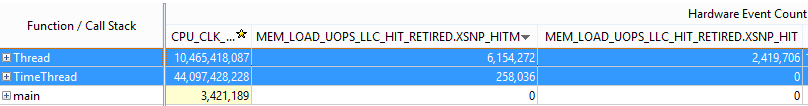
Of course, our immersion into the world of hypervisors would be incomplete if the Parallels Desktop 9 virtual machine remains out of consideration. This virtual machine also added the ability to access the PMU from the guest system, but the approach to virtualization was chosen somewhat different: events are counted only in the context of the guest system - all the influence of the monitor on the measurement results is minimized. Let's try profiling inside this virtual machine and compare the results.
As you can see, the results correlate more strongly with the results on real hardware than in VMWareFusion. (A stream subtracting time causes a meager amount of cache misses). The nature of the ratio between the number of events that occurred in each of the streams is maintained. The zero number of cache misses caught in TimeThread in a virtual machine can be confusing, but this only means that about 2000 cache misses occurred - this is the threshold for triggering the cache misses counter. But in general, we observe characteristic effects and can further optimize based on the values found.
Nevertheless, an important question remains: so how to deal with the fact that part of the workload associated with virtualized operations falls out of statistics? Of course, this is an unpleasant effect, but it is worth noting the following: 99% of the time a virtual machine works without monitor intervention, that is, the loss of some statistics will often be almost imperceptible to us. But the main thing is that this approach is more predictable than in the case of Fuison: if we found a number of effects in our code, then they will manifest themselves on real hardware, unlike the VMWare virtual machine, in which effects can be detected that cannot be reproduced on real hardware.
The one who read the article up to this point is truly strong in spirit. Many other effects that arise when trying to profile in a virtual environment are beyond the scope of the discussion, but the purpose of this article is to describe the key differences in profiling in different environments, knowing about which you can avoid some problems with the interpretation of the results of performance measurements. Summing up:
- The law of leaky abstractions is still relevant, and it is worth being doubly focused while working in a virtual environment.
- If profiling in a virtualized environment is the only possible approach to analyzing performance, then you should be alert - operations with time and equipment can produce serious artifacts in the results when measuring the effects of hardware effects.
- In general, in a virtual machine, you can collect significant statistics, based on which you can optimize applications.
Thank you all for your attention!
Who needed to run the profiler inside a virtual machine?
This is the very first question that may arise when reading this article. Of course, with the help of simple devices you can turn a loaf of white (or black) bread into a trolley bus ... but who, in fact, may need to run profiling inside a virtual machine? It's time to recall the happy owners of Macs, who, as a matter of duty, have to develop under Windows or Linux. Mac OS, of course, in this case will not interfere with the developer: VMWareFusion is installed on the machine, and Visual Studio is inside the Windows virtual machine, so, in principle, the development is on and there are no problems. Exactly until the question of profiling applications arises. I think you are familiar with the cycle of articles from Intel on optimization based on data collected by the Intel VTune Amplifier profiler ( one of them , for example), and if not, now is the time. So, having armed with VTune installed inside the virtual machine, let's proceed to profiling.
Virtual Machine Profiling
So, VTune Amplifier is installed in the virtual machine, and it was decided to analyze the component for optimal memory handling. Analysis launched, and voila:
')
No results. The reason for this is that the profiler relies on a set of hardware performance counters, also known as the Performance Monitoring Unit, in its work. Each of the counters can be configured for a certain processor event (for example, a processor tick or a cache miss), when it occurs, it increases by one. A unique feature of the collection of performance indicators using counters in comparison with software instrumentation is the completeness of information. You find not only frequently executed code, but also code that causes, for example, frequent cache misses. The value of the counters can be recognized by continuous polling, and you can configure the generation of an interrupt when the counter exceeds a certain threshold value. The latter is more popular among profilers, and a simplified scheme of work often looks like this (in the figure we have a single core processor, and the profiler is executed at the initial moment of time):
Having received an interrupt on the counter overflow, we will know that 0xFF events have occurred since the installation of the counter. After that, we add the Instruction Pointer of the profiled application on which the interruption occurred, and we believe that the instruction pointed to by this same IP caused 0xFF events. So we collect statistics.
Cheating! The fact that events were caused not only by this single instruction, but by the whole block that was in execution between the two interruptions, did not escape the attentive reader’s gaze. Nevertheless, the results of profiling do not lose their relevance for two main reasons: the number of events between two interruptions is chosen small enough to obtain adequate statistics, and the results can always be improved by increasing the sample (longer we profile - more accurate results). In addition, there is a technology Precise Event Based Sampling, which allows you to collect accurate statistics on some events.
Inside the virtual machine, it’s not possible to access the counters, because, obviously, access to them must be emulated (if we give access to them directly, then the guest and host operating systems will erase each other’s data, and profiling will not work). Having received the error described above, we conclude: PMU is not virtualized in VMWare Fusion. This would be the end of the article, but ...
PMU Virtualization in VMWare Fusion 5
... if you are the proud owner of VMWareFusion 5, then in the CPU settings you can tick the “Virtualize CPU Performance Counters”, after which the profiler can work inside the virtual machine, relying on emulated performance counters.
Consider the component that will be analyzed using the profiler inside the VM. It consists of the following: a data structure of type tSharedData, on which the two threads together perform some operations. Two semaphores are used for synchronization, and the streams are in turn written into shared data. At the same time, the third stream is running, which reads the value of the Time Stamp Counter, and transmits it to the structure mentioned above.
The code of two worker threads (nThreadNum determines the number of the thread):
DWORD WINAPI Thread(LPVOID lpParameter) { tThreadParam* pParams = (tThreadParam*)lpParameter; tSharedData* pData = pParams->pSharedData; while( pData->nIsWorking ) { if( pParams->nThreadNum == 1 ) { // First Thread pData->nLastThread = nCurrent; ReleaseSemaphore( pData->hSecondThreadSemaphore,1,NULL ); WaitForSingleObject( pData->hFirstThreadSemaphore, INFINITE ); }else{ //Second thread WaitForSingleObject( pData->hSecondThreadSemaphore, INFINITE ); pData->nLastThread = nCurrent; ReleaseSemaphore( pData->hFirstThreadSemaphore,1,NULL ); } } return 0; } Third Stream Code:
DWORD WINAPI TimeThread(LPVOID lpParameter) { tSharedData* pData = (tSharedData*)lpParameter; while( pData->nIsWorkingCacheAligned ) // , { // pData->nCurrentTime = __rdtsc(); } return 0; } In general, it is a rather synthetic example, but it is possible to see quite clearly the effects that occur when profiling in a virtualized environment. We carry out the analysis for 20 seconds, and we get:
The second column in this table is the number of processor ticks spent on executing functions from the first column. But we are more interested in the following two columns: MEM_LOAD_UOPS_LLC_HIT_RETIRED.XSNP_HIT (M) - the number of performed (RETIRED) operations (OUPS) load (LOAD) data (MEM), which turned out to be (HIT) in LLC (M) modified (Hereinafter cache misses are misses first two levels of caches). And we see the following result: both threads roughly equally vigorously cause the process of synchronization of caches of different cores of the last level, thereby causing performance problems. In principle, the result is expected: all three threads are constantly accessing shared memory, so synchronization of caches is an inevitable thing if the data are not properly aligned. It remains only to take a deep breath, start optimizing. Still, we performed profiling in a virtualized environment, and I can easily verify the results by examining this code on a real machine that VMware Workstation was working on. And the results ...
... differ dramatically. As you can see, the stream that read the TSC values caused a scanty amount of LLC downloads of data (both modified and not modified), compared to the first two streams. So inside the virtual machine, we intend confusing data. A natural question arises:
What is wrong with PMU virtualization?
Gain more air in the chest: to answer this question, we will have to dive a bit into the details of how virtual machines work, specifically virtual machines that use hardware virtualization using the example of Intel Virtualization Technology or VT-x. This technology adds another processor mode — the non-root mode. When operating in this mode, accessing equipment / system resources (such as a page conversion table or interrupt table) causes switching to a specially installed handler, running in the “normal”, root mode on the zero ring. The virtual component containing this handler is usually called the virtual machine monitor. The trick is that the VT-x technology allows you to configure whether the guest system will be given direct access to the resource or this access will be emulated. For example, let the guest read the real time-stamp counter, but in no case will we let him dig into the page conversion table, and we will get him his own (shadow) - let him pick it up.
So, PMU virtualization is basically the virtualization of an impressive number of counters that we either emulate or give to the guest in full use (while carefully keeping the context of the native (host) OS). If we consider that the first is a lot of the same type of code multiplied by the inefficiency of private root / non-root switching (each call to the counter will cause the VM monitor to intervene), then the choice of virtual machine developers is obvious - let the guest own the counters unhindered. This was done first in KVM, but profiling the guest TCP stack gave an unexpectedly meager percentage of time to work with the equipment. For work went in the monitor, outside the profiled guest who did not have access to the hardware. And then their heads were visited by a bright idea: what if we take into account the events that occurred in the monitor? No sooner said than done. Now equipment operations have become weighted.
BUT!
At the same time, weighting is caused not by taking into account the overhead costs from the equipment, but by taking into account the additional load from virtualization, which generally does not correlate well with the load from the equipment. So we are even further away from reality, although in some cases the results of profiling look more “plausible.” On the movement of thoughts of developers can be read here .
VMWare Fusion 5 developers also tackled similar questions about PMU virtualization: They slightly changed the concept of virtualization: all events were divided into “non-speculative” (such as the number of instructions executed, the number of branchings, and other metrics that have a “deterministic” nature: how many instructions are there in the code or conditional transitions - so many of them will be counted), and “speculative” (such as cache misses and incorrectly predicted branches). At the same time, “speculative” events were calculated taking into account the hypervisor load, and “non-speculative” ones - without (a more complete description of the concept here ). Understanding this logic is not difficult: when there are only 20 instructions in the function code, and measurements show that 220 (due to the fact that the operation of the virtual machine monitor is taken into account), then, as it is not difficult to guess, such results can be confusing. But at the same time, by measuring the “speculative” metrics, we can still meet the results of measurements that we should not rely on when optimizing, as we saw above.
Now we can answer the question of where such a difference in the results. The function of time subtraction calls the RDTSC instruction, which is emulated, and has a complicated work logic (timekeeping in virtual machines is generally a sore subject for hypervisor developers). From here and the mass of cache misses: there is much more work than expected on the RDTSC call.
Parallels Desktop 9
Of course, our immersion into the world of hypervisors would be incomplete if the Parallels Desktop 9 virtual machine remains out of consideration. This virtual machine also added the ability to access the PMU from the guest system, but the approach to virtualization was chosen somewhat different: events are counted only in the context of the guest system - all the influence of the monitor on the measurement results is minimized. Let's try profiling inside this virtual machine and compare the results.
As you can see, the results correlate more strongly with the results on real hardware than in VMWareFusion. (A stream subtracting time causes a meager amount of cache misses). The nature of the ratio between the number of events that occurred in each of the streams is maintained. The zero number of cache misses caught in TimeThread in a virtual machine can be confusing, but this only means that about 2000 cache misses occurred - this is the threshold for triggering the cache misses counter. But in general, we observe characteristic effects and can further optimize based on the values found.
Nevertheless, an important question remains: so how to deal with the fact that part of the workload associated with virtualized operations falls out of statistics? Of course, this is an unpleasant effect, but it is worth noting the following: 99% of the time a virtual machine works without monitor intervention, that is, the loss of some statistics will often be almost imperceptible to us. But the main thing is that this approach is more predictable than in the case of Fuison: if we found a number of effects in our code, then they will manifest themselves on real hardware, unlike the VMWare virtual machine, in which effects can be detected that cannot be reproduced on real hardware.
Summary
The one who read the article up to this point is truly strong in spirit. Many other effects that arise when trying to profile in a virtual environment are beyond the scope of the discussion, but the purpose of this article is to describe the key differences in profiling in different environments, knowing about which you can avoid some problems with the interpretation of the results of performance measurements. Summing up:
- The law of leaky abstractions is still relevant, and it is worth being doubly focused while working in a virtual environment.
- If profiling in a virtualized environment is the only possible approach to analyzing performance, then you should be alert - operations with time and equipment can produce serious artifacts in the results when measuring the effects of hardware effects.
- In general, in a virtual machine, you can collect significant statistics, based on which you can optimize applications.
Thank you all for your attention!
Source: https://habr.com/ru/post/192176/
All Articles