Sonar principles and underwater acoustics: how, why and why
 Sonars are used to detect and research underwater objects, while similar devices, called radars, are used to study surface, ground, air, and space objects. Much of what is said below about sonar is also true for radar, or has obvious similarities.
I noticed that there are no materials on this topic on the Internet, describing all the processes in connection with each other and in clear words. In the article we will go all the way from the peculiarities of sound waves propagation in water to the processes inside the sonar. I intend to do this simply and clearly in order to interest both curious readers and those who in 2 hours have to pass an oral examination in underwater acoustics. It is assumed, of course, that someone from one or another designated group may not have any knowledge on this topic, so everything will start with the basics.
Long before Sheldon helps to deal with the Doppler effect, we dive under the water to begin our acquaintance with how the sound waves propagate in the aquatic environment and how it depends.
')
Nature of sound under water
Oscillations are movements that are to some extent repeated in time. The oscillating body can give its energy to the external environment. Sound is mechanical vibrations in any environment. Particles (molecules) of the environment are miniature oscillatory systems, which are connected with each other elastically, therefore the oscillation created by the body can propagate in the medium for some distance. Water, unlike air, has the ability to propagate sound vibrations over very long distances, this is the reason for using sound waves under water. Electromagnetic waves instead of sound ones cannot be used: they do not spread in water.
The propagation of sound waves in the aquatic environment is influenced by many factors: the frequency and amplitude of the sound wave, temperature, salinity and depth of water, the distance of sound propagation (and the associated gradual transformation of sound into heat - absorption), as well as other local factors (inhomogeneities in water , areas with turbulence, the state of the water surface - air bubbles, rain and wind (bottom type - silt, sand, gravel or rock).
The higher the temperature, salinity, depth, i.e. the higher the density of water - the higher the speed of sound. Changes in these three parameters also affect the curvature of the direction of sound in water, as well as the magnitude of the spatial angle of propagation.
Often in temperate latitudes, the temperature in the surface layers of water decreases rapidly, which reduces the speed of sound, focuses the sound wave at a certain depth, removing it from the surface. On the contrary, when the temperature at the surface is constant (for example, in the tropics, the water warms up quite deeply), only the depth affects the speed of sound, and because of this, the speed of sound in surface waters increases only due to the depth. In such waters, the sound focuses near the surface, constantly reflecting from it and returning to it again. The average speed of sound in water is 1480 meters per second, the boundary speeds are from 1450 to 1540 m / s.
The higher the frequency of the sound, the faster it dissipates. This is caused by the transformation of sound energy into heat, dissipation due to inhomogeneities in water and at a suitable depth by attenuation at the bottom (first of all, if the bottom is silt or sand) or near the surface due to rain, wind, air bubbles, etc. ; when calm, surface losses are insignificant, since the surface of the water reflects more than 99% of the sound.
All this data allows you to create templates of sonar settings and calculate the possible time and paths of propagation of sound waves, adjust the sonar with maximum efficiency.
Sonar antenna design
The sonar transmitting antenna oscillates in the audio frequency range and produces sound waves. The sound-emitting surface of the antenna is called the aperture.
Apertures are continuous and discrete, that is, having many separate radiating elements.
Discrete apertures can be viewed as containing many continuous apertures. Elements of discrete apertures are at a certain distance from each other, so the waves emitted by them will come to a goal at different times. This fact is taken into account when generating waves, when the direction of the sound beam, as well as on the arrival of the reflected waves.
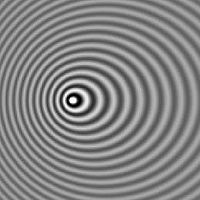
Sound waves emitted by apertures exert pressure on the water layers around, so we can talk about the distribution of pressure of the sound wave around the aperture, let's call it the form of an acoustic beam. Here is an example of this form:
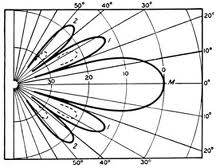
Sound vibrations, as well as any vibrations, due to their elastic nature have minima and maxima, alternating each other and opposite to each other in amplitude. Initially, in a wave, the minima and maxima are at a certain distance from each other in time and space, that is, they are out of phase. Owing to radiation, sound waves tend to unite, being in different phases, that is, they amplify or cancel each other. This is called interference.
The side lobes in the images above arise from the fact that the energy from the antenna spreads not only frontally, but also in adjacent directions; they have minima and maxima due to interference. Side lobes are undesirable, since they have amplitudes and frequencies different from the main lobe, and this causes interference.
As you can imagine, the beam opens at a certain spatial angle. If we consider the horizontal and vertical planes, then these are two angles - vertical (angle of elevation) and horizontal (azimuth). By expanding these angles on a plane, you can show the shape of the beam in a more visual form:
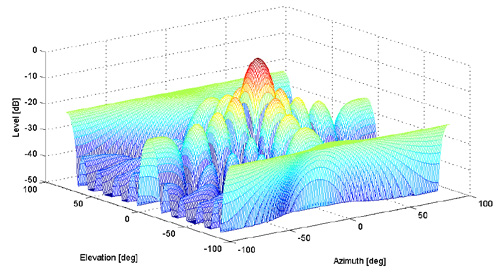
Apertures come in different geometric shapes and therefore produce different beams. The figure above, for example, shows the beam shape for a rectangular aperture. There are also circular apertures, either linear (similar to a segment of a certain length), or even apertures in the form of three-dimensional forms, for example, paraboloids. You can imagine what the shapes of the beams look like for them. For example, for a circular aperture, side lobes decrease radially, and not in the form of a cross, as in the figure above. In the case of a paraboloid shape, an increase in the main lobe occurs at the expense of the neighboring.
If the diagram above is cut in the center, here’s what we’ll see:
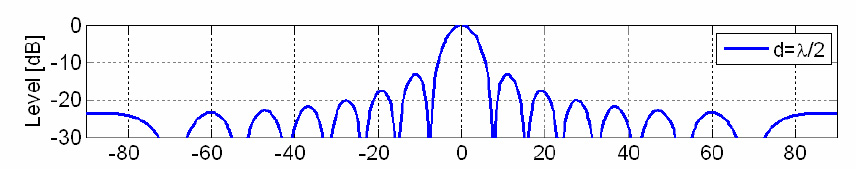
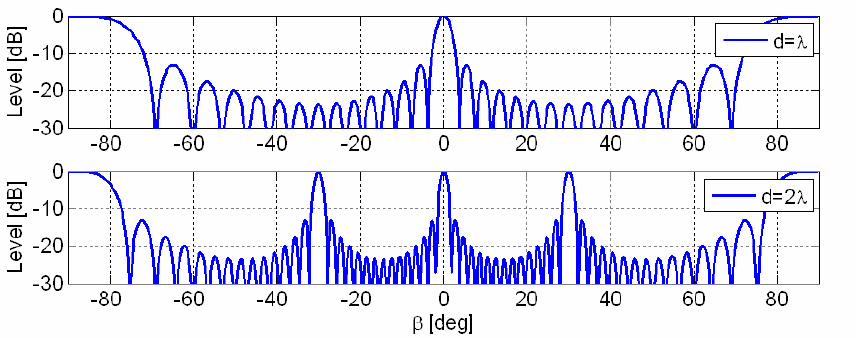
Wavelength is the distance that a wave travels during one oscillation. And the time during which it travels this distance is called a period. If the distance between two sound-emitting elements of a discrete aperture becomes more than half the wavelength, side lobes begin to increase, and as the wavelength decreases further, new lobes appear that are equal in amplitude to the main one, which introduces interference and is an undesirable fact: what kind of petal is the cause.
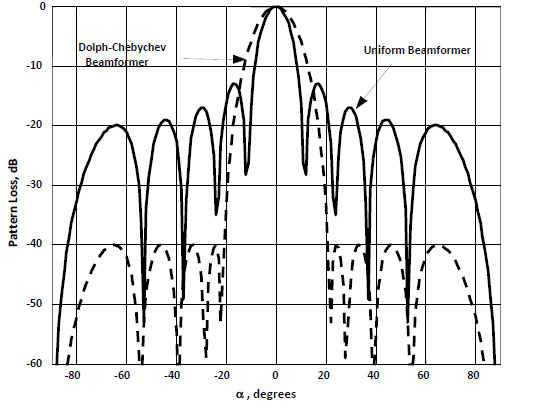
Even if all side lobes are smaller than the main one, they are undesirable because of the additional distortions introduced by them: the waves of the side lobes will also be reflected from some objects and move in the opposite direction to the sonon. Therefore, they have developed ways to reduce both side lobes when sound is emitted, as well as their consequences when receiving a reflected signal. The basic idea: you need to form a signal in this way in order to transfer energy from the side lobes to the main one, thereby reducing the level of the side lobes in amplitude. This is done with the help of preset patterns (the so-called “windows”) through which the signal passes. The most effective pattern proudly bears the name "Chebyshev window." In the example below, the signal that passed through the Chebyshev window is italicized:
To explore a specific area of space, the sonars are rotated at the required angle, thereby achieving the desired direction for the main lobe of the sound beam. There are still more subtle ways to direct the sound beam in the right direction.
 If the sonar is set to accept a signal (called a “passive mode”), the method described in the figure on the right can be used. The sound from the direction of interest comes to different elements of the aperture at different intervals of time. Depending on the required direction of the beam, the required delay is calculated for each element of the aperture, as a result of which a picture is taken from the desired direction. This method works great for accepting signals in which there are waves of a large frequency range, that is, "broadband" signals. The reasons for using broadband signals will be discussed in the next paragraph.
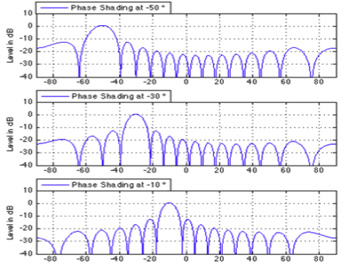
The signal of one frequency, or a very close frequency range, is called narrowband. In a narrowband signal, it is easier for us to see its periodic component. For this reason, there is no special need to calculate the different time intervals that the signal goes to different elements of the aperture, since after one period of the signal exactly the same period begins again, i.e. information is repeated. It is enough to take into account and use only the phase shift with which the signal arrives, or is radiated by different elements of the aperture. When we control the direction of the beam in this way, on the elements of the aperture, the signal is received / emitted with a different phase delay. In the picture on the right, you can observe how the main lobe of the beam is redirected as the phase changes. This method is called phase shading and is used for both passive and active sonar modes.
Inside the sonar. Signal processing
Inside, everything starts with a sinusoidal pulse generator. A typical generator consists of two components. First, it is an amplifier whose output is connected to its own input (“positive feedback”), due to which oscillatory signal deviations occur. The second component is an electrical filter. Inside the filter are inductors and capacitors, the resistance of which depends on the frequency of the applied signal. At certain frequencies, the resistance increases, which prevents the passage of the signal. With the help of different combinations of coils and capacitors, filtering out the necessary frequencies at the generator output is adjusted.
Next is a group of filters that have similarities with the described only, but slightly more complex. They are engaged in amplitude and phase shading, the formation of the direction and shape of the beam (this is all described above). Some more of their functions will be considered over time.
The signal is then fed to the amplifier and to the antenna, where it becomes a sound. The emitted sound signal has a certain length in time and is called a pulse. The impulse moves to the object under study, is reflected and returns back to the sonar. Sonar at this time is in the passive mode and waits for the return of the pulse, which again translates into an electrical signal. The pulse duration must be shorter than the time, which is supposed to be spent on the movement of the pulse from the sonar to the target and back, otherwise the result at the receiver will be added to the outgoing waves.
Let's look again at the filters and processes that the signal goes through before it is radiated by the antenna. However, after receiving the reflected signal, quite similar procedures are waiting.
Quadrature modulation
The higher the sound frequency (= shorter wavelength), the higher the resolution of the sonar (smaller elements can be detected). On the other hand, the high frequency carries less energy in each oscillation, so it is exposed to more noise and the signal-to-noise ratio decreases.
Consider one oscillation separately. It carries the maximum and minimum of its amplitude. Information in this case conveys the maximum amplitude, and the minimum is not actually used. What happens if you duplicate the signal under study, shift it in phase by 90 degrees and compare it with the original one? The maximum of the second signal will be at the same level as the minimum of the first. If these two signals are transmitted simultaneously in one channel, their frequencies will remain the same, but the information saturation will increase by 2 times, since the maximum amplitude transmitting information will occur 2 times more often. This simultaneous transmission of two signals is called quadrature modulation. This is a fairly common technique and it is used in many electronic devices.
Pulse compression
The power level of the sonar antenna, of course, is limited by some limits. However, we are interested in the signal energy being as high as possible, since this reduces the influence of noise on the signal, thereby increasing the resolution. Using longer pulses, it is possible to reduce the peak power of the transmitted pulse while maintaining the same energy level. When receiving, the pulse is compressed to a shorter one, which increases the peak power of the pulse. The peak power of a pulse after compression is many times the peak power that would have been without compression. Before sending, the pulse is extended in the same proportion in which it will be compressed upon arrival.
Linear frequency modulation
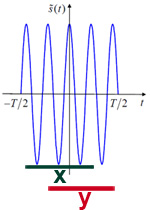 Suppose that such a signal was sent, as it is located on the left, and in response, a signal was received, as above segment X. How can we distinguish this signal from the similar signal over segment Y? This is impossible to do, since both signals are the same, only shifted in time. That is, there will be some uncertainty in the interpretation of the time interval, which corresponds to the incoming signal, respectively, there will be uncertainty in the distance to the object.
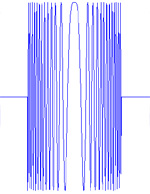
If the signal is the same as now in the figure on the right, it becomes possible to distinguish the corresponding time intervals. This technique is called linear frequency modulation, when the frequency increases or decreases linearly.
Gaussian envelope
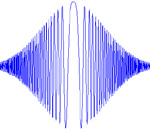 In the previous paragraph, the cobweb petals arising under the influence of interference were considered. These petals described the pressure distribution of the sound wave in a three-dimensional medium. It should be noted that the side lobes correspond to waves of smaller amplitudes. The amplitude at the same time decreases from the distance of the signal. So far we have implied that the peak of each oscillation has the same amplitude. Would it be useful to change the amplitudes of each oscillation according to a certain rule? Of course, since in this case we will be able to further differentiate the side-lobe signals, whose frequencies are reduced. By comparing how the amplitudes of the transmitted and received signals change at a certain frequency and finding discrepancies, it is possible to cut off the signals from the side lobes.
Doppler effect
 If you zoom in and out of the handset when it beeps, you can feel the smooth changes in tonality. This changes the perceived frequency of the sound. The effect of changing the frequency of the sound during movement is called the Doppler effect. The Doppler effect for electromagnetic waves differs significantly from that considered here, since there is no intermediate medium for them, which is a third party in the contact between the receiver and the transmitter of the wave. For sound, water is such a medium.
If we imagine that the vessel to which the sonar is attached is in motion, or the object of study is moving, it can be concluded that the frequency of the received signal will be changed in accordance with the Doppler effect. In this case, linear frequency modulation is again the cause of uncertainty and can be misleading: the signal is tied to time intervals by varying frequency, but this frequency is further modified by the Doppler effect.
Uncertainty chart
As described above, two signal modulation techniques are used simultaneously to reduce two uncertainties in the object parameters studied. The first uncertainty is related to the ability of the sonar to distinguish the time delay of the signal (the distance to the object), and the second is related to the Doppler effect (the speed of the object).
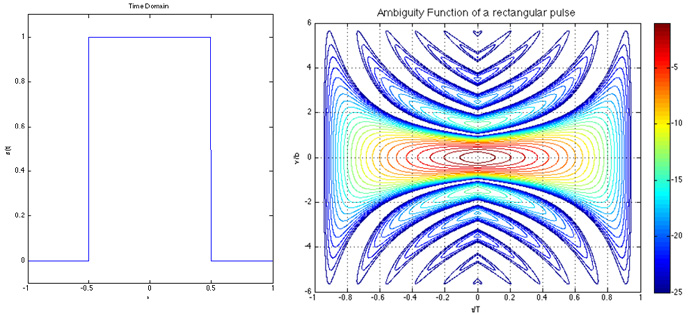
The diagram below shows the uncertainty levels for the unmodulated signal: the temporal delay on the horizontal axis and the frequency axis on the vertical axis. Here, uncertainties arise due to the reasons mentioned above: side lobes cause uncertainties associated with the Doppler effect (this can be seen as transverse arcs); Forms of one color show uncertainties in the range estimate, which are explained by the ambiguity of the time interval to which the incoming signal can be attributed (due to the invariance of each period at a constant frequency). The uncertainty diagram directly reflects the sonar resolution.
The following graph displays a linear frequency modulated signal. Due to the frequency, variable in proportion to the time, you can more accurately determine the time delay of the signal and the distance to the target. The Doppler effect, changing the frequency, introduces distortion. Also, the distortion of the side petals.
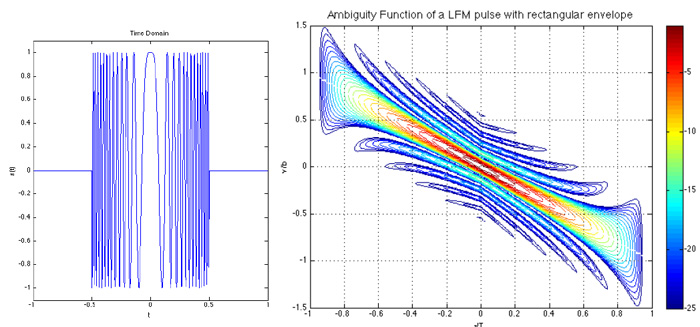
The following graph displays a linearly frequency-modulated signal with a Gaussian envelope (amplitude modulation). Now we can remove the side lobes of the frequencies, since we additionally compare the amplitudes of the outgoing and incoming signals, while the side lobes have less amplitudes than the main ones.
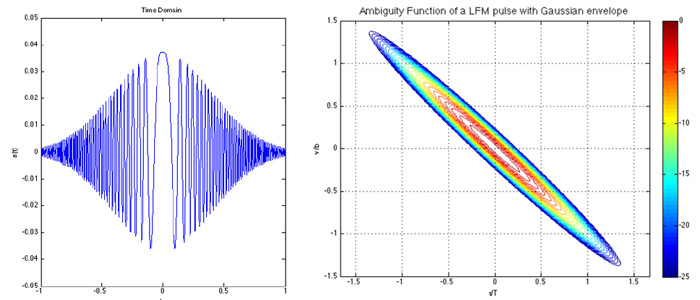
With an increase in the distance of the object, the amplitude of the signal diminishes proportionally during its movement to the object and back. If the same signal is also influenced by the Doppler effect, it becomes unclear what influenced the signal more - the amplitude decrease due to the range (the signal will be checked in frequency with the original, and the difference in amplitude will be the formation of a range assumption) or the Doppler effect (the signal will be checked for amplitudes with the original, and the frequency difference will be concluded about the speed of the object). These two overlapping assessment strategies in the diagram are clearly expressed in that the form stretches diagonally.
Matching filter
Earlier it was mentioned many times that the received signal is compared with the original one. This occurs in the matching filter, it contains copies of the original signals. Here, the signal is not only divided into fragments and compared, but also summed with the original signal, which allows reducing the amount of noise that the signal experienced on its way to the target and back. Here, signal distortions are initially estimated and calculations are made, what was the cause of the distortions. For example, here there is an absorption model that takes into account the possible dispersion of a pulse during its movement to the target and back. Here is the compression of the pulse.
Fast Fourier Transform
According to the Fourier transform, any signal (even noise) can be represented as a sum of sinusoids of different frequencies and phases (speaking more strictly, can be represented as spectral density). In a sinusoid, which is a periodic signal, the information is repeated many times - from period to period the same. After Fourier transform, these repetitions of information disappear. Fast Fourier Transform allows you to perform a transform with fewer calculations. The calculations in the matched filter occur with compressed fast Fourier transform signals, which requires special microcontrollers that perform mathematical operations.
Here is the order of what happens with the signal upon arrival at the antenna:
Preamplifier and bandwidth filter, automatic gain control => Quadrature demodulation => Anti-aliasing filter and digital conversion => Transition to a matching filter (pulse compression, the steps described above; motion compensation, micro-navigation, autofocus, artificial methods of increasing resolution ) => Image processing (formation of parts of the image, combining them, programmable detection and classification of targets) => Display on the screen.
Conclusion
Apparently, the dive was quite deep, but I want to believe that it was interesting. I also wanted to show how everything works in connection with each other, that every detail has a cause and effect - I will hope that it was possible.
Source: https://habr.com/ru/post/191594/
All Articles