Performance testing of various Swift OpenStack configurations
For those who are not familiar with the object storage of this Swift OpenStack, general information about the structure and algorithms has already been given in our blog: habrahabr.ru/company/mirantis_openstack/blog/176195 , habrahabr.ru/company/mirantis_openstack/blog/176455 .
If you already have an idea about Swift for OpenStack, then you know how dynamic and flexible this project is, constantly changing and absorbing only the best: encryption , forward error correction coding , and other updates in many areas of development. The main feature of the release Swift 1.9.0. is support for global clustering . This means that it provides the ability to distribute one cluster among a set of elements dispersed among themselves and connected by a network with high latency.
In order to see the real behavior of the new property, you will need testing tools that can reliably reproduce the required amount of work. Object data stores differ from the others in that instead of the tree hierarchy, non-nested sets of containers and unique tokens are used to store objects. So, to test object data storage, a special tool is needed - one that will work with Swift requests, following certain guidelines. And here comes ssbench and swift-bench, Swift's benchmarking tools for performance testing, developed by SwiftStack.
')
So, with the release of the new release, there is a need to find out how the innovations have affected (regions - a new level in the ring for placing information, network replication, new read and write properties) on performance.
Let's go over the new properties. Regions - a new top level in the ring, grouping zones. You can learn more about this structure and algorithm here . This level supports geographically distributed clusters, allows replicas to be placed in numerous physical regions, supporting proxy server localization (proxy affinity). Simply put, the proxy server will first use the local region, and with the help of replication, the objects will go to the other regions.
Performance testing for a single virtual machine with Swift-All-In-One (SAIO) installed was performed using swift-bench. This tool is part of the project itself and makes it easy to collect the necessary information for a standard configuration. We used ssbench to test the composite cluster, since it allows you to specify a more specific load. ssbench is also an open-sourced project created by SwiftStack, but not part of the Swift project.
The main problem with using swift-bench and ssbench was to study how the changes affected the average number of requests per second processed by the object store.
ssbench uses the message queue protocol to control and retrieve information. The script is described in a JSON file. Depending on the configurations made, different types of performance testing can be conducted: load, stability testing, and others.
Consider an example scenario in which 3 classes of tiny, small, medium are used, differing in size. "Initial_files" sets the number of files of a certain type. “Crud_profile” distributes the number of operations performed for each request as a percentage, considering that the sum of all values in crud_profile is 100% of the total number of operations in “operation_count”. For example, “crud_profile”: [3, 4, 2, 2] means that of the total number of requests, creating an object will take 27%, reading - 36%, updating and deleting - 18%. For the maximum number of parallel clients “user_count”, the number of containers “container_count” will be created, in the name of which there will be a prefix with a string from “container_base”. In this case, "container_concurrency" determines the number of clients to create containers.
Consider an example script:
{
"Name": "Medium test scenario",
"Sizes": [{# describe file types
"Name": "tiny",
"Size_min": 1000, # range of object size in bytes
"Size_max": 16000
}, {
"Name": "small",
"Size_min": 100000,
"Size_max": 200,000
}, {
"Name": "medium",
"Size_min": 1,000,000
"Size_max": 2,000,000
}],
"Initial_files": {# number of objects of the specified type
"Tiny": 20,
"Small": 20,
"Medium": 2
},
"Operation_count": 100, # number of requests
"Crud_profile": [3, 4, 2, 2], # distribution of requests among CREATE, READ, UPDATE and DELETE
"User_count": 5,
"Container_base": "ssbench",
"Container_count": 100,
"Container_concurrency": 10
}
ssbench supports v 1.0 and v 2.0 authorization, which means that you can use it both as an OpenStack component and as a separate object store.
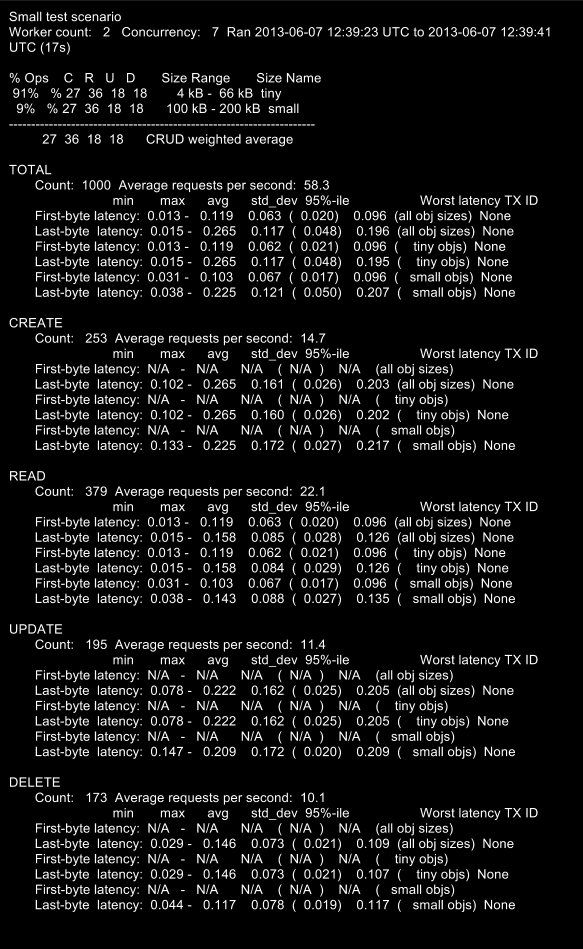
ssbench produces results in two formats. The first option is detailed statistics with information on the delay, on the processed number of operations per second and the total number of requests processed. The second option is a CSV table for creating histograms containing the number of requests processed per second.
Next, there will be an example of the ssbench report that was executed on a virtual machine with performance:
RAM: 2GB
VCPU: 1
Timing cached reads: 5432.52 MB / sec
Timing buffered disk reads: 57, 91 MB / sec
Using these tools to test performance, you will have the opportunity to evaluate different options for deploying Swift object data storage and choose the right one for you.
So, if you want to look at the results with a different set of regions, the number of devices and copies of objects, we offer this option:
• Group 4 devices in one region with 4 zones and 3 replicas
• Group 4 devices in one region with 2 zones and 3 replicas
• Group 4 devices in one region with 1 zone and 3 replicas
• Group 4 devices in two regions with 4 zones and 2 replicas
We compared the figures for the release of Swift 1.9.0 as it is being formed with the final master:
Proxy affinity
Comparison of the number of requests made when enabling and disabling proxy affinity:
- Grouped 4 devices in one region with 4 zones and 3 replicas
- 4 devices are grouped in one region with 2 zones and 3 replicas
- 4 devices are grouped in one region with 1 zone and 3 replicas
- Grouped 4 devices in two regions with 4 zones and 2 replicas
As you have noticed, the number of requests processed by GET increases, while PUT drops. This happened because 2 parameters were specified in the proxy settings for the recording: region and zone, which means that only 1 device would fit this rule. While for reading only the region was indicated, and therefore all devices of this region became local for reading.
Another performance testing method is to compare the results when the number of worker processes in ssbench increases. In the following example, each worker creates requests from 12 user:
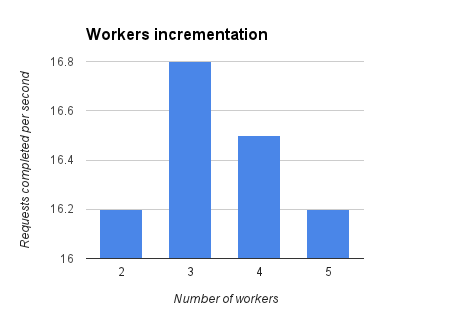
The idea of such a scenario is a gradual increase in the number of clients, until the performance starts to fall, which means that we have reached the limit of parallelization in the cluster.
To evaluate the results on the composite cluster, we divided 9 devices into 3 regions. One wizard collects data on all workers running on separate hosts and creating requests from 20 users. The script contains such parameters as: working with 100 containers, 100 files of sizes 512 MB.
We used this distribution to collect information by region.
• In the first case, only the local region is used.
• In the second and third, one non-local region is used.
• In the fourth case, two non-local regions are used.
• In cases 5-7 there is an increase in the number of worker
In step 6, we are faced with the limit of the cluster and the performance begins to fall.
This study allows us to firmly say that the release of Swift 1.9.0 is a breakthrough to meet the increase in the performance of your storage.
Here were presented some of the performance testing methods that we use to research and create products.
If you are interested in creating your own test environment, use the following links:
• ssbench github: github.com/swiftstack/ssbench
• ssbench SwiftStack blog: swiftstack.com/blog/2013/04/18/openstack-summit-benchmarking-swift
• Swift 1.9.0 in blog: lists.openstack.org/pipermail/openstack-dev/2013-July/011221.html
• Swift 1.9.0 info: launchpad.net/swift/+milestone/1.9.0
Original article in English
If you already have an idea about Swift for OpenStack, then you know how dynamic and flexible this project is, constantly changing and absorbing only the best: encryption , forward error correction coding , and other updates in many areas of development. The main feature of the release Swift 1.9.0. is support for global clustering . This means that it provides the ability to distribute one cluster among a set of elements dispersed among themselves and connected by a network with high latency.
In order to see the real behavior of the new property, you will need testing tools that can reliably reproduce the required amount of work. Object data stores differ from the others in that instead of the tree hierarchy, non-nested sets of containers and unique tokens are used to store objects. So, to test object data storage, a special tool is needed - one that will work with Swift requests, following certain guidelines. And here comes ssbench and swift-bench, Swift's benchmarking tools for performance testing, developed by SwiftStack.
')
So, with the release of the new release, there is a need to find out how the innovations have affected (regions - a new level in the ring for placing information, network replication, new read and write properties) on performance.
Evaluation of new features
Let's go over the new properties. Regions - a new top level in the ring, grouping zones. You can learn more about this structure and algorithm here . This level supports geographically distributed clusters, allows replicas to be placed in numerous physical regions, supporting proxy server localization (proxy affinity). Simply put, the proxy server will first use the local region, and with the help of replication, the objects will go to the other regions.
Tools
Performance testing for a single virtual machine with Swift-All-In-One (SAIO) installed was performed using swift-bench. This tool is part of the project itself and makes it easy to collect the necessary information for a standard configuration. We used ssbench to test the composite cluster, since it allows you to specify a more specific load. ssbench is also an open-sourced project created by SwiftStack, but not part of the Swift project.
purpose
The main problem with using swift-bench and ssbench was to study how the changes affected the average number of requests per second processed by the object store.
Structure
ssbench uses the message queue protocol to control and retrieve information. The script is described in a JSON file. Depending on the configurations made, different types of performance testing can be conducted: load, stability testing, and others.
Consider an example scenario in which 3 classes of tiny, small, medium are used, differing in size. "Initial_files" sets the number of files of a certain type. “Crud_profile” distributes the number of operations performed for each request as a percentage, considering that the sum of all values in crud_profile is 100% of the total number of operations in “operation_count”. For example, “crud_profile”: [3, 4, 2, 2] means that of the total number of requests, creating an object will take 27%, reading - 36%, updating and deleting - 18%. For the maximum number of parallel clients “user_count”, the number of containers “container_count” will be created, in the name of which there will be a prefix with a string from “container_base”. In this case, "container_concurrency" determines the number of clients to create containers.
Consider an example script:
{
"Name": "Medium test scenario",
"Sizes": [{# describe file types
"Name": "tiny",
"Size_min": 1000, # range of object size in bytes
"Size_max": 16000
}, {
"Name": "small",
"Size_min": 100000,
"Size_max": 200,000
}, {
"Name": "medium",
"Size_min": 1,000,000
"Size_max": 2,000,000
}],
"Initial_files": {# number of objects of the specified type
"Tiny": 20,
"Small": 20,
"Medium": 2
},
"Operation_count": 100, # number of requests
"Crud_profile": [3, 4, 2, 2], # distribution of requests among CREATE, READ, UPDATE and DELETE
"User_count": 5,
"Container_base": "ssbench",
"Container_count": 100,
"Container_concurrency": 10
}
ssbench supports v 1.0 and v 2.0 authorization, which means that you can use it both as an OpenStack component and as a separate object store.
results
ssbench produces results in two formats. The first option is detailed statistics with information on the delay, on the processed number of operations per second and the total number of requests processed. The second option is a CSV table for creating histograms containing the number of requests processed per second.
Next, there will be an example of the ssbench report that was executed on a virtual machine with performance:
RAM: 2GB
VCPU: 1
Timing cached reads: 5432.52 MB / sec
Timing buffered disk reads: 57, 91 MB / sec
Methodology
Using these tools to test performance, you will have the opportunity to evaluate different options for deploying Swift object data storage and choose the right one for you.
Ring Comparison
So, if you want to look at the results with a different set of regions, the number of devices and copies of objects, we offer this option:
• Group 4 devices in one region with 4 zones and 3 replicas
• Group 4 devices in one region with 2 zones and 3 replicas
• Group 4 devices in one region with 1 zone and 3 replicas
• Group 4 devices in two regions with 4 zones and 2 replicas
We compared the figures for the release of Swift 1.9.0 as it is being formed with the final master:
| commit | name | region | zone | PUTS | Gets | DEL |
| dec517e3497df25cff70f99bd6888739d410d771 | Drop cache after fsync | one | four | 26.4 / s | 107.8 | 32 |
| 13347af64cc976020e343f0fd3767f09e26598de | Merge "Improve swift's keystoneauth ACL support" | one | four | 35.1 | 116.8 | 32.9 |
| 151313ba8c6612183f6a733edbcbc311b3360949 | master swift 1.9.0 | one | four | 45.3 | 133.1 | 44.2 |
| 151313ba8c6612183f6a733edbcbc311b3360949 | master swift 1.9.0 | one | 2 | 49.1 | 160.3 | 51.3 |
| 151313ba8c6612183f6a733edbcbc311b3360949 | master swift 1.9.0 | one | one | 42.3 | 175.3 | 40 |
| 151313ba8c6612183f6a733edbcbc311b3360949 | master swift 1.9.0 | 2 | four | 54.3 | 109.8 | 49.7 |
Proxy affinity
Comparison of the number of requests made when enabling and disabling proxy affinity:
- Grouped 4 devices in one region with 4 zones and 3 replicas
| Disable | Enable | |
| PUTS | 45.3 | 7.2 |
| Gets | 133.1 | 160.3 |
| DEL | 44.2 | 55.2 |
- 4 devices are grouped in one region with 2 zones and 3 replicas
| Disable | Enable | |
| PUTS | 49.1 | 3.8 |
| Gets | 160.3 | 157 |
| DEL | 51.3 | 57,8 |
- 4 devices are grouped in one region with 1 zone and 3 replicas
| Disable | Enable | |
| PUTS | 42.3 | 55.3 |
| Gets | 175.3 | 160.3 |
| DEL | 40 | 55.2 |
- Grouped 4 devices in two regions with 4 zones and 2 replicas
| Disable | Enable | |
| PUTS | 54.3 | 3.4 |
| Gets | 109.8 | 136 |
| DEL | 49.7 | 49 |
As you have noticed, the number of requests processed by GET increases, while PUT drops. This happened because 2 parameters were specified in the proxy settings for the recording: region and zone, which means that only 1 device would fit this rule. While for reading only the region was indicated, and therefore all devices of this region became local for reading.
Bandwidth
Another performance testing method is to compare the results when the number of worker processes in ssbench increases. In the following example, each worker creates requests from 12 user:
The idea of such a scenario is a gradual increase in the number of clients, until the performance starts to fall, which means that we have reached the limit of parallelization in the cluster.
Other methods
To evaluate the results on the composite cluster, we divided 9 devices into 3 regions. One wizard collects data on all workers running on separate hosts and creating requests from 20 users. The script contains such parameters as: working with 100 containers, 100 files of sizes 512 MB.
| ID_run | r1-01 | r1-02 | r1-03 | r2-01 | r2-02 | r2-03 | r3-01 | r3-02 | r3-03 |
| one | master | worker | worker | ||||||
| 2 | master | worker | worker | ||||||
| 3 | master | worker | worker | ||||||
| four | master | worker | worker | ||||||
| five | master | worker | worker | worker | |||||
| 6 | master | worker | worker | worker | |||||
| 7 | master | worker | worker | worker | worker |
We used this distribution to collect information by region.
• In the first case, only the local region is used.
• In the second and third, one non-local region is used.
• In the fourth case, two non-local regions are used.
• In cases 5-7 there is an increase in the number of worker
In step 6, we are faced with the limit of the cluster and the performance begins to fall.
Conclusion
This study allows us to firmly say that the release of Swift 1.9.0 is a breakthrough to meet the increase in the performance of your storage.
Here were presented some of the performance testing methods that we use to research and create products.
If you are interested in creating your own test environment, use the following links:
• ssbench github: github.com/swiftstack/ssbench
• ssbench SwiftStack blog: swiftstack.com/blog/2013/04/18/openstack-summit-benchmarking-swift
• Swift 1.9.0 in blog: lists.openstack.org/pipermail/openstack-dev/2013-July/011221.html
• Swift 1.9.0 info: launchpad.net/swift/+milestone/1.9.0
Original article in English
Source: https://habr.com/ru/post/190956/
All Articles